USD/JPY Pair Gains Ground at the Start of the New WeekThe FOREXCOM:USDJPY USD/JPY pair strengthened at the start of the new week and is holding near its highest level since February 14th. This upward bias is driven by the weakness of the Japanese Yen (JPY) and the strengthening of the US Dollar (USD).
1. Market Fundamental Factors
A. Weakness in the Japanese Yen (JPY)
- BoJ Uncertainty: The JPY remains weighed down as investors are uncertain about the timing of the Bank of Japan's (BoJ) next interest rate hike.
- Fiscal Policy: Speculation that Japan's new Prime Minister, Sanae Takaichi, will pursue aggressive fiscal spending plans and resist policy tightening overshadowed strong Tokyo consumer inflation data.
- Global Sentiment: The optimistic mood in global financial markets undermines the JPY's status as a safe-haven asset.
B. Strength of the US Dollar (USD)
- Hawkish Fed: The USD stands firm near its highest level since early August, poised for further gains following the hawkish stance from the US Federal Reserve (The Fed).
C. Upside Containment Risks
- U.S Risk: Concerns about economic damage from a prolonged US government shutdown limit the upside.
- Japanese Intervention Risk: Speculation that Japanese authorities could intervene to stem further JPY weakness also keeps the currency pair from moving too aggressively.
From a technical perspective, the USD/JPY pair has a short-term positive bias supported by a key breakout and oscillators positioned in positive territory (away from the overbought zone).
A. Bullish Scenario
- Upside Trigger: A breakout of the 153.25 - 153.30 resistance and strength above the 154.00 figure last week is viewed as the main trigger for the bulls.
- Next Targets: The prospect of further gains is supported to move towards the intermediate resistance of 154.75 - 154.80 en route to the psychological 155.00 mark.
B. Bearish Scenario
- Initial Support: Any corrective pullback below the 154.00 figure is likely to find strong support near Friday's low, around 153.65.
- Key Support: This is followed by the former resistance-turned-support at 153.30 - 153.25 and the round figure of 153.00.
Bias Reversal: A decisive break below 153.00 could expose the 152.15 region. Continued selling below 152.00 would negate the short-term positive bias and drag USD/JPY towards the key support at 151.10 - 151.00.
Usdjpyanalysis

USDJPY Event Pivot Map for 3 to 7 Nov 2025What you are looking at
A clean level map built for a news heavy week. Price finished Friday near 154.00. The plan respects three things. The rate gap still favors the dollar on pullbacks. Liquidity is distorted on Monday with Tokyo closed. The main risk event is US payrolls on Friday. This idea gives you precise levels, simple if then rules, and invalidations so you can trade the week with calm execution. Education only.
How to set up the chart
Timeframe 1 hour for structure. Keep a 15 minute pane handy for entries.
Add previous week high and low. Mark 154.30 153.95 153.20 152.80 152.20 154.80 155.00 as horizontal lines.
Mark event windows in your session tool. Monday 10 00 for ISM Manufacturing. Wednesday 10 00 for ISM Services. Wednesday refunding communication during New York morning. Friday 08 30 for payrolls. All times New York.
No indicators are required. If you prefer a reference, add a simple session midpoint for New York to see where intraday auctions are leaning.
Why these levels matter
154.30 has acted like the top of a negotiation box. Above it the tape often accelerates into 154.80 and the round 155.00. 153.95 is the heart of the box where momentum decisions flip. 153.20 is the lower step where buyers have shown up after bad headlines. 152.80 and 152.20 are the deeper shelves from the prior stair step higher. None of these lines are sacred. They are places where inventory changes hands and where your risk can be defined.
Rules in three lines
• If price clears 154.30 on a real event and holds on a 15 minute close, trade long pullbacks toward 154.80 and 155.00 with stops under 153.95.
• If price loses 153.20 on soft data, trade short into 152.80 then 152.20 with stops back above 153.60.
• If price is inside 153.95 to 154.30 ahead of a release, fade extremes only with half size and fast invalidations.
Day by day mindset
• Monday. Tokyo is closed for Culture Day. Liquidity is thinner. Let Asia show its hand. ISM Manufacturing at 10 00 can push a quick move. If the print is firm and the first drive takes 154.30, wait for the retest. If the print disappoints and we slip through 153.65, look for 153.20.
• Tuesday. JOLTS at 10 00. Treat it as light steering. If it leans soft and we are already heavy from Monday, a test of 153.20 is likely. Avoid forcing a breakout in the middle of the box.
• Wednesday. BoJ minutes in the Japan morning. ISM Services at 10 00. Treasury refunding details during New York. This is your hinge day. If Services is firm and refunding leans heavy in duration, yields can pop and USDJPY can carry through 154.80. If Services is soft and refunding is benign, the pair can slide under 153.60 and test the lower shelves.
• Thursday. US Productivity and unit labor costs at 08 30. Japan household spending and wages later. Treat Thursday as a bridge into payrolls. Trade smaller. Let others over trade noise while you protect risk.
• Friday. Employment Situation at 08 30. The first move is often noisy. Give it fifteen minutes. If headline and wages beat and unemployment is steady, pullbacks into 154.50 are buys with eyes on 155.00. If the complex misses across the board, respect momentum lower into 152.80.
Position sizing and risk
Keep half size when price is inside 153.95 to 154.30. Expand only after a clean break on a real catalyst.
When fading, stops belong just beyond the level that defines your thesis. If you fade 154.30, your stop lives above the event high. If you fade 153.20, your stop lives below the sweep that fails to continue.
Take profits into the first target and trail the remainder behind a five to eight pip structure on the 15 minute chart.
Use a hard flat rule before payrolls if you are not in a free trade. The goal is longevity.
Three scenarios with invalidations
Baseline range. Monday through Wednesday morning ping between 153.95 and 154.30 while traders wait for Services and refunding. Buy the lower third and sell the upper third with five to eight pip stops. Invalidation is a 15 minute close beyond the box with follow through volume.
Dollar push. Services strong and refunding heavier in the long end. Price accepts above 154.30 then stair steps to 154.80 and 155.00. Buy pullbacks only. Invalidation is a 15 minute close under 153.95 after the event.
Dollar slip. Services soft then payrolls miss. Price loses 153.20 and finds supply on retests. Short rallies into 153.20 with targets 152.80 then 152.20. Invalidation is a 15 minute close back above 153.60 without a new data impulse.
Comparator versus a simple hold
This is an illustrative arithmetic example for the same week with a 154.00 anchor and a modest fee assumption of 0.5 pip per side.
• A naive hold that carries through payrolls from 154.00 to a hypothetical Friday settle at 154.40 gains 40 pips, but the path can include a 70 pip drawdown on a midweek miss.
• A level approach that buys the 153.95 retest after a confirmed break and takes profit near 154.80 then trails a remainder can bank 30 to 60 pips with a typical trade drawdown near 15 pips.
• The point is the ratio of return to drawdown. Even if the hold finishes with similar net pips, the level approach aims to cut the worst hole you dig. The smaller hole is what keeps you in the game next week. This is not a backtest. It is a risk framing you can apply in live conditions.
Common mistakes to avoid
• Chasing the first minute after 08 30 or 10 00. Let the first wave print a structure.
• Trading the middle of the box without a clear catalyst.
• Ignoring time of day. The option cut and the cash equity open can reverse intraday flows.
• Forgetting that official commentary risk increases as the pair drifts toward the upper one fifties. Treat that zone with extra respect even if it is not in play this week.
Final checklist
Levels drawn and alert lines set at 154.30 153.95 153.20 152.80 152.20 154.80 155.00.
Event alarms on Monday 10 00 Wednesday 10 00 Friday 08 30 New York time.
Plan written for each scenario with invalidation and size.
Goal for the week is a clean process and a healthy Return divided by Drawdown, not hero trades.
Educational material only.

USDJPY Bullish Bias - MonthlyThe price formed a strong bullish marubozu candle (monthly) and I anticipate that price might tap into the mid-supply zone at 159

USDJPY Possible breakout?USDJPY has started to move up the ladder with a strong momentum with uptrend continuation as montly close with strong bullish price action, price may continue to rise up/continue to trend as multiple timeframe is confirming uptrend continuation.

USDJPY Swing Setup – Breakout, Retest, and the Next Rally Ahead!💸 USD/JPY “Gopher” Profit Playbook | Thief Trader’s Swing Setup 💥
🧭 Market Plan:
The Bullish playbook stays active as USD/JPY shows a Triangular Moving Average breakout, followed by a pullback & retest phase.
Price is re-accumulating along the same moving average zone, hinting at strong momentum for the next escape rally 📈.
The MACD confirms bullish strength — showing healthy upward energy, backing this setup technically.
🎯 Entry Plan (Layering Style):
This setup follows Thief Trader’s Layering Strategy — using multiple buy limit orders to build a position dynamically across key zones.
💰 Buy Limit Layers:
150.000
150.500
151.000
151.500
(You can adjust or increase layers based on your own risk style.)
🛑 Stop Loss (Thief’s Guardrail): @149.000
⚠️ Note: Dear Ladies & Gentlemen (Thief OG’s) — this SL is my personal setup, not financial advice. Manage your risk your way.
🎯 Target Zone: @155.000
Reasoning: price may approach a strong resistance area, where overbought conditions + liquidity traps could emerge — it’s wise to secure profits before the crowd does.
⚠️ Note: Dear Ladies & Gentlemen (Thief OG’s), same here — this TP is my plan, adjust it to your own game.
🔍 Correlated Pairs to Watch:
💵 TVC:DXY (US Dollar Index): USD strength remains key. If DXY pushes higher, it’ll fuel this bullish USD/JPY wave.
💴 OANDA:EURJPY / OANDA:GBPJPY : Both show similar bullish continuation structures — momentum confirmation.
💰 OANDA:XAUUSD (Gold): Usually inversely correlated — a falling gold might support stronger USD/JPY moves.
💹 TVC:US10Y (US 10-Year Yield): Rising yields = strong USD, supportive to this trade’s thesis.
⚙️ Technical Key Points Recap:
✅ Triangular Moving Average breakout & retest (re-accumulation confirmed)
✅ MACD bullish crossover momentum intact
✅ Layered entry style allows position flexibility
✅ Clear invalidation & risk management level @149.000
✅ Exit target aligned with macro resistance near 155.000
🧠 Thief Trader’s Note
This playbook is designed for swing traders who prefer structured entries rather than single-point executions.
Thief’s layering strategy allows flexibility, averaging, and capital preservation while catching trend momentum.
🚀 Let's Ride This Wave Together!
✨ If you find value in my analysis, a 👍 and 🚀 boost is much appreciated — it helps me share more setups with the community!
#USDJPY #Gopher #ForexTrading #SwingTrade #TriangularMovingAverage #TMABreakout #ThiefStrategy #LayeredEntry #PullbackRetest #BullishSetup #ForexSignals #TechnicalAnalysis #ReAccumulation #ForexStrategy #TradingIdeas #RiskManagement #USD #JPY #DollarYen
Happy Trading & Stay Frosty! 🦊💰

USDJPY analysis – bullish for the week of 03 NovDaily chart
The 150.00 round number was a line in the sand for this pair. As the 50ema shows, price crossing above this region signaled transition of control to the bulls. Price then moved higher but encountered resistance at 153.00 area, pulled back to the 150.00 level again and then surged higher, this time overcame the 153 resistance and reached new highs. Price has moved up more than 440 pips from the 150 round number and seems to be pulling back again. However, IMO bulls still have control of this market.
H4 chart
The bullish bias is supported on this time frame too. If this continues next week, it is likely that the area around 153.00 will act as support and the bulls will be able to push the price higher. We can see the 20sma may also provide dynamic support and my 1st target will be the 154.50 area. If price action remains strongly bullish, taking partial profit and allowing the trade to run will be an option.
This is not a trade recommendation; it is merely my own analysis. Trading carries a high level of risk so carefully managing your capital and risk is important. If you like my idea, please give a “boost” and follow me to get even more.

USDJPY Is going UP! great buy trade opportunity!USDJPY is currently stuck inside a strong upward channel and has been moving in a bullish direction for a very long time. It bounced back up from the 50.0 golden fibonacci zone and is very likely to now head toward the 1.618 extension level. It recently broke through a very strong resistance zone (the white line drawn) and is now very likely to test the next resistance zone (the 1.618 extension level) - This is a great buy trade!

DeGRAM | USDJPY is preparing to break resistance levels📊 Technical Analysis
● USD/JPY is consolidating above the 152.00 support, maintaining a steady climb within a rising channel. A confirmed breakout above the 154.40 resistance line could push the pair toward 156.70, aligning with the upper boundary of the broader structure.
● The price structure supports continued bullish momentum as long as the support line remains intact.
💡 Fundamental Analysis
● The yen remains pressured by dovish BoJ policy, while stronger U.S. yields and robust GDP growth keep the dollar in demand.
✨ Summary
● Long bias above 152.00; target 156.70. Rising channel structure supports further bullish continuation.
-------------------
Share your opinion in the comments and support the idea with a like. Thanks for your support!

Is USD/JPY Preparing for a Downside Correction?USD/JPY has shown signs of exhaustion near the 30-minute resistance area after a strong upward leg from the previous support zone. A visible break of structure suggests potential short-term bearish pressure as sellers begin to step in near recent highs. Price action is signaling a possible retracement toward the next support base around 153.190, aligning with current technical patterns.
Key Levels:
Sell Entry: 153.900
Take Profit: 153.190
Stop Loss: 154.350
Reasoning:
Technically, the market structure has shifted after testing resistance, with a clear break of short-term bullish momentum. Candle formations and rejection wicks around the resistance confirm weakness, while a potential lower high setup supports the bearish bias.
Fundamentally, the yen could gain short-term strength as traders await fresh U.S. economic data and comments from Federal Reserve officials, which may weigh slightly on the dollar’s recent rally.
Disclaimer:
This analysis is for educational purposes only and not financial advice. Always manage your risk and follow your trading plan before executing any trade.

USDJPY: Bullish! Buy The Dips!Welcome back to the Weekly Forex Forecast for the week of July 28 - Aug 1st.
In this video, we will analyze the following FX market:
USDJPY
USDJPY is moving higher. It is in a bullish retracement, heading to the .786 fib. No reason to consider sells. USD is stronger versus a weak Yen.
Price is heading down to a +OB, where there is potential to take a high probability long position.
Enjoy!
May profits be upon you.
Leave any questions or comments in the comment section.
I appreciate any feedback from my viewers!
Like and/or subscribe if you want more accurate analysis.
Thank you so much!
Disclaimer:
I do not provide personal investment advice and I am not a qualified licensed investment advisor.
All information found here, including any ideas, opinions, views, predictions, forecasts, commentaries, suggestions, expressed or implied herein, are for informational, entertainment or educational purposes only and should not be construed as personal investment advice. While the information provided is believed to be accurate, it may include errors or inaccuracies.
I will not and cannot be held liable for any actions you take as a result of anything you read here.
Conduct your own due diligence, or consult a licensed financial advisor or broker before making any and all investment decisions. Any investments, trades, speculations, or decisions made on the basis of any information found on this channel, expressed or implied herein, are committed at your own risk, financial or otherwise.

USDJPY Is going UP! great buy trade opportunity!USDJPY is currently stuck inside a strong upward channel and has been moving in a bullish direction for a very long time. It recently broke through a very strong resistance zone (the white line drawn) and is now very likely to test the next resistance zone (the upper red trendline) - This is a great buy trade!

USD/JPY Upside Potential Buy SetupUSD/JPY is positioned near 153.600, showing signs of upside potential as the yen softens and the dollar remains robust. Momentum could carry the pair toward the next resistance zone if support holds and sentiment remains favorable.
Key Levels:
Buy Entry: 153.600
Take Profit: 154.017
Stop Loss: 153.250
Reasoning:
Technically, the pair is forming a base around 153.600, with recent consolidations hinting at a breakout toward 154.017.
Fundamentally, the yen continues to face pressure while the Bank of Japan remains cautious and the U.S. Federal Reserve maintains policy divergence—supporting dollar-yen strength. Recent comments from finance officials in the U.S. and Japan also suggest that exchange rates reflect fundamentals, reducing immediate intervention risk.
Disclaimer:
This analysis is for educational purposes only and does not constitute financial advice.

USDJPY Local Short!
HI,Traders !
#USDJPY went up and made
A retest of the horizontal
Resistance of 153.179 from
Where we will be expecting
A local bearish pullback
And a move down !
Comment and subscribe to help us grow !

USDJPYUSDJPY
- Completed " 12345 " Impulsive Waves and " A " Corrective Wave
- Supply Zone
- Order Block
- Fibonacci Level - 38.20% - 50.00%
- Fair Value Gap

USDJPY IDEA FOR 28, OCT 2025.The US Dollar against the Japanese Yen is still overall bullish but short-term bearish, which is currently trying to form an M pattern on the Daily timeframe and 4Hour respectively and also the market may be coming back down to clear a previous Gap of inactivity it had left behind during the previous trading weeks which will be propelled by new information and volume through News which is expected to be coming into the markets shortly at the beginning of the new trading month.

Japanese Yen Consolidates Near Critical SupportFenzoFx—Japanese Yen is consolidating near 0.0065 after the price slightly gapped below this level on Monday. This level has further support from the lower line of the bearish channel.
The primary trend is bearish. However, the currency is oversold. Therefore, a consolidation toward higher resistance levels is expected before the downtrend resumes. In this scenario, JPY could tap into the liquidity void at 0.0066. This level can provide a premium price to sell JPY against other major currencies such as GBP and EUR.

DeGRAM | USDJPY is correcting📊 Technical Analysis
● USD/JPY formed a rising wedge pattern and broke below its support line, confirming a bearish reversal from the 152.45 resistance.
● Price is now heading toward 151.65, with potential continuation to 151.13 if momentum accelerates, aligning with prior demand levels.
💡 Fundamental Analysis
● The yen strengthens as traders anticipate potential BoJ policy tightening, while softer U.S. economic data weighs on dollar sentiment.
✨ Summary
● Short bias below 152.45; targets 151.65–151.13. Technical breakdown and shifting fundamentals favor near-term downside.
-------------------
Share your opinion in the comments and support the idea with a like. Thanks for your support!

DeGRAM | USDJPY reached the resistance level📊 Technical Analysis
● USD/JPY is testing the 152.94 resistance after forming a rising wedge pattern, indicating potential exhaustion of bullish momentum.
● Price action shows repeated upper wick rejections, suggesting a corrective pullback toward 152.45 and possibly 151.65 support levels.
💡 Fundamental Analysis
● The yen finds renewed demand amid speculation of BoJ intervention as the pair approaches multi-decade highs, while soft U.S. PMI data adds downside pressure.
✨ Summary
● Short bias below 152.94; targets 152.45–151.65. Rising wedge formation and macro backdrop support short-term correction.
-------------------
Share your opinion in the comments and support the idea with a like. Thanks for your support!

USD/JPY Declines Amid Trump’s Visit to JapanUSD/JPY Declines Amid Trump’s Visit to Japan
The Japanese yen strengthened on Monday, pushing the USD/JPY pair below the ¥152 mark. The move can be seen as a market reaction to U.S. President Donald Trump’s visit to Japan, where he met with the newly elected Prime Minister, Sanae Takaichi.
During the visit, the two leaders proclaimed a “new golden era” in U.S.–Japan relations and signed:
→ an official trade agreement introducing a 15% tariff on Japanese exports;
→ a deal on the supply of rare earth metals.
According to several media reports, Sanae Takaichi plans to nominate Donald Trump for the Nobel Peace Prize and invest around $550 billion in the U.S. economy.
Technical Analysis of the USD/JPY Chart
Applying a regression channel from the key low recorded on 17 September reveals a clear upward structure, which effectively illustrates major price movements (marked with arrows):
1 & 3 → rebounds from the lower boundary of the channel;
2 → reversal from the upper boundary;
4 → a consolidation phase near the median line, where supply and demand are balanced.
The latest decline from the median can be viewed as a sign of shifting sentiment, suggesting that sellers may now target the lower boundary of this channel. However:
→ the 151.50 level represents a notable support zone, having held firm on 21–22 October;
→ bearish conviction is also reinforced by the pair’s repeated failure to close above ¥153, forming what appears to be a Double Top pattern.
Whether the pair will reach the lower edge of the regression channel largely depends on the broader fundamental backdrop:
→ Trump’s international tour continues, with traders awaiting his meeting with China’s leadership;
→ this week’s key events include interest rate decisions from the Federal Reserve on Wednesday and the Bank of Japan on Thursday — the latter drawing particular attention given the recent change in Japan’s leadership.
This article represents the opinion of the Companies operating under the FXOpen brand only. It is not to be construed as an offer, solicitation, or recommendation with respect to products and services provided by the Companies operating under the FXOpen brand, nor is it to be considered financial advice.

USDJPYUSDJPY – Possible Correction After Rejection at Resistance
The pair has been in a strong uptrend, but is showing signs of exhaustion as it approaches the resistance zone at 153.250. After multiple unsuccessful breakout attempts, the price begins to lose momentum and breaks the short-term trendline.
As long as the price remains below this resistance, there is room for a correction to the support zone at 151.500, where the market can seek new liquidity before deciding its next directional move.

DeGRAM | USDJPY is forming an ascending wedge📊 Technical Analysis
● USD/JPY is forming a rising wedge pattern after a strong recovery from 151.50, signaling potential exhaustion near the 152.90 resistance.
● Price action shows waning momentum with divergence and repeated upper channel rejections, suggesting an upcoming correction toward 152.50–151.70 support.
💡 Fundamental Analysis
● The yen gains short-term support as intervention rumors reemerge amid Japan’s ongoing verbal warnings, while softer U.S. yields weigh on the dollar.
✨ Summary
● Short bias below 152.90; targets 152.50–151.70. Bearish structure and policy tension imply near-term correction risk.
-------------------
Share your opinion in the comments and support the idea with a like. Thanks for your support!

USD/JPY Price Outlook – Trade Setup📊 Technical Structure
FX:USDJPY USD/JPY is trading near a two-week high, supported by a steady uptrend line. Price is currently consolidating just below the resistance zone (153.23 – 153.30), with support holding at 152.80 – 152.90. The bullish bias remains intact as long as the uptrend line is respected.
📌 Trade Setup
Entry: 152.90 – 152.81 (pullback to support/uptrend line)
Stop Loss: 152.79 (below support)
Take Profit: 153.30 (resistance zone)
Risk–Reward (R:R): ≈ 1 : 4.44
🌍 Macro Background
The Japanese Yen remains under pressure as fiscal concerns dominate sentiment, with new Prime Minister Sanae Takaichi expected to continue expansionary spending policies, limiting the scope for rapid monetary tightening. While Japan’s Services PPI rose to 3.0%, bolstering the case for a future BoJ rate hike, it has failed to lift the Yen significantly.
Meanwhile, US CPI data (0.3% MoM, 3% YoY) has reinforced bets for a Fed rate cut this week, followed by another in December. This divergence between the Fed’s dovish stance and the BoJ’s cautious tightening outlook adds to market uncertainty. Traders are likely to remain cautious ahead of the Fed decision on Wednesday and the BoJ meeting on Thursday, making these central bank events critical for the next major move.
🔑 Key Technical Levels
Resistance: 153.23 / 153.30
Support: 152.80 / 152.75
Trendline Support: 152.90
Upside Extension (if breakout): 153.50 – 153.60
📋 Trade Summary
USD/JPY maintains a bullish bias as long as the pair holds above 152.80 support. A pullback entry near 152.90 offers a favourable risk–reward setup toward 153.30. However, traders should be prepared for heightened volatility around the Fed and BoJ policy announcements later this week.
⚠️ Disclaimer
This analysis is for reference only and does not constitute trading advice. Trading involves significant risk, and proper risk management is essential.

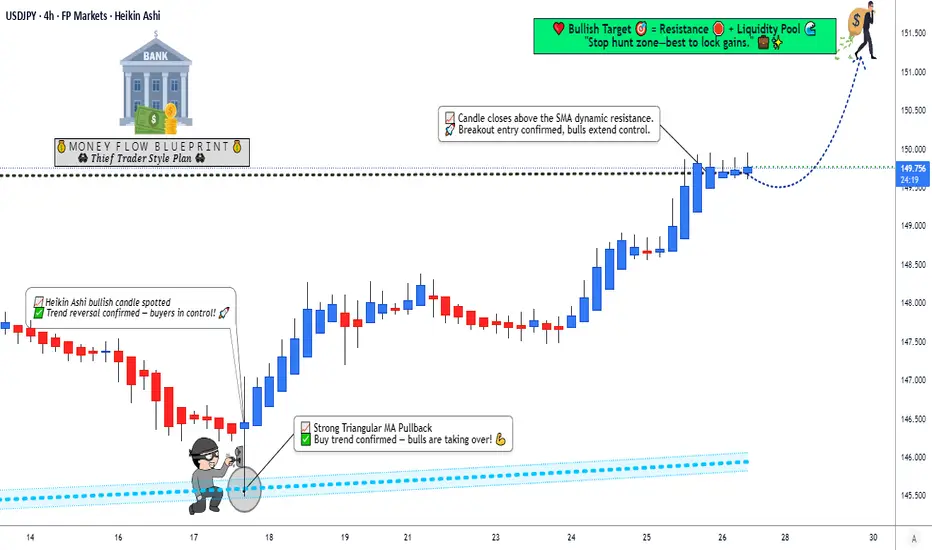
USD/JPY Bulls on the Move! Key Resistance Levels in Focus📈 USD/JPY "The Gopher" 🐹 — Forex Market Wealth Strategy Map (Swing/Day Trade)
Plan (Bullish Setup):
We’ve got a thief’s map unfolding here 👀. Confirmation builds as:
✅ Heikin Ashi Doji turning bullish
✅ Triangular Moving Average pullback
✅ Simple Moving Average breakout (dynamic resistance cleared!)
That’s our green light 🚦 for a potential bullish swing.
Entry (Layering Strategy 🧩):
The Thief Strategy = multiple limit orders, layered in style 🎭.
Buy limit layers: 149.000, 149.300, 149.600
(You can scale in further if price plays around your zone 📊)
This approach lets us sneak in like pros instead of going “all-in” at once 🔑.
Stop Loss (Risk Escape Hatch 🔓):
📍 Thief SL: 148.000
⚠️ Note: Dear Ladies & Gentlemen (Thief OG’s) — this is not a fixed rule. Manage your own risk wisely. You make money 💵, you take money 💼.
Target 🎯:
Resistance zone + overbought levels = possible trap.
Our escape target: 151.300 🏁
⚠️ Again — this is optional. Lock in profits where you feel comfortable.
🔍 Related FX Pairs to Watch:
OANDA:EURJPY — Often moves in tandem with JPY crosses.
OANDA:GBPJPY — A more volatile cousin, sometimes leading signals.
TVC:DXY (US Dollar Index) — Strength here adds weight to USD/JPY bullish bias.
OANDA:CHFJPY — Another JPY cross that can highlight safe-haven flows.
Correlation check keeps us one step ahead 🕵️.
✨ “If you find value in my analysis, a 👍 and 🚀 boost is much appreciated — it helps me share more setups with the community!”
⚠️ Disclaimer: This is a Thief Style Trading Strategy — shared for educational & entertainment purposes only. Not financial advice. Trade safe!
#USDJPY #Forex #SwingTrade #DayTrading #LayeringStrategy #TradingPlan #ThiefTrader #JPY #DXY #ForexStrategy