USDJPY Set to drop to support?USDJPY trade setup for today :
Before we look at potential entry in this pair first let’s look at multiple timeframe analysis in this market.
Monthly: 150.79 Monthly resistance price has got rejection strongly from the top
Weekly: Previous weekly closed with bearish engulfing patter with liquidity grab.
Daily: Upon formation of head and shoulder price has got rejection with a strong momentum and price may continue to drop to support level.
Entry timeframe 4H : As price has confirmed cross over of 20ema and 10ema we may see price continue to drop to daily support level.
Possible trade recommendation : Bearish with SL above the sessions high.
Usdjpyidea

USD/JPY) Bullish Trend Read The captionSMC Trading point update
Technical analysis of USD/JPY (2H) analysis you shared:
---
Technical Breakdown
1. Price Action & Zone
Price retraced into a Fair Value Gap (FVG) / demand zone (yellow box) around 147.00 – 147.40.
Strong buying interest is visible from this zone.
2. Falling Wedge Pattern
A falling wedge has formed, which is typically a bullish reversal pattern.
Price is attempting to break out above wedge resistance, showing potential for upside momentum.
3. EMA (200 Close)
Price is interacting with the 200 EMA (147.58), serving as dynamic resistance.
A sustained breakout above this EMA would confirm bullish continuation.
4. RSI (14)
RSI currently around 46–50, suggesting neutral momentum with room for upside.
---
Trade Idea
Bias: Bullish
Entry Zone: On breakout & retest of wedge / demand zone.
Target: 148.680 (as marked).
Invalidation: Below 146.60 (clear break under demand/FVG zone).
Mr SMC Trading point
---
This setup suggests a bullish reversal from support, with a likely push toward 148.68 after wedge breakout.
please support boost 🚀 this analysis)

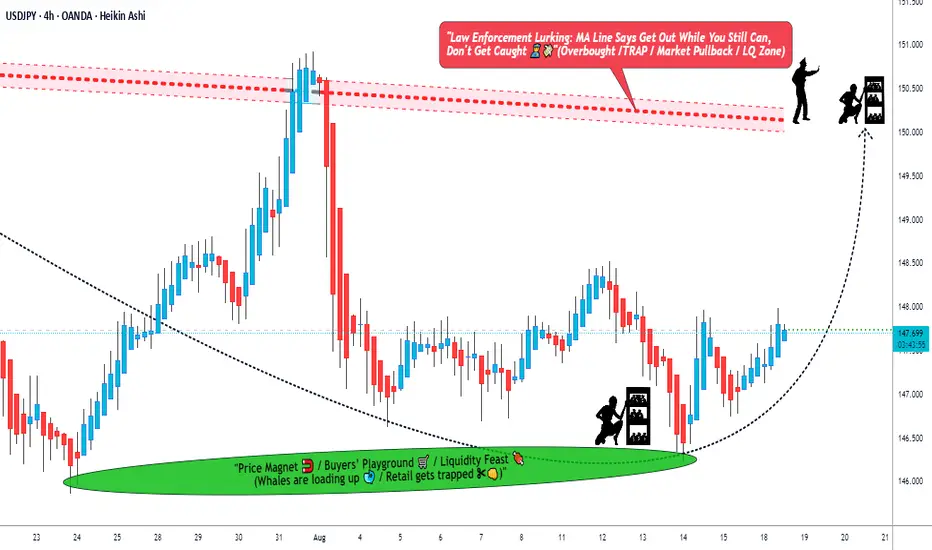
USDJPY: Multi-Timeframe Liquidity Hunt Setup - Monthly OutlookSharing my longer-term perspective on USDJPY with a two-phase liquidity scenario. 📊
**🎯 The Big Picture:**
I'm expecting a classic two-phase move: first a liquidity hunt down to the lower purple line (white-boxed zone), followed by a strong rally up to the upper purple line. This would represent my ideal scenario for the coming months. 📈
**📍 Liquidity Zones Explained:**
The purple lines (highlighted in white boxes) represent key liquidity zones where stops are likely parked. Markets love to sweep these levels before making their real moves - it's textbook institutional behavior. 💰
**⏰ Timing Expectations:**
I expect the downside liquidity hunt to occur within the remaining days of this month or early next month. These moves often happen faster than people anticipate. ⚡
**🛡️ Invalidation Level:**
The yellow line marks the low of a strong weekly bullish candle - a significant structural point. If price breaks below this level, it would invalidate this bullish scenario entirely. 🚨
**🧠 Why This Setup Makes Sense:**
This type of liquidity grab followed by reversal is classic market mechanics. The lower liquidity zone represents trapped shorts and protective stops - perfect fuel for the eventual rally to the upper target. 🔄
**⚠️ Risk Management:**
Clear invalidation point below the yellow line, targeting the upper liquidity zone for a clean setup with defined parameters. 🎯
📈 **This trade setup offers a risk-to-reward ratio of 5:1.** Without including fees, the breakeven win rate for this trade would be approximately 16.67%. Knowing these figures in advance helps me avoid emotional trading. 🧠
💡 **Pro Tip**: If you often find yourself trading based on emotions, I recommend doing this type of pre-planning and quantifying your setups before execution — it can be a simple yet highly effective improvement. ✅
---
**Trading is simple.** You don't need multiple indicators or dozens of lines on your chart. A clean and simple chart often works best — it keeps your decisions consistent and reduces uncertainty. Sure, it might not look flashy, and my analysis may seem a bit "plain" compared to others… but that's how I like it. If you find this analysis useful, feel free to follow me for more updates.
---
*Disclaimer: This post is for general informational and educational purposes only. It does not constitute financial advice, investment recommendation, or a service targeting specific investors, and should not be considered illegal or restricted information in any jurisdiction.*

"The USDJPY Ninja Trade – Silent Entry, Big Exit!"🚨💰 USD/JPY “The Ninja” Forex Bank Heist Plan (Swing Trade) 🐱👤💴💵
🎭 Dear Money Makers, Robbers & Thief OG’s,
It’s time to gear up for our biggest Ninja heist on the Forex streets!
We’re breaking into the USD/JPY vault with a Bullish Master Plan – grab your mask, load your limit orders, and let’s rob the market clean! 💰🔫
🗡️ Heist Entry (Layering Style) 📈
Thief doesn’t enter with one bullet – we spray the vault with multiple limit orders! 🎯
First layer: 147.600
Second layer: 147.400
Third layer: 147.200
👉 Add more layers if you want a deeper pullback entry – the more locks you pick, the bigger the loot! 🏦💎
🛑 Thief Stop Loss
This is Thief SL 🔒: 146.500
But remember, dear ladies & gentlemen (Thief OG’s) – adjust your SL based on your own strategy, capital & risk appetite. Stay slick, don’t get caught! 🚔💨
🎯 Target Escape Zone
Police barricade spotted 🚨👮 @ 150.700
Our heist exit point is locked at 150.000 🏃♂️💨
👉 Make sure you grab the loot & escape before the cops arrive. Take profit & celebrate with stolen sushi 🍣 & sake 🍶!
⚠️ Thief Trading Notes
News drops = extra police patrols 🚔 – avoid opening fresh entries during major releases.
Trail your stops to lock in profits – no thief leaves empty-handed!
Stay alert to price traps – don’t get stuck behind enemy lines.
💎 If this heist plan made you some loot, smash that 💖 & BOOST button to power up the Thief Gang 🚀🤝💰
The more boosts, the bigger our robbery squad becomes!
Stay tuned, Ninjas 🐱👤 … the next heist plan is already loading.
💵💎🚀 Thief Trader OUT.
USDJPY : LONG OPPORTUNITY, MOMENTUM BREWING NICELY FOR UPSIDERefer to trendline drawn on chart. USDJPY is heading to retest 151.
Long @ 147.60
TP 150.80
SL 146.05

USDJPY Next Week | Short From 147.56 Targeting Liquidity SweepHere’s my outlook for USDJPY in the coming week.
If price rises to around 147.56 in the early part of next week (Aug 18–22), I believe it’s a good area to consider going short. This level has acted as resistance several times recently, and I expect it could hold once again.
If price fails to reach 147.56, I won’t take the trade — in that case, the risk-to-reward profile would likely deteriorate, and I prefer to avoid setups where my predefined advantage is weakened.
The stop loss should be placed above the white line. From experience, once price breaks above that line, it often continues to take out the highs above it. That’s why I believe placing a stop here is both reasonable and sufficient.
The purple line below marks a level where I expect price could extend to if it sweeps the liquidity (stop losses) resting around recent lows. This purple line is located roughly halfway between the previous low and the nearby high beneath it. Based on my years of trading experience, when price breaks a low, it rarely reverses immediately; more often, it continues a bit further before turning around.
For that reason, I allow a small buffer and set my take profit around the 0.382 Fibonacci level between those two price points.
My plan is to hold the short position until that level, then take profit and start looking for a potential long setup from there.
In my view, 147.56 is likely to be reached sometime next week, so I will post an update once we see how the market reacts.
This trade setup gives a risk-to-reward ratio of 6.5. Without including fees, the breakeven win rate for this trade would be approximately 13.33%. Knowing these figures in advance helps me avoid emotional trading.
If you often find yourself trading based on emotions, I recommend doing this type of pre-planning and quantifying your setups before execution — it can be a simple yet highly effective improvement.
I’ll be sharing updates on how this idea plays out, so if you want to follow along and see the outcome, consider following me here on TradingView.
---
*This post is for general informational and educational purposes only. It does not constitute financial advice, investment recommendation, or a service targeting specific investors, and should not be considered illegal or restricted information in any jurisdiction.*

USDJPY - ShortUSDJPY Analysis - SELL 👆
In this Chart USDJPY H4 Timeframe: By Nii_Billions.
❤️This Chart is for USDJPY market analysis.
❤️Entry, SL, and Target is based off our Strategy.
This chart analysis uses multiple timeframes to analyze the market and to help see the bigger picture on the charts.
The strategy uses technical and fundamental factors, and market sentiment to predict a BEARISH trend in USDJPY, with well-defined entry, stop loss, and take profit levels for risk management.
🟢This idea is purely for educational purposes.🟢
❤️Please, support our work with like & comment!❤️

USDJPY ready to drop another 100 pip?USDJPY has done a fake out with retest of the daily high price started to move back to the major direction of the trend with second step liquidity grab 147.27 level with a price action confirmation to reject further back below. As the last day of trading week price may continue to drop to long term support 145.90 with further possibility to reject back below.

USD/JPY 1D Forex Chart - August 12, 2025daily performance of the U.S. Dollar (USD) against the Japanese Yen (JPY) as of August 12, 2025. The current exchange rate is 148.277, reflecting a 0.09% increase (+0.136). The chart includes a trendline indicating a potential upward movement, with a buy signal at 148.277 and a sell signal at the same level. Key support and resistance levels are marked, with a notable range between 146.786 and 151.234. The chart spans from early 2025 to mid-2026, showing historical price action and future projections.

USDJPY potential buy area!USDJPY 4H price has formed 2 important impulse and started to move back to the upside with new series of higher high and higher low showing a potential trend continuation.
Daily price is just crossed above 10ema and may pullback to daily 10ema which is also 4h support an important level where a bullish trade is high probale.

USD/JPY Poised for Breakout as Fundamentals & Technicals AlignUSDJPY is entering a critical juncture where both macroeconomic conditions and price structure are pointing toward a potential bullish continuation. The pair has been consolidating just under a descending trendline after a sharp drop from July’s highs, but strong US fundamentals, a persistently dovish Bank of Japan, and upcoming political catalysts are creating the perfect environment for an upside breakout. If buyers can reclaim momentum above near-term resistance, the path toward retesting multi-month highs appears open, with yen crosses likely to follow the lead.
Technical Analysis (4H Chart)
Price is consolidating around 147.46 after falling from the 150.91 high.
A descending trendline from the late-July peak is being tested. A confirmed breakout would likely accelerate bullish momentum.
Key upside targets:
148.96 – immediate resistance & short-term target (previous swing high).
150.91 – major resistance at July’s high.
Stop-loss at 146.43 safeguards against deeper retracements.
The structure reflects a series of bullish continuation patterns (flags, breakouts, retracements).
Fundamental Analysis
Current Bias: Bullish
USD Strength: Strong US data and anticipation of Trump’s “major” economic announcement are lifting the dollar.
JPY Weakness: Despite better-than-expected Japan Eco Watchers Survey, the BoJ’s ultra-loose stance continues to suppress yen demand.
Rate Differentials: Still heavily in USD’s favor, sustaining upward pressure on USD/JPY.
Risk Sentiment: Even with mild geopolitical tensions, USD’s safe-haven appeal is preventing JPY from benefiting.
Risks:
Disappointing US political announcements.
Hawkish surprises from the BoJ.
Sharp swings in risk sentiment favoring the yen.
Key News/Events Ahead:
Trump’s economic policy reveal.
US CPI & PPI releases.
BoJ policy signals or commentary.
Leader/Lagger Dynamics:
USDJPY is the leader for yen crosses, often setting the tone for GBPJPY, AUDJPY, and CHFJPY.
Summary:
USDJPY’s bullish outlook is reinforced by the combination of favorable fundamentals and a technical setup pointing toward a breakout. A move above 147.80–148.00 could open the door to 148.96 in the short term and 150.91 in the medium term. With yen crosses closely tied to USDJPY’s movements, this pair’s breakout could spark broader JPY weakness across the board, making it a pivotal chart to watch in the days ahead.

USDJPY Looks Bearish, Your thoughts ?USDJPY Looks Bearish, It has been falling hard after touching resistances. Now it will continue to glide. Check your support and resistances and open positions accordingly. Wait for Price Again and strong solid breakouts to enter the market.
Disclaimer:
The content presented in this IMAGE is intended solely for educational and informational purposes. It does not constitute financial, investment, or trading advice.
Trading foreign exchange (Forex) on margin involves a high level of risk and may not be suitable for all investors. The use of leverage can work both for and against you. Before deciding to participate in the Forex market, you should carefully consider your investment objectives, level of experience, and risk tolerance.
There is a possibility that you may incur a loss of some or all of your initial investment, and therefore, you should not invest money that you cannot afford to lose. Be fully aware of all the risks associated with foreign exchange trading, and seek advice from a licensed and independent financial advisor if you have any doubts.
Past performance is not indicative of future results. Always trade responsibly.

USD/JPY Robbery Route | Enter at Dip, Exit Before Police💥USD/JPY Forex Money Heist Plan 🎯 — Ninja Robbery at 146.000💥
🌟 Hi! Hola! Ola! Bonjour! Hallo! Marhaba! 🌟
Dear Market Bandits, Money Makers & Risky Robbers 🤑💰💸✈️
Welcome to another Thief Trader-style operation. We've cracked open the USD/JPY vault (aka "The Gopher" 💹), and here's the blueprint to pull off this forex heist like true professionals. 💼🎭💵
🚨 Strategy Overview
This isn't just a trade – it’s a well-researched, precision-timed robbery mission based on technicals, macro analysis, sentiment, and the bigger global picture.
Expect action near critical zones – especially the moving average barricade, where police (aka risk) is waiting. Stay sharp.
🔓 Entry Point – Unlock the Vault
📈 Watch for bullish pullbacks near 146.000.
Whether it's a dip, zone test, or wick bounce — you’re looking to layer buy limit orders like a seasoned thief using DCA tactics.
Enter on swings or any bullish confirmation.
Heist Window is Open.
🛑 Stop Loss – Escape Route
📍 SL near 143.000 (1D swing low) — adjust based on your capital and position size.
💡 Don’t go blind — SL is your backup plan, not an optional accessory.
Custom-fit it based on how many entries you’re stacking.
🎯 Target – Vault Exit Point
🏁 151.000 or exit before resistance heat catches on.
No greedy thieves here — precision exit is key.
Lock profits, vanish in style. 🕶️💼💸
🧲 Scalpers Take Note
Only long side raids are valid. Scalping against the trend? That's walking into a trap.
Use trailing SLs and protect your loot.
Small bag or big vault — play your game smart. 🎯💰
📢 Fundamental Boosters
USD/JPY’s bullish run isn’t random — it’s backed by:
📊 Macro shifts,
📈 COT reports,
🧠 Sentiment drivers,
📉 Intermarket trends,
And a whole mix of thief-level intel 🔍
🧭 Dive deeper before acting. The map’s been provided. 🔗🌍
🗞 News Traps Ahead – Move Cautiously
🚫 Avoid new trades during major releases
🔁 Use trailing SLs on open positions
💡 Position management is a thief’s best defense. Risk management keeps you in the game. 🎯🧠
🔥💖 Support the Heist Crew
Smash that ❤️🔥 Boost Button to keep our robbery engine running.
Each boost = strength for our crew.
💬 Share the love, spread the intel, and trade like a rogue with brains. 🤝💵
👀 Stay tuned for more high-profile FX heists from Thief Trader.
Until next time — loot wisely, vanish clean. 🐱👤💨

USD/JPY) support boost Bullish Trend Read The captionSMC Trading point update
Technical analysis of USD/JPY on the 4-hour timeframe, based on a rejection from a key support zone and signs of trend continuation toward a higher target.
---
Technical Breakdown:
1. Support Level:
Price has bounced from a clearly defined support zone around 146.00 – 146.50, which has held multiple times in the past.
This zone is acting as a strong demand area where buyers are stepping in.
2. Bullish Rejection + Structure:
A bullish candle has formed from the support area, signaling potential reversal.
The drawn projection suggests higher highs and higher lows forming — indicating bullish continuation.
3. EMA (200):
Price has respected the 200 EMA (blue line), bouncing off it — a strong confluence for bullish trend continuation.
EMA is slightly upward sloping, indicating a longer-term bullish bias remains intact.
4. RSI (14):
RSI is rising from oversold territory (42.09), indicating a bullish momentum shift.
A potential bullish divergence might be forming (price made lower low, RSI made higher low).
5. Target Point:
Price is projected to reach 150.904, giving a potential move of ~2.91% (426 pips) from current levels.
---
Trade Idea Summary:
Bias: Bullish
Entry Zone: 146.90 – 147.30 (current levels or slight pullback)
Stop Loss: Below the support zone (~145.90)
Take Profit (TP): 150.900 (key resistance / previous high)
Risk-to-Reward Ratio: Attractive, based on the size of the support zone vs. projected move
Mr SMC Trading point
---
Key Insights:
Strong confluence between price structure, support zone, and 200 EMA bounce.
Favorable risk-reward ratio for swing or intraday traders.
Best confirmation would come from a bullish engulfing candle or break above minor resistance near 147.80.
Please support boost 🚀 this analysis)

USDJPY Strong Breakout!
HI,Traders !
#USDJPY made a bearish
Breakout of the rising support
Line and the breakout is
Confirmed so we will be
Expecting a further bearish
Move down !
Comment and subscribe to help us grow !

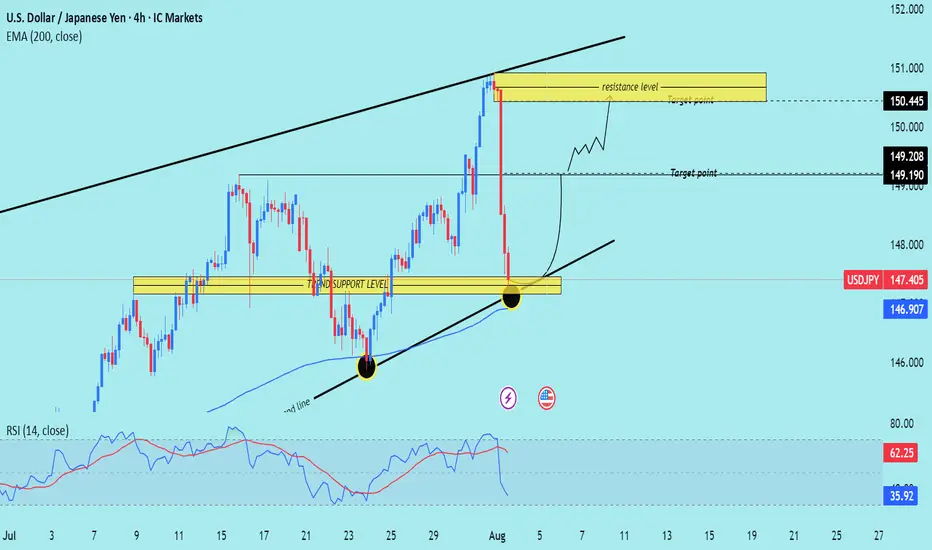
USD/JPY) Bullish trend analysis Read The captionSMC Trading point update
Technical analysis of USD/JPY on the 4-hour timeframe, using a combination of trendline support, key horizontal levels, and EMA 200 confluence to identify a potential bounce.
---
Technical Breakdown:
1. Market Structure:
USD/JPY experienced a sharp decline from the resistance zone near 150.445, but price is now testing a strong confluence support area:
Horizontal support zone
Rising trendline
200 EMA (146.907)
2. Support Confluence Zone:
Marked as "trend support level", this zone has historically acted as a springboard for bullish moves.
Recent price action shows a wick rejection at this zone, indicating buying pressure.
3. Resistance/Target Zones:
Target 1: 149.190 – 149.208
Target 2: 150.445 (major resistance zone)
4. EMA 200:
Price is reacting just above the 200 EMA, strengthening the bullish case for a bounce.
5. RSI (14):
RSI has dipped to 35.92, near oversold territory, suggesting the downside may be exhausted.
Prior bounce from similar RSI levels led to strong upward moves.
6. Projected Path:
The chart outlines a potential bullish recovery, targeting a climb back into the upper channel and retesting previous highs.
Mr SMC Trading point
---
Trade Idea Summary:
Bias: Bullish (Reversal from trendline + support zone)
Entry Zone: Current level near 147.40–146.90 (support confluence)
Targets:
TP1: 149.190
TP2: 150.445
Invalidation: Daily close below trendline and 200 EMA (~146.70 or lower)
Indicators: RSI supports a bounce; EMA and trendline confirm structure
Please support boost 🚀 this analysis)
USDJPY I Technical and Fundamental Analysis Welcome back! Let me know your thoughts in the comments!
** USDJPY Analysis - Listen to video!
We recommend that you keep this on your watchlist and enter when the entry criteria of your strategy is met.
Please support this idea with a LIKE and COMMENT if you find it useful and Click "Follow" on our profile if you'd like these trade ideas delivered straight to your email in the future.
Thanks for your continued support!

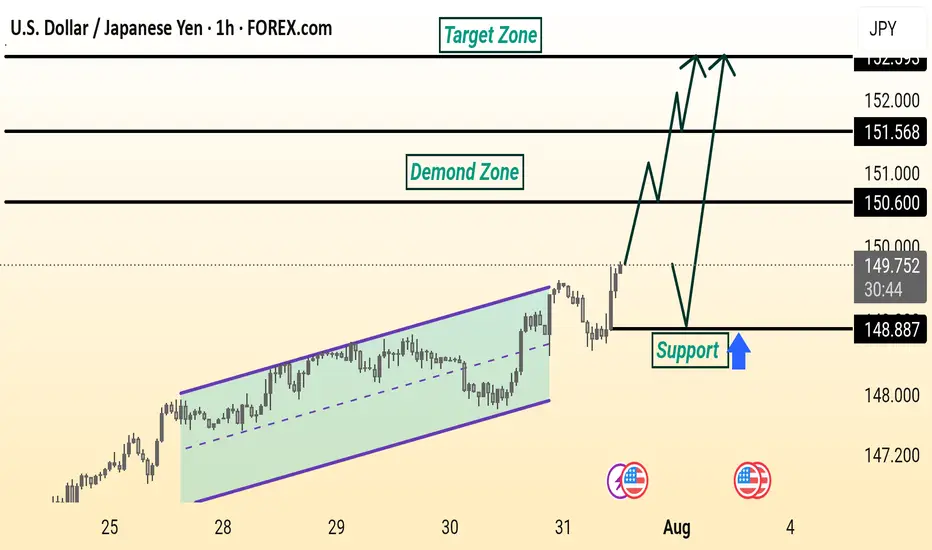
USD/JPY Analysis is Ready USD/JPY is showing a bullish setup. Price broke out of a rising channel and is expected to retest the 148.887 support level before moving higher toward the 150.600 and 151.568 resistance zones, targeting the 152.000 area. The demand zone adds strength to the potential upside.
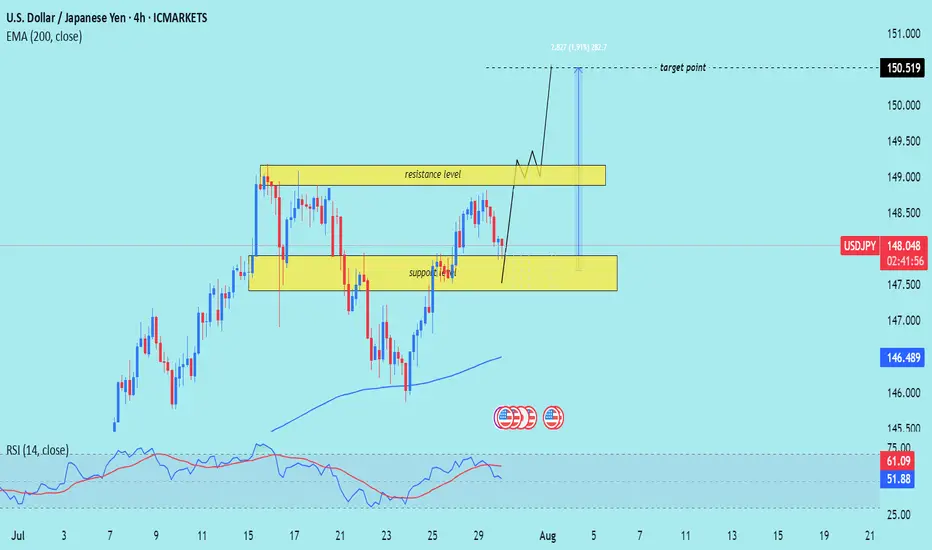
USD/JPY) Bullish Trend Read The captionSMC Trading point update
Technical analysis of USD/JPY on the 4-hour timeframe, with a focus on a support-resistance structure and trend
---
Technical Breakdown:
1. Market Structure:
Price is moving in a clear uptrend, making higher highs and higher lows.
A recent pullback into a support zone suggests potential for a bullish continuation.
2. Key Zones:
Support Zone: Around 147.00–147.50, highlighted in yellow — the area where price recently bounced.
Resistance Zone: Around 148.800–149.300, which price is expected to break through.
Target Point: Clearly marked at 150.519, aligning with the prior high and a projected bullish extension.
3. EMA (200):
The 200 EMA (blue) is at 146.489, far below current price — signaling strong bullish momentum.
4. RSI (14):
RSI is at 61.14, showing bullish momentum without being overbought — supportive of further upside.
No divergence is noted, which supports trend continuation.
5. Projection (Drawn Path):
The chart suggests price may bounce from support, break through resistance, and rally toward 150.519, possibly after a retest of the resistance-turned-support.
Mr SMC Trading point
---
Trade Idea Summary:
Bias: Bullish
Entry Zone: Near 147.00–147.50 (support)
Confirmation: Bullish candlestick pattern or strong bounce
Target: 150.519
Invalidation: Break and close below 146.489 (200 EMA) or sustained move below support zone
---
Please support boost 🚀 this analysis)
#USDJPY: Swing Buy Almost +2000 Pips! Dear Traders,
The USDJPY currency pair appears to be in an accumulation phase at the moment, as evidenced by the lack of significant price movement throughout the current week. Several factors contribute to this trend.
Firstly, several significant economic events are scheduled for this week, particularly tomorrow and Friday. These developments will have substantial implications for the future trajectory of the USDJPY pair. Consequently, there’s a possibility that the price may experience a decline before initiating a bullish trend. We’ve recently seen a strong bullish candle, which suggests a strong bullish move in the coming weeks. Additionally, the strong USD could continue rising, while the JPY is dropping.
Secondly, there are two primary areas where the price could reverse its course. The extent to which the USD reacts to the economic data will indicate potential reversal zones.
It’s crucial to conduct your own analysis before making any financial decisions. This chart should be used solely for educational purposes and does not guarantee any specific outcome.
Regarding the stop loss, as this is a swing trade, it’s advisable to employ a larger stop loss if the price reaches entry zones. The take profit level can be determined based on your entry type and analysis.
We wish you the best of luck in your trading endeavours and emphasise the importance of trading safely.
Please share this analysis with others through likes, comments, and social media platforms. If you have any questions or require further assistance, don’t hesitate to comment below. We’re here to provide support.
Team Setupsfx_
❤️🚀

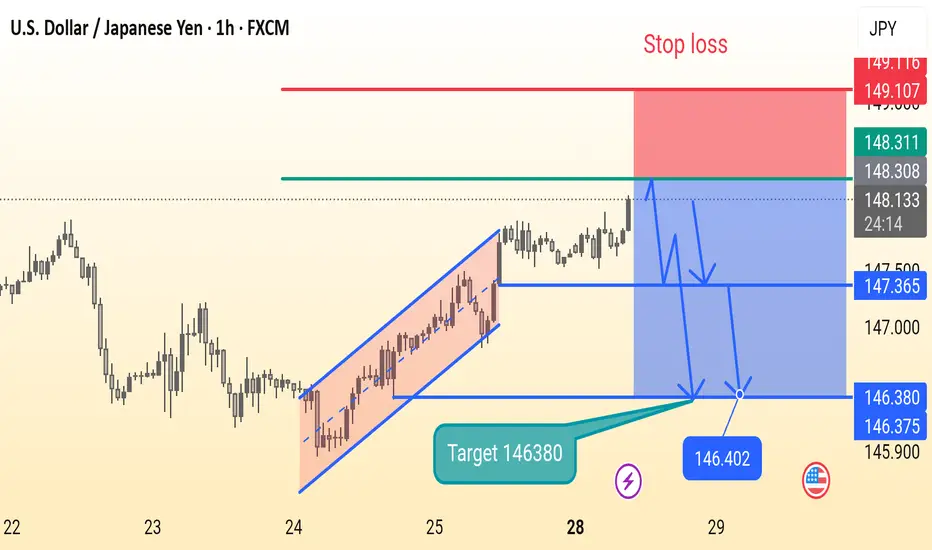
Usdjpy setupThis is a 1-hour USD/JPY chart showing a potential short (sell) trade setup. After a rising channel breakout, the price is consolidating. The chart suggests a bearish move with a target at 146.380 and a stop loss at 149.107. Key support levels are marked at 147.365 and 146.380.
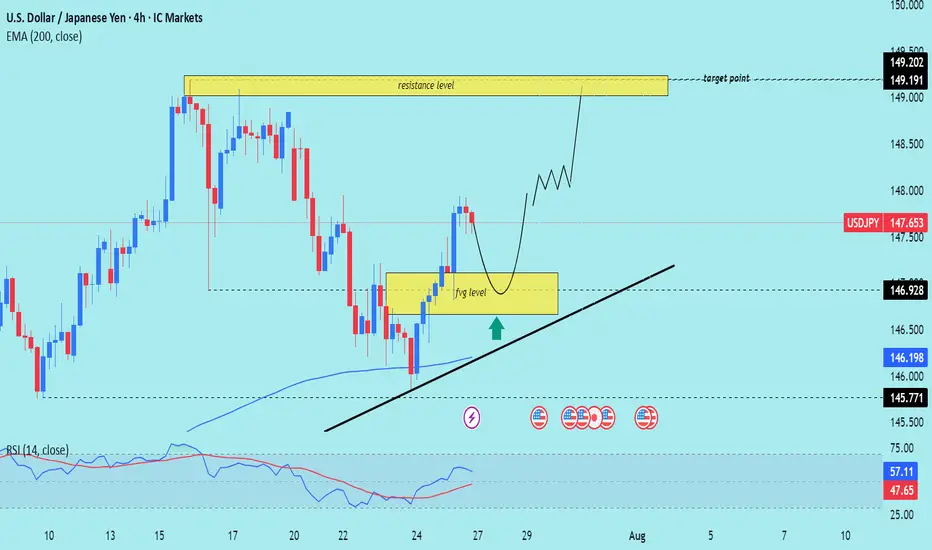
USD/JPY) Bullish Analysis Read The captionSMC Trading point update
Technical analysis of USD/JPY on the 4-hour timeframe, signaling a potential rally toward the 149.191–149.202 resistance zone. Here's the full breakdown
---
Technical Analysis – USD/JPY (4H)
1. Fair Value Gap (FVG) Support
Price recently filled a Fair Value Gap (FVG) level (yellow box) and is now pulling back toward it.
The FVG zone is expected to act as a support and potential entry point for buyers (marked by the green upward arrow).
2. Uptrend Structure
Price is moving within an ascending trendline, suggesting bullish market structure.
The current retracement is seen as a higher low setup, aligning with bullish continuation logic.
3. 200 EMA as Support
The 200 EMA at 146.198 is providing dynamic support.
Confluence between the EMA, FVG, and ascending trendline strengthens the bullish bias.
4. Resistance Target Zone
The projected target zone is between 149.191–149.202, which aligns with a previous high and key resistance level.
This zone is highlighted as the final take-profit area.
5. RSI Momentum
RSI is at 57.11, showing positive momentum but not yet overbought — which supports further upside.
RSI remains above 50, maintaining bullish momentum.
Mr SMC Trading point
---
Summary
Bias: Bullish
Current Price: 147.653
Support Zone (FVG): 146.20–146.92 (approx)
Trendline Support: Uptrend line intact
200 EMA: Acting as dynamic support (146.198)
Resistance Target: 149.191–149.202
RSI: 57.11 – healthy bullish momentum
plesse support boost 🚀 this analysis)
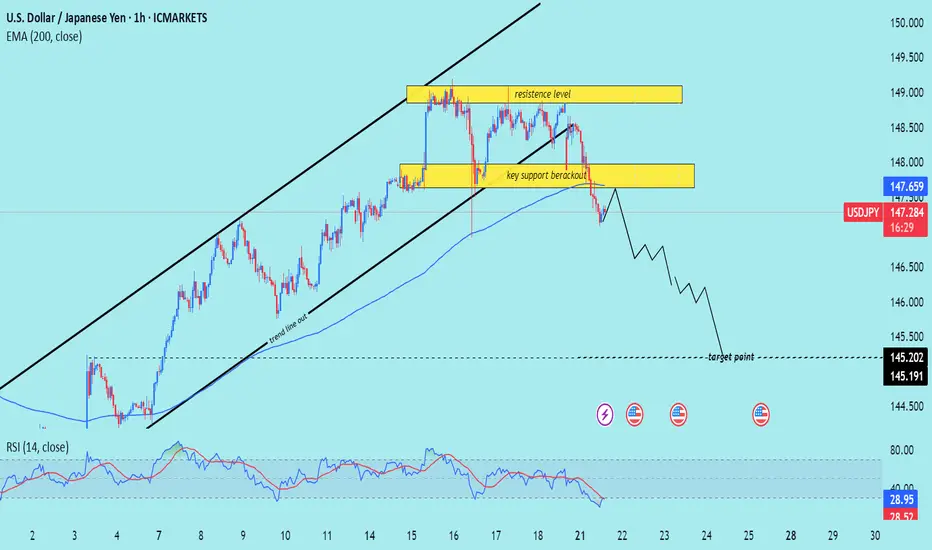
USD/JPY) bearish Trend Read The captionSMC Trading point update
Technical analysis of USD/JPY on the 1-hour timeframe, signaling a potential drop toward the 145.200 – 145.191 target zone. Here's the detailed breakdown:
---
Technical Analysis – USD/JPY (1H)
1. Rising Channel Breakdown
Price has broken below an ascending channel, confirming a trend line breakout and signaling a trend shift from bullish to bearish.
The trend line cut and rejection from the upper resistance zone support the bearish reversal.
2. Key Support Breakout
A crucial horizontal support zone around 147.80–148.00 was broken.
The break-and-retest of this area (yellow box) acts as a confirmation of bearish momentum continuation.
3. Bearish Momentum Below EMA
Price is trading below the 200 EMA (147.659) — a strong signal of downward bias on this timeframe.
The EMA has flipped from dynamic support to resistance.
4. RSI Oversold but Bearish
RSI is at 29.41, in oversold territory, which may hint at a short-term bounce.
However, the broader structure suggests more downside potential before a deeper retracement.
5. Target Projection
Projected target zone is between 145.200–145.191, aligning with previous structure lows and likely liquidity zone.
Mr SMC Trading point
Summary
Bias: Bearish
Current Price: 147.307
Key Resistance: 147.80–148.60 zone
Structure: Rising channel break + key support breakout
200 EMA: Above price (bearish signal)
RSI: 29.41 – oversold but momentum remains bearish
Target: 145.200–145.191
Please support boost 🚀 this analysis)