USD/JPY TRADE SETUP CHECK NOW📉 USDJPY TRADE SETUP – CHECK NOW
🔑 Potential Entry Zone: 147.141 – 146.980
❌ Stop Loss (Invalidation Level): 14.789
🎯 Target Levels:
✔️ TP1 – 147.636
✔️ TP2 – 147.906
✔️ TP3 – 148.141
💡 This is my personal market outlook based on chart structure & price action. Always apply proper risk management.
⚠️ Disclaimer: This is not financial advice. Content is shared for educational and informational purposes only.
Usdjpylong

Sell Trade Setup In USD?JPY🔻 Sell Entry: 147.36 – 147.50 zone
🎯 Take Profit (TP): 146.31 zone
⛔ Stop Loss (SL): 147.82
📝 Description (2 lines):
USD/JPY rejected from the 147.80 resistance zone and broke downwards.
Price is targeting 146.30 support as long as it stays below 147.50.

USDJPY Forming Ascending ChannelUSDJPY is currently trading around 147.28, moving within a clear ascending channel structure on the daily chart. Price is testing the lower trendline support near 146.40, making this a critical zone for buyers to defend. If the pair holds above this level, we could see momentum building back toward the 149.40–150.00 resistance area, while a breakdown would expose downside levels near 139.80.
On the fundamental side, the Japanese Yen remains under pressure as the Bank of Japan maintains its ultra-loose monetary stance, despite inflation running higher than historical averages. In contrast, the US Dollar is being driven by shifting expectations on Federal Reserve policy, with recent economic data suggesting that rate cuts may be delayed as inflation cools gradually but remains sticky. This divergence keeps USDJPY well supported in the medium term.
Traders are closely watching upcoming US CPI and labor market data, which will provide further clarity on Fed policy direction. A strong recovery from the ascending channel support could confirm bullish continuation, while a decisive break below could trigger a sharp corrective move.
Risk management is key at this stage, as volatility remains elevated with potential central bank interventions from Japan if the Yen weakens too aggressively. Holding above the channel base keeps the structure bullish, but losing it shifts bias to a deeper retracement.

147.20 Holds Strong — Next Stop 150.00 on USD/JPY?🔎 Technical Outlook (USD/JPY – 4H)
The pair is currently trading around 147.78, consolidating within a broad range. The key observation is repeated rejections near 147.20 support, suggesting buyers are defending this zone. On the upside, 149.00–149.20 remains a strong resistance ceiling.
Momentum indicators (based on price action structure in your chart) show buyers stepping back in after a retracement. The bullish setup comes from the fact that price is rebounding off support, forming higher lows, and still holding above the mid-range of the consolidation channel.
________________________________________
📈 Bullish Trade Setup (USD/JPY – 4H)
• ✅ Entry Zone (Buy): 147.60 – 147.80 (current area, confirmation above 147.90 ideal)
• 🛑 Stop Loss: 147.20 (below recent swing low & defended support)
• 🎯 Take Profit 1: 148.70 – lock partial gains (book ~50%)
• 🎯 Take Profit 2: 149.20 – key resistance test, move stop to breakeven
• 🎯 Take Profit 3: 150.00 – extended bullish breakout potential, trail stop to 148.70
________________________________________
📊 Risk Handling & Trade Management
1. Risk no more than 1–2% per trade — USD/JPY can be volatile.
2. Partial Profit Booking: Secure profits at TP1 to reduce exposure while riding further upside.
3. Trailing Stop: After TP1, shift SL to entry. If TP2 is hit, trail stop tighter under 148.50 to lock profits while leaving room for 150.
4. Be mindful of U.S. economic releases this week (highlighted at bottom of chart), which can cause sharp spikes in JPY pairs.
________________________________________
⚖️ Summary
USD/JPY is showing strength from support, and as long as 147.20 holds, the bullish structure remains valid. A clean break above 149.20 could trigger momentum buying toward 150.00, making this a favorable R:R setup with disciplined management.
________________________________________

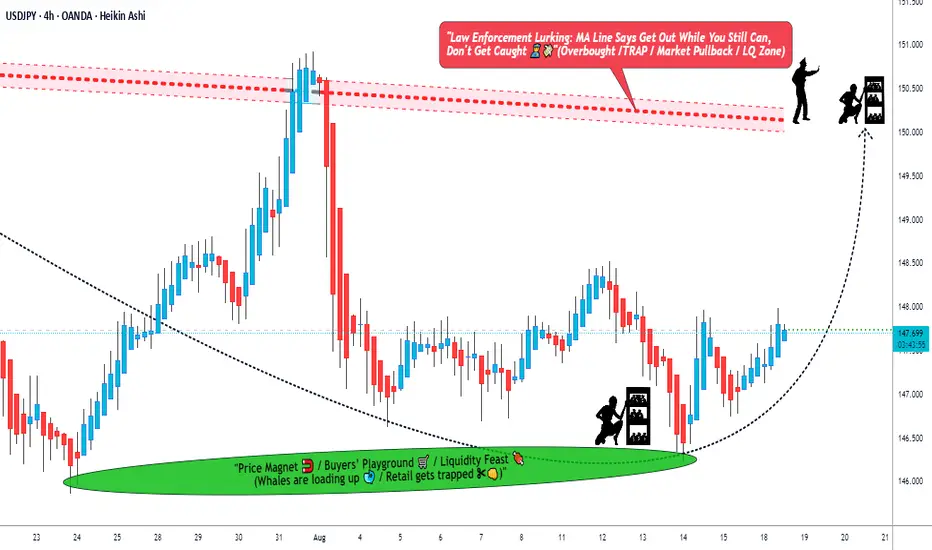
Can USDJPY Sustain Bullish Momentum or Face a Sharp Reversal?🚀 USD/JPY "The Ninja" Forex Bank Heist Plan 🏦🎯
Swing/Day Trade | Bullish MA Breakout | Layer Entry Strategy
📊 WHY THIS PLAN? THE THIEF'S LOGIC
Professional analysis combining technical, fundamental, and sentiment factors for high-probability execution.
📈 Technical Edge: Critical 4H close above 148.500 confirms moving average breakout momentum and a shift in market structure, signaling the next leg up.
🎯 Layered Entries (Thief Strategy): Using multiple limit orders at 148.500, 148.300, 148.000, 147.800, and 147.700 ensures a better average entry price and allows us to "steal" pips from the market efficiently. You can add more layers based on your own risk!
⚖️ Bullish Sentiment Alignment: Both retail (60% Bullish 🐂) and institutional (55% Bullish 🐂) sentiment show a slight bullish tilt, supporting our technical thesis.
😎 Neutral Market Mood: The Fear & Greed Index at 53/100 (Neutral) indicates a balanced market with no extreme emotions. This provides a stable foundation for a breakout play without FOMO driving the price.
🌍 Fundamental & Macro Backdrop: A Fundamental Score of 6.5/10 highlights moderate USD strength from US economic stability, countered by JPY support from BoJ policy rumors. The Macro Score of 6/10 reflects global uncertainties but also potential volatility we can capitalize on.
🗺️ TRADE PLAN: THE HEIST BLUEPRINT
Entry Conditions
✅ CONFIRMATION: 4H candle MUST CLOSE ABOVE 148.500 (Wait for the confirmation candle to avoid fakeouts!)
🔫 ENTRY: Use the Thief's layered limit order strategy:
Layer 1: 148.500
Layer 2: 148.300
Layer 3: 148.000
Layer 4: 147.800
Layer 5: 147.700
You can increase or adjust these limit layers based on your own strategy and capital.
Risk Management
⛔ STOP LOSS: This thief's SL is 146.700. Dear Ladies & Gentleman (Thief OG's) 👑, adjust your SL based on your own strategy & risk. I am not responsible for your results.
🎯 TARGET: Escape with the stolen money at 151.000. This target aligns with a key resistance and "tarap zone." Consider taking partial profits on the way up.
⚖️ Note: This is your heist. You can take money at your own risk and discretion.
📌 MARKET SNAPSHOT & KEY DRIVERS
💸 Current Price: 148.1540 (Up 0.55%)
📊 Overall Market Outlook: Neutral with a Slight Bullish Bias 🐂
✨ Key Takeaway: USD/JPY is stable but range-bound. Watch for a break above 148.8–149.0 for a confirmed upside breakout, or a break below 146.65 for a failure.
Related Pairs & Assets to Watch
$EUR/PY - High correlation to USDJPY moves.
OANDA:GBPJPY - Another liquid Yen cross to gauge risk sentiment.
TVC:DXY - US Dollar Index strength directly impacts this pair.
TVC:US10Y - Watch US Treasury yields for USD momentum clues.
✨ “If you find value in my analysis, a 👍 and 🚀 boost is much appreciated — it helps me share more setups with the community!”
⚠️ DISCLAIMER
This idea is for educational and informational purposes only. It does not constitute financial advice. You are solely responsible for your own trading decisions and capital. Trading forex carries a high level of risk and may not be suitable for all investors.
#Forex #USDJPY #TradingPlan #TechnicalAnalysis #BankHeist #SwingTrading #DayTrading #ForexSignals #TradingView

USDJPY LONGUSDJPY still on a Monthly correction.Once we complete this 4H pulback we should continue bullish to around 154.

USDJPY Holds 147 – Is a Bullish Breakout Imminent?The USDJPY pair has been consolidating in a well-defined range between 146.60 and 148.20. This range has acted as the battleground between buyers and sellers, but the repeated rejections from the lower boundary highlight strong accumulation by buyers. The zone between 146.60 and 146.85 has been tested multiple times, and each test has produced a rebound, confirming it as a key demand area where institutional buyers are stepping in.
On the upper side, resistance has remained firm at 148.10–148.20, where several intraday reversals occurred. However, despite repeated rejections, the structure is gradually shifting in favor of the bulls. The series of higher lows seen after the recent dip toward 146.60 shows that buyers are gaining strength and absorbing selling pressure. This is a classic sign of an impending breakout, especially when the market refuses to break the downside after several attempts.
The hourly trend structure is now tilted in favor of a bullish continuation. Price is trading near the mid-zone of the range, with buyers defending 147.00–147.20 strongly. Momentum indicators (based on the candle structure and range holds) point toward the likelihood of a retest of the upper boundary. A clean break above 148.20 would unlock the next upside leg toward 148.75, and if momentum continues, even toward 149.50 in the medium term.
From a risk/reward perspective, the trade setup in the chart is favorable. By keeping the stop below 146.67, risk remains tightly managed while the upside potential is nearly double. This aligns with the bullish market context and provides a strong edge for long positioning.
Trade Setup (Bullish)
• Entry Zone: 147.15 – 147.20
• Stop Loss: 146.67
• Take Profit 1: 148.12
• Take Profit 2: 148.75
As long as the pair holds above 146.60, the bullish case remains intact. A breakdown of this zone would invalidate the setup and open the path toward 146.00 or even 145.50, but for now, the market structure favors continuation higher.
USDJPY is building pressure inside a consolidation range, with strong demand at the bottom and weakening resistance at the top. The technical picture suggests that buyers have the upper hand, and a breakout above 148.20 could be the trigger for the next bullish wave.

USDJPY Daily Forecast -Q3 | W36 | D5 | Y25📅 Q3 | W36 | D5 | Y25
📊 USDJPY Daily Forecast
🔍 Analysis Approach:
I’m applying Smart Money Concepts, focusing on:
Identifying Points of Interest on the Higher Time Frames (HTFs) 🕰️
Using those POIs to define a clear trading range 📐
Refining those zones on Lower Time Frames (LTFs) 🔎
Waiting for a Break of Structure (BoS) for confirmation ✅
This method allows me to stay precise, disciplined, and aligned with the market narrative, rather than chasing price.
💡 My Motto:
"Capital management, discipline, and consistency in your trading edge."
A positive risk-to-reward ratio, paired with a high win rate, is the backbone of any solid trading plan 📈🔐
⚠️ Losses?
They’re part of the mathematical game of trading 🎲
They don’t define you — they’re necessary, they happen, and we move forward 📊➡️
🙏 I appreciate you taking the time to review my Daily Forecast.
Stay sharp, stay consistent, and protect your capital
— FRNGT 🚀
FX:USDJPY

USDJPY Daily Forecast -Q3 | W36 | D4 | Y25📅 Q3 | W36 | D4 | Y25
📊 USDJPY Daily Forecast
🔍 Analysis Approach:
I’m applying Smart Money Concepts, focusing on:
Identifying Points of Interest on the Higher Time Frames (HTFs) 🕰️
Using those POIs to define a clear trading range 📐
Refining those zones on Lower Time Frames (LTFs) 🔎
Waiting for a Break of Structure (BoS) for confirmation ✅
This method allows me to stay precise, disciplined, and aligned with the market narrative, rather than chasing price.
💡 My Motto:
"Capital management, discipline, and consistency in your trading edge."
A positive risk-to-reward ratio, paired with a high win rate, is the backbone of any solid trading plan 📈🔐
⚠️ Losses?
They’re part of the mathematical game of trading 🎲
They don’t define you — they’re necessary, they happen, and we move forward 📊➡️
🙏 I appreciate you taking the time to review my Daily Forecast.
Stay sharp, stay consistent, and protect your capital
— FRNGT 🚀
FX:USDJPY

USDJPY possible long for 150.50#usdjpy price remain stuck withing descending wedge channel for one & half month. Ultimately price broke channel to the up side. 147.30-146.75 area of interest for long. stop loss below 146.60. target: 150.50

USDJPY Daily Forecast -Q3 | W36 | D3 | Y25📅 Q3 | W36 | D3 | Y25
📊 USDJPY Daily Forecast
🔍 Analysis Approach:
I’m applying Smart Money Concepts, focusing on:
Identifying Points of Interest on the Higher Time Frames (HTFs) 🕰️
Using those POIs to define a clear trading range 📐
Refining those zones on Lower Time Frames (LTFs) 🔎
Waiting for a Break of Structure (BoS) for confirmation ✅
This method allows me to stay precise, disciplined, and aligned with the market narrative, rather than chasing price.
💡 My Motto:
"Capital management, discipline, and consistency in your trading edge."
A positive risk-to-reward ratio, paired with a high win rate, is the backbone of any solid trading plan 📈🔐
⚠️ Losses?
They’re part of the mathematical game of trading 🎲
They don’t define you — they’re necessary, they happen, and we move forward 📊➡️
🙏 I appreciate you taking the time to review my Daily Forecast.
Stay sharp, stay consistent, and protect your capital
— FRNGT 🚀
FX:USDJPY

GBPUSD shorts due to better than expect US Eco dataFor the week ending August 23, 2025, U.S. initial jobless claims were 229,000, below the forecast of 231,000 and down from the previous week's revised figure of 234,000. This suggests a slight improvement in new unemployment filings.
Real gross domestic product (GDP) increased at an annual rate of 3.3 percent (0.8 percent at a quarterly rate) in the second quarter of 2025 (April, May, and June), according to the second estimate released by the U.S. Bureau of Economic Analysis.
Due to the above data being better than expected, we can expect the dollar to increase in strength over the short term.

USDJPY Long Bias Forecast Q3 W35 D28 Y25 – NY Session 🗓️ USDJPY Long Bias Forecast
Q3 W35 D28 Y25 – NY Session
Top-Down Technical Outlook
🔹 Weekly Timeframe
Price Action: Strong rejection from the Weekly 50 EMA, acting as dynamic support.
Note: With two trading days left in the week, the previous weekly wick remains a key area — it may still fill, suggesting further upside potential.
Implication: Structure suggests continuation to the upside, but current price must confirm with internal shifts before entry.
🔹 Daily Timeframe
Current Price: Hovering around the Daily 50 EMA – a key equilibrium level.
Expectation: Potential bullish reaction if buyers defend this zone.
Risk Consideration: Aggressive long entries must be approached cautiously without a confirmed change in internal structure (CHOIS).
🔹 4H Timeframe
Confluence:
Bullish wick closure on the last candle suggests rejection from lower prices.
Order Block (OB) identified near Daily 50 EMA – an ideal POI.
Narrative: Structure is preparing for a potential shift. Look for breaks of internal structure (BOS) to confirm bullish intent.
🔹 1H Timeframe
Candlestick Confirmation: Last 3 consecutive bullish candles forming a classic bullish continuation pattern.
Order Block in alignment with 4H and Daily 50 EMA adds weight to the area.
Bias: Bullish – pending confirmation via BOS and clean pullbacks.
🔹 5-Minute Timeframe
Microstructure:
Refined entry points within OB zone.
Ideal for tight stop entries post BOS and retest of lower-timeframe OB.
Watch For:
Shift from bearish to bullish market structure.
Entry following a break + retest of a demand zone or OB.
✅ Confluences for Longs
Rejection from Weekly 50 EMA.
Price respecting Daily 50 EMA.
4H OB + Bullish candle closure.
1H Bullish formation + OB.
5M potential BOS/CHOIS for refined entry.
⚠️ Cautions / Trade Management
Wait for internal structure shift on lower timeframes before full commitment.
Liquidity sweeps below current price are still possible before upside continuation.
Maintain awareness of macroeconomic catalysts (e.g., U.S. or Japan economic data or central bank commentary).
FRGNT
FX:USDJPY

USDJPY – DAILY FORECAST Q3 | W35 | D28 | Y25📊 USDJPY – DAILY FORECAST
Q3 | W35 | D28 | Y25
🔍 Daily Forecast | USDJPY
Here’s a concise breakdown of the current chart setup 🧠📈:
📌 Higher time frame order blocks have been identified — these are our patient points of interest 🎯🧭.
We wait for a confirmed break of structure 🧱✅ before executing any position.
This keeps us disciplined, and in sync with what the price action is actually telling us — not what we want it to say.
📈 Risk Management Protocols
🔑 Core Principles:
Max 1% risk per trade
Execute only at pre-identified levels
Use alerts, not emotion
Stick to your RR plan (minimum 1:2)
🧠 You’re not paid for how many trades you take — you're paid for how well you manage risk.
"Trade what the market gives, not what your ego wants."
Stay mechanical. Stay focused. Let the probabilities work for you. 🎯📊
FRGNT
FX:USDJPY

USDJPY — Q3 W35 Mid-Week Forecast Top-Down Analysis | USDJPY — Q3 W35 Mid-Week Forecast - Top-Down Analysis |
mid-week forecast for USDJPY — let’s break it down top to bottom:
🕰️ Weekly Outlook:
No clear structure or trend bias from the weekly candle 🕯️
However, price closed below the Weekly 50 EMA 📉, leaving a bearish upper wick
This signals a possible continuation to the downside this week
But — as always — wicks tend to get filled first on lower timeframes before short setups play out
📌 Key Reminder:
"Sell from the highs, buy from the lows." 🔁
📆 Daily Structure:
Daily candles have been pushing into lower-timeframe POIs
This aligns with potential sell zones, building confluence
If candles continue to push up, we're watching closely for rejection from the Weekly 50 EMA
⚠️ Don’t be thrown off by a bullish weekly candle midweek — we're anticipating a rejection wick and bearish close.
Let structure confirm.
⏱️ Lower Time Frame Confluence:
🔻 Primary Short Bias (High Confidence Zone):
🔸 4H POI containing:
A clean Order Block (OB)
A void (imbalance)
🔹 Within that, a 1H OB + void adds strong confluence 🔐
Once price enters the zone:
⬇️ Scale to 5-min
Wait for Break of Structure (BoS)
Execute the short ✅
🔺 Optional Long Setup (If Structure Shifts):
While short bias is primary, longs are not off the table
A separate POI based on 4H / 1H / 15' exists for a possible long
If price hits this zone:
Wait for LTF BoS (1' or 5')
Consider long entries, only if confluence stacks
🧠 Key Takeaways:
Weekly close below 50 EMA = bearish tilt, but lower timeframe confirmation needed
Let the wicks fill before forcing shorts
Only take longs with strong confluence
As always — one trade at a time, risk managed, confluence stacked
Trade safe, stay disciplined.
FRGNT
FX:USDJPY

USDJPY: Buy Position to 149Hello friends, USDJPY can be traded in this way. A good long move can be taken and enjoyed. Be successful and profitable. It is added that the analysis is based on fractals and Elliott waves.

USDJPY has done false breakdown?USDJPY trade setup for today :
Before we look at potential entry in this pair first let’s look at multiple timeframe analysis in this market.
Monthly: 150.79 Monthly resistance price has got rejection strongly from the top
Weekly: After multiple doji formation, price is about to bounce off the support level potentially move back to the upside.
Daily: With a massive rejection on Friday, USDJPY started to fill the imbalance and price may continue to move back to the upside.
Entry timeframe 4H : Upon rejection from any previous candles support, price may continue to bounce.
Possible trade recommendation : Bullish entry with SL above sessions high

USD not coming slowBull points
Bullish on higher timeframe
Rsi div on 1h
wait for trend reversal
RRR go for 1:2

USD/JPY) Bullish Trend Read The captionSMC Trading point update
Technical analysis of USD/JPY (2H) analysis you shared:
---
Technical Breakdown
1. Price Action & Zone
Price retraced into a Fair Value Gap (FVG) / demand zone (yellow box) around 147.00 – 147.40.
Strong buying interest is visible from this zone.
2. Falling Wedge Pattern
A falling wedge has formed, which is typically a bullish reversal pattern.
Price is attempting to break out above wedge resistance, showing potential for upside momentum.
3. EMA (200 Close)
Price is interacting with the 200 EMA (147.58), serving as dynamic resistance.
A sustained breakout above this EMA would confirm bullish continuation.
4. RSI (14)
RSI currently around 46–50, suggesting neutral momentum with room for upside.
---
Trade Idea
Bias: Bullish
Entry Zone: On breakout & retest of wedge / demand zone.
Target: 148.680 (as marked).
Invalidation: Below 146.60 (clear break under demand/FVG zone).
Mr SMC Trading point
---
This setup suggests a bullish reversal from support, with a likely push toward 148.68 after wedge breakout.
please support boost 🚀 this analysis)

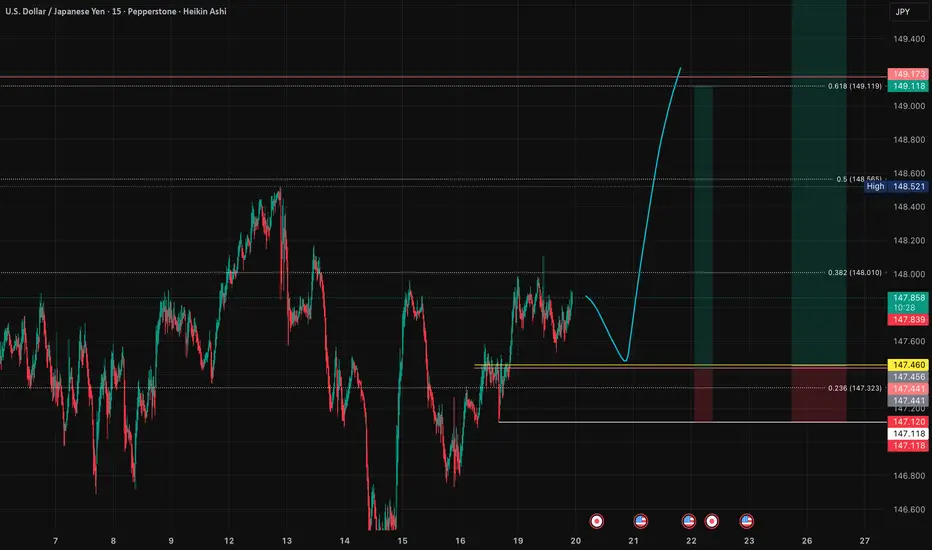
USDJPY: Simple Role Reversal Play - Fibonacci RetracementSharing my straightforward read on USDJPY for the immediate term. 🎯
**📍 The Setup:**
I'm expecting a role reversal move back toward the recent range highs. After that initial bounce, I'm looking for a stronger upward move targeting approximately the 0.618 Fibonacci retracement level of the larger range structure. 📊
**⏰ Timing Expectations:**
If this scenario plays out, it should happen within the next day or two. Currency moves often have tight timing windows, and this setup has that "ready to go" feel to it. ⚡
**🎯 Why This Makes Sense:**
Role reversals at key levels are bread-and-butter setups. Former resistance becomes support, and the market often tests these flipped levels before continuing the broader move. Simple market mechanics. 🔄
**🧠 Keep It Simple:**
Sometimes the best trades are the most obvious ones. No complex analysis needed here - just clean technical levels and patient execution. 📈
📈 **This trade setup offers a risk-to-reward ratio of 5:1.** Without including fees, the breakeven win rate for this trade would be approximately 16.67%. Knowing these figures in advance helps me avoid emotional trading. 🧠
💡 **Pro Tip**: If you often find yourself trading based on emotions, I recommend doing this type of pre-planning and quantifying your setups before execution — it can be a simple yet highly effective improvement. ✅
---
**Trading is simple.** You don't need multiple indicators or dozens of lines on your chart. A clean and simple chart often works best — it keeps your decisions consistent and reduces uncertainty. Sure, it might not look flashy, and my analysis may seem a bit "plain" compared to others… but that's how I like it. If you find this analysis useful, feel free to follow me for more updates.
---
*Disclaimer: This post is for general informational and educational purposes only. It does not constitute financial advice, investment recommendation, or a service targeting specific investors, and should not be considered illegal or restricted information in any jurisdiction.*
Everything’s Aligned: USDJPY Buy Setup Locked and LoadedHey friends 👋
I’ve prepared a fresh USDJPY analysis for you.
I’m planning to open a buy position around 146.631 or 146.451, targeting the 147.700 level.
Also, today’s upcoming U.S. economic data will play a key role from a fundamental analysis perspective.
Every single like you send is my biggest source of motivation to keep sharing these insights. Huge thanks to everyone supporting me 🙏

"The USDJPY Ninja Trade – Silent Entry, Big Exit!"🚨💰 USD/JPY “The Ninja” Forex Bank Heist Plan (Swing Trade) 🐱👤💴💵
🎭 Dear Money Makers, Robbers & Thief OG’s,
It’s time to gear up for our biggest Ninja heist on the Forex streets!
We’re breaking into the USD/JPY vault with a Bullish Master Plan – grab your mask, load your limit orders, and let’s rob the market clean! 💰🔫
🗡️ Heist Entry (Layering Style) 📈
Thief doesn’t enter with one bullet – we spray the vault with multiple limit orders! 🎯
First layer: 147.600
Second layer: 147.400
Third layer: 147.200
👉 Add more layers if you want a deeper pullback entry – the more locks you pick, the bigger the loot! 🏦💎
🛑 Thief Stop Loss
This is Thief SL 🔒: 146.500
But remember, dear ladies & gentlemen (Thief OG’s) – adjust your SL based on your own strategy, capital & risk appetite. Stay slick, don’t get caught! 🚔💨
🎯 Target Escape Zone
Police barricade spotted 🚨👮 @ 150.700
Our heist exit point is locked at 150.000 🏃♂️💨
👉 Make sure you grab the loot & escape before the cops arrive. Take profit & celebrate with stolen sushi 🍣 & sake 🍶!
⚠️ Thief Trading Notes
News drops = extra police patrols 🚔 – avoid opening fresh entries during major releases.
Trail your stops to lock in profits – no thief leaves empty-handed!
Stay alert to price traps – don’t get stuck behind enemy lines.
💎 If this heist plan made you some loot, smash that 💖 & BOOST button to power up the Thief Gang 🚀🤝💰
The more boosts, the bigger our robbery squad becomes!
Stay tuned, Ninjas 🐱👤 … the next heist plan is already loading.
💵💎🚀 Thief Trader OUT.
USDJPY : LONG OPPORTUNITY, MOMENTUM BREWING NICELY FOR UPSIDERefer to trendline drawn on chart. USDJPY is heading to retest 151.
Long @ 147.60
TP 150.80
SL 146.05
