USDJPY: Oscillating, awaiting breakoutUSDJPY is generally in a narrow-range oscillatory downward trend today. Exchange rate fluctuations are influenced by the interplay of multiple factors, including expectations of Japanese government intervention and dovish signals from the Federal Reserve, with the technical side showing characteristics of bull-bear confrontation.
On the support front, short-term focus is on the intraday low around 156.00, with further strong support concentrated in the 156.50 range. If this zone is breached, the exchange rate may decline toward the key psychological level of 156.00. For resistance, initial attention falls on the intraday high of 156.98, while the subsequent core resistance remains the intervention risk level at 157.30. A breakout above this level could trigger a brief surge to around 157.50, but it is highly likely to prompt intervention by Japanese authorities, leading to a sharp pullback in the exchange rate.
Sell 157.00 - 157.30
SL 157.50
TP 156.50 - 156.20
Usdjpysell

USD/JPY) Bearish trend analysis Read The captionSMC Trading point update
Technical analysis of summary of the chart you shared (USD/JPY H1):
---
Overall Bias: Bearish
The chart suggests a bearish continuation setup after a sharp impulsive drop and current corrective structure.
---
Key Points in the Chart
Price currently trading below EMA 50 (blue) and EMA 200 (black)
→ Indicates shifting momentum to the downside.
Two Supply Zones / FVG Areas Highlighted
First zone around 156.80–157.00
Second zone around 156.40–156.60
Price recently mitigated the lower supply zone and rejected again, showing sellers active.
Market Structure
Lower highs & lower lows forming.
Bearish correction structure drawn (zigzag) pointing continuation lower.
Target Zone
The bearish target is marked around 154.900–155.000, a strong demand zone and liquidity pool.
Likely liquidity sweep below previous lows.
---
Trade Idea Concept
Possible Entry:
Look for short entries after bearish confirmation inside one of the supply zones if price retraces.
TP Target:
154.90 – 155.00 demand zone (major target)
Invalidation:
Break & close above 157.00 invalidates bearish bias.
Mr SMC Trading point
---
Smart Money Concept View
Trend transitioned after BOS
Fair Value Gap + Supply + EMAs as confluence
Targeting imbalance fill & liquidity
---
Summary
The chart shows a strong probability for continued downside, aiming to fill imbalance down to 155.00 region after a corrective pullback.
---
please support boost 🚀 this analysis

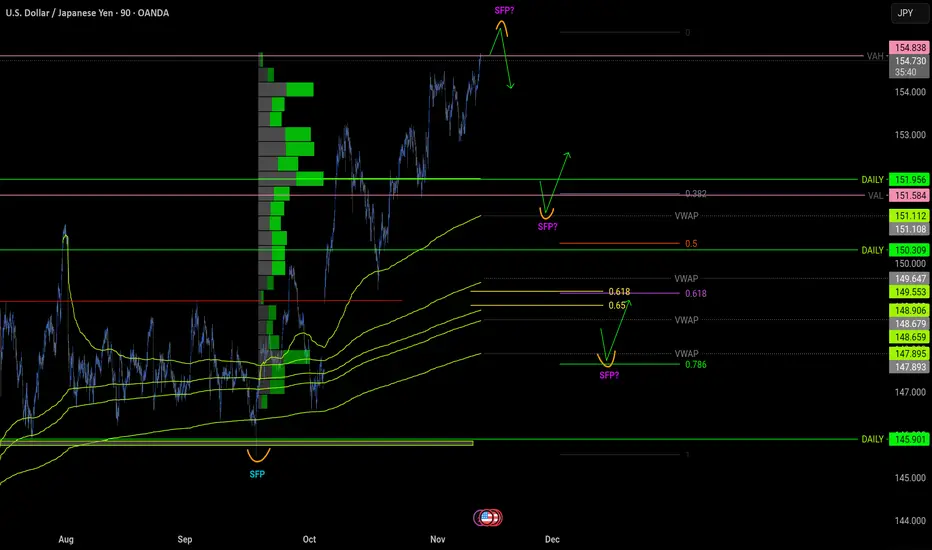
USDJPY idea 12.11.2025I'm primarily following two scenarios in this market: a short position would be possible when the SFP is above the value high. I would like the nearest long when the price drops somewhere around 151.2, where there is a nice confluence. The 0.382 fibo value low level and the daily level are converging. I would like another potential long only after the gap is filled.
USDJPY Edges Higher Above 155Today, USDJPY exhibited a oscillatory upward trend and broke through the key psychological level of 155, achieving a slight rise. However, constrained by the implicit risk of Japanese foreign exchange market intervention, there was no significant one-sided upward movement.
On the upside, core resistance is concentrated at the 155.6 level. After breaking through this position, the next strong resistance zone will be around 156.00, which will exert strong pressure on the exchange rate's upward movement.
Regarding downside support, the primary support lies in the 154.45-154.50 range. As a key range for the exchange rate's fluctuations in the early stage, this level possesses certain supporting strength. If this support is breached, the exchange rate may further decline to 153.50. Should this level also be broken, it may subsequently fall to the deeper support level of 152.10.

USD/JPY Analysis - SHORT USD/JPY recently swept key swing points, including the previous week’s high (PWH) and previous day’s high (PDH), capturing the buy-side liquidity of the previously established bullish range.
This was followed by a retest of a significant support zone, specifically the H4 SIBI.
I am anticipating a sweep of the sell-side liquidity resting at the 155.380 sell-stops before a more substantial downward move begins.
Should price break below the 0.5 equilibrium level of the current dealing range, I intend to hold the position until price reaches the sell-side liquidity of the previously established range at 154.416.

USD/JPY Steady UpsideUSDJPY broke through the resistance level of 154.5 last week and is currently in a clear high - range consolidation. In today's trading session:
First, on the 4 - hour chart, the stochastic indicator shows a golden cross with indicator stagnation,and the MACD lines are passivating downward. Overall, the indicators are in a state of indicator stagnation,and in terms of form, it is temporarily in a high - level sideways and anti - falling trend. The current high - level support levels are at 154 and 154.5.
Second, on the daily chart, both the stochastic indicator and the MACD indicator are indicator stagnation. The support levels after a pullback are around 153.6, followed by 153.
To sum up, the short - term support levels for USDJPY today are 154.5, 154, 153.6 and 153. In short - term trading, we should follow the principle of trending with the current trend.

USDJPY - Perfect time to buy!USDJPY Is in a clear uptrend and has been for a while! It is currently inside an upward channel and has recently broken the last major resistance zone which means it is extremely likely to keep heading to the upside for much longer (just a very minor resistance level which is causing slight delays for its bullish movements). The next target will be the fibonacci extension zone which is shown on the chart. USDJPY has struggled to break below support but has constantly been breaking through resistance levels. TIME TO BUY!

USD/JPY: Impulse Squall or Bearish Ambush – Where Will the Wave USD/JPY: Impulse Squall or Bearish Ambush – Where Will the Wave End?
📈 Weekly Scenarios
Bullish scenario: If USD/JPY holds support at ~142.50 and breaks above ~146.00, a rally to ~149–150 is possible.
Consolidation: The pair could move in the ~142.50–146.00 range, accumulating strength before the next move.
Bearish scenario: A break below ~142.50 with volume confirmation could lead to a pullback to ~140.00–141.00.
✅ Conclusion
USD/JPY is at an important weekly crossroads: either a surge in upward momentum or a significant correction.
Key levels to watch: 142.50 (support) and 146.00 (resistance).
The wave structure is not yet clear; it is important to monitor the price reaction at these levels and confirmation of the wave count.

USDJPY Still Awaits the Next CatalystThe Japanese Yen (JPY) struggled to attract buyers and languished near a nine-month low against the US Dollar (USD). Despite some downside risks (from Japanese intervention), the JPY remained weak due to dovish signals from the Japanese government.
--------------------------------------------------------------------------------
## JPY Weakening (Driving USD/JPY Up)
- PM Takaichi's Signal: Prime Minister Sanae Takaichi expressed the government's preference for keeping interest rates low and called for close coordination with the Bank of Japan (BoJ).
- Impact: These comments cooled market expectations for an upcoming BoJ interest rate hike, a key factor behind the JPY's underperformance.
## Limits to USD/JPY Upside
- BoJ Hike Expectations: Despite the weakening, traders still see a 24% chance of a BoJ rate hike in December and a 46% chance in January.
- Intervention Warning: The recent decline in the JPY prompted Japan's Finance Minister and Economy Minister to issue warnings about currency movements, fueling concerns about intervention.
- USD Weakens: The US dollar (USD) is languishing near a two-week low amid economic concerns (post-shutdown), which could help limit USD/JPY gains.
- Risk-off sentiment: A surge in risk-off sentiment could support the JPY as a safe-haven currency.
--------------------------------------------------------------------------------
## Bullish Scenario
- Upside Trigger: This week's breakout through the 154.45-154.50 horizontal resistance is seen as a key trigger.
- Next Target: Spot prices may rise to the 155.60-155.65 intermediate resistance and eventually aim to reclaim the 156.00 round number.
- Warning: Repeated failures above the psychological 155.00 level warrant caution before taking aggressive bullish positions.
## Bearish Scenario
- Buying Opportunity: Any further weakness should be viewed as a buying opportunity and is expected to find support near 154.00.
- Pivot Point: A convincing break below $154.00 could drag USD/JPY to the 153.60-153.50 region and the 153.00 round number. The 153.00 level should act as a key pivot point.
- Bias Reversal: A break below 153.00 could shift the bias to bearish and open the way to the 152.15-152.10 area.

USDJPY - Perfect time to buy!USDJPY Is in a clear uptrend and has been for a very long time! It is currently inside an upward channel and has recently broken the last major resistance zone which means it is extremely likely to keep heading to the upside for much longer. The next target will be the fibonacci extension zone which is shown on the chart. USDJPY has struggled to break below support but has constantly been breaking through resistance levels. TIME TO BUY!

USDJPY is ready to head to the upside - BUY NOW!For several weeks USDJPY has been stuck inside a strong upwards channel that it has not broken out of and keeps making more clear bullish signs. Recently the price touched the lower channel trend line (which acts as a support level) and bounced back up from it. Secondly, the price also broke above the white trendline which was acting as a strong resistance zone (the price then retraced back to the white trendline and treated it as a new support level) the next target has been drawn out on the chart - time to buy USDJPY!

USD/JPY) Bearish trend analysis Read The captionSMC Trading point update
Technical analysis of USD/JPY on the 4H timeframe, built on Smart Money Concepts (SMC) principles, Fibonacci retracement, and liquidity structure. Let’s break down the full trading idea and logic 👇
---
Overall Concept
The idea shows a retracement sell setup, where price is expected to pull back into a premium zone (Fibonacci 0.62–0.79) before resuming a bearish move toward the target zone near 150.928.
This aligns with a potential distribution phase after a strong bullish rally.
---
Technical Breakdown
1. Market Structure
The market broke below the recent higher low → signaling a shift in structure from bullish to bearish.
The move up into the blue zone is considered a pullback for liquidity grab or supply zone mitigation before continuation down.
2. Key Levels
Current Price: 153.428
50 EMA: 153.346 → price is currently retesting around this dynamic resistance.
200 EMA: 151.572 → next potential support area and confluence with the target zone.
Premium Zone (Fibonacci): 0.62–0.79 levels between 153.90–154.20 — expected sell area.
Target Zone: 150.928 – key demand zone and previous liquidity area.
3. Fibonacci Confluence
The retracement tool from swing high → swing low shows price is expected to retest the 0.62–0.79 levels, which is a smart money premium zone for short entries.
4. Expected Price Action
1. Short-term retracement up into the blue supply zone (0.62–0.79).
2. Bearish reaction and rejection candle formation (e.g., engulfing or long wick).
3. Continuation downward to take liquidity resting below 151.00 and fill imbalance into the 150.928 target area.
5. Volume & Confirmation
Moderate volume (24.5K) aligns with a retracement phase before a possible impulsive drop.
Watch for bearish divergence or rejection wicks in the premium zone for confirmation.
---
Trade Idea Summary
Aspect Detail
Bias Bearish
Entry Zone 153.90 – 154.20 (Fibonacci 0.62–0.79 / supply zone)
Stop Loss Above 154.40 (above structure high)
Take Profit 150.92 (demand zone target)
Risk-to-Reward (RR) ≈ 1:3 or better
Mr SMC Trading point
---
Confirmation to Watch
Rejection candles or bearish engulfing patterns near 154.00
Price failing to break above EMA50 or upper structure
Momentum shift on lower timeframe (M15–H1) confirming entry trigger
---
Summary
USD/JPY shows signs of a bearish correction phase, with price expected to retest premium levels before dropping toward 150.92. The setup is supported by a structure break, Fibonacci confluence, and EMA alignment suggesting downside continuation.
---
please support boost 🚀 this analysis

USD/JPY consolidates due to BoJ rate hike uncertaintyThe USD/JPY pair moved within a narrow range on Friday. The Japanese Yen (JPY) consolidated the previous day's sharp gains, while the US Dollar (USD) managed to gain slightly. The overall movement was limited by conflicting fundamental and political signals in both countries.
## Mixed Signals for the Japanese Yen (JPY)
- Weakness (Delaying Interest Rate Hike): Disappointing Japanese Household Spending data fueled speculation that the Bank of Japan (BoJ) could delay its next interest rate hike.
- Strength (Limiting Declines): However, the minutes of the BoJ's September meeting released last Wednesday maintained expectations for an imminent interest rate hike.
## Risks: USD gains were limited by two concerns:
- Economic risks stemming from the prolonged US government shutdown.
- Market speculation of further interest rate cuts by the Federal Reserve (The Fed).
## Downside Scenario (Bearish)
- Selling Trigger: An overnight break below resistance-turned-support at 153.30-153.25 favors further depreciation.
- Initial Key Support: Further declines are likely to find decent support near the 152.15-152.10 region (although the daily oscillator remains positive).
- Bias Reversal: Continued selling below the 152.00 mark will provide a fresh trigger for bearish traders and extend the decline from the February high.
## Bullish Scenario
- Initial Hurdle: A recovery above the 153.30-153.25 horizontal resistance will face resistance near the 153.65 area.
- Pivot Point: Sustained strength beyond the latter will allow USD/JPY to reclaim the 154.00 mark and retest the 154.45 supply zone. This level should act as a key pivot point.
- Further Targets: A break above 154.45 could lift the spot price to the psychological level of 155.00, and continue to 155.60 - 155.65 and the round number of 156.00.

USDJPY Signs of Exhaustion Near 155 as Yen Sentiment TurnsUSDJPY is showing early signs of fatigue near the 155.00 resistance area, a level that has repeatedly triggered warnings from Japanese officials. After an impressive multi-week rally driven by yield differentials, the pair now faces growing pressure as U.S. rate expectations cool slightly and speculation builds that the Bank of Japan may step in to curb excessive yen weakness. The chart suggests room for a pullback toward the 150.00 zone if the market shifts into a short-term correction phase.
Current Bias
Mildly bearish in the near term, with potential for a correction from 154.50–155.00 toward 150.00 if yields or risk sentiment soften.
Key Fundamental Drivers
U.S. Dollar Drivers: The dollar’s momentum has eased after a mixed batch of U.S. data showing slowing job growth and cautious comments from Fed officials about the pace of future rate cuts.
Japanese Policy Outlook: The BOJ remains under quiet but rising pressure to acknowledge persistent inflation and the side effects of prolonged easing. Markets are watching for any language signaling the eventual normalization of policy.
Yield Spreads: The U.S.–Japan 10-year yield differential remains wide but has stopped expanding, which could limit further USDJPY upside.
Macro Context
The macro backdrop points to a potential cooling phase for USDJPY. The Fed’s gradual pivot toward rate normalization and lower long-end yields reduce upward pressure on the pair. Meanwhile, Japan’s inflation remains above target, and wage growth is improving, adding weight to the argument for a modest policy shift by the BOJ in early 2026.
On the geopolitical front, lingering trade tensions and tariff rhetoric continue to influence sentiment. However, the yen’s traditional role as a safe-haven currency means any escalation in global risk aversion or equity volatility could trigger sharp JPY strength.
Interest rate expectations:
Fed: Market pricing implies one rate cut possible in mid-2026 if inflation slows sustainably.
BOJ: Potential for policy tightening in 2026 remains on the radar, with minor adjustments likely before that.
Primary Risk to the Trend
A stronger-than-expected U.S. CPI print or hawkish Fed communication could renew dollar strength and push USDJPY back above 155. Conversely, verbal or actual BOJ intervention would quickly unwind speculative longs and drive the pair lower.
Most Critical Upcoming News/Event
U.S. CPI and PPI inflation data
BOJ Governor Ueda’s policy commentary
U.S. Treasury yield developments
Leader/Lagger Dynamics
USDJPY acts as a leader among JPY pairs, often setting the tone for crosses like GBPJPY and CADJPY. It follows broad U.S. dollar sentiment but can detach temporarily when Japanese policy expectations or intervention risk dominate.
Key Levels
Support Levels: 151.00 / 150.00
Resistance Levels: 154.50 / 155.00
Stop Loss (SL): 155.40
Take Profit (TP): 151.00 (initial), 150.00 (extended)
Summary: Bias and Watchpoints
USDJPY is nearing an exhaustion point after testing the upper boundary near 155. With U.S. yields stabilizing and the BOJ maintaining a cautious but firmer tone, the near-term setup favors a bearish correction toward 151.00–150.00. A stop loss above 155.40 protects against renewed dollar strength, while profit-taking near 150.00 captures potential downside momentum.
Traders should keep an eye on Fed communications and BOJ rhetoric—any sign of tightening bias from Japan or yield pullbacks in the U.S. could accelerate yen recovery. In the meantime, this remains a market sensitive to intervention talk and sentiment swings, making disciplined risk management essential.

USD/JPY) Bearish trend analysis Read The captionSMC Trading point update
Technical analysis of USD/JPY, suggesting that price may retrace to a premium zone (Fibonacci + EMA confluence) before resuming its downtrend — targeting 152.36.
Here’s the detailed breakdown
---
Overall Idea
The market has broken structure to the downside, confirming a bearish bias.
The idea is that price will pull back into the Fibonacci retracement zone (0.5–0.79) for a lower-high formation, then continue falling toward the target zone near 152.36.
---
Key Components
1. Market Structure
The ascending trendline has been broken, signaling a shift in momentum from bullish to bearish.
The price made a lower low, confirming bearish structure.
The upcoming retracement is likely to form a lower high, completing the transition phase before the next impulse down.
2. Fibonacci Retracement Zone
The blue box (0.5–0.79 levels) marks the optimal sell zone.
It aligns with previous structure resistance and offers high confluence for short entries.
The 0.705 retracement level sits around 153.8–154.0, where a rejection is expected.
3. EMA Confluence
50 EMA (153.736) and 200 EMA (153.385) are above current price and sloping downward.
These act as dynamic resistance, adding confidence to the short setup if price retraces into that zone.
4. Projected Path
Expected movement:
1. Small bullish retracement into 0.5–0.79 Fibonacci zone.
2. Rejection near EMA resistance.
3. Formation of a lower high.
4. Continuation to the downside toward 152.36 (target point).
5. Target Area
The 152.36 zone aligns with the previous low (liquidity area) and a measured move extension, making it a strong downside target.
Mr SMC Trading point
---
Summary
Market bias: Bearish continuation
Setup type: Retracement sell / Trend continuation
Sell zone: 153.70 – 154.00 (0.5–0.79 Fibonacci zone)
Target point: 152.36
Confirmation: Bearish rejection candle or break below minor structure after pullback
Invalidation: Break and close above 154.10
---
please support boost 🚀 this analysis

USDJPYUSDJPY
- Completed " 12345 " Impulsive Waves and " ABC " Corrective Wave
- Break of Structure
- RSI - Divergence
- Break of Structure
- Bullish Channel as an corrective pattern in Short Time Frame

USD/JPY Has a Bearish Trading BiasThe USD/JPY pair is currently stable, with the Japanese Yen (JPY) strengthening slightly against the weaker US Dollar (USD). This JPY strengthening halted the previous day's sharp decline, but the overall movement of USD/JPY is limited by conflicting fundamental factors.
1. Market Fundamental Factors
A. Support for the Japanese Yen (JPY)
BoJ Hawkish: The minutes of the Bank of Japan's (BoJ) September meeting released on Wednesday maintained market expectations for an imminent interest rate hike.
Intervention: Speculation that Japanese authorities might intervene to prevent further JPY weakness also offered support.
B. Limits to JPY Strength and Support for USD/JPY
BoJ Uncertainty: Investors remain uncertain about the exact timing of the BoJ's next interest rate hike. This uncertainty is fueled by expectations that the new Prime Minister, Sanae Takaichi, will pursue an aggressive fiscal spending plan and resist policy tightening.
Global Risk Sentiment: A moderate recovery in global risk sentiment tends to weaken the safe-haven JPY.
Strong USD: The US dollar (USD) held steady near its highest level since late May on the back of the US Federal Reserve's hawkish stance, which helped limit USD/JPY's decline.
2. USD/JPY Technical Analysis
USD/JPY has been struggling below the key resistance level of 154.40-154.45 for over a week. This zone serves as a pivot point that determines the direction of price movement.
A. Bullish Scenario ⬆️
Trigger for a Rise: A sustained breakout and acceptance above 154.40-154.45 will be a signal for bulls.
Next Target: Spot prices will aim to reclaim the psychological 155.00 level.
Continued Target: Continued buying will open the way to the 155.60-155.65 resistance level, before rising further towards the 156.00 level.
B. Bearish Scenario ⬇️
Initial Support: The 153.65 area is expected to offer support, followed by the overnight low around 153.00 - 152.95.
Selling Trigger: Acceptance below 153.00 could trigger technical selling.
Downside Target: The corrective decline will accelerate towards the intermediate support level of 152.55 - 152.50, and extend towards the 152.00 round number and last week's low at 151.55.
USDJPY remains bearish below the pivot zone, with the next directional move to be confirmed by a breakout from the current consolidation range.

USD/JPY Price Outlook – Trade Setup (6 Nov 2025)📊 Technical Structure
FX:USDJPY USD/JPY trades around 153.85, consolidating beneath the Resistance Zone (154.07–154.24) after failing to sustain its rebound from the 153.00 level. The recent rejection near 154.20 indicates selling pressure returning at prior supply levels.
The Support Zone lies between 152.88–153.04, which served as a strong demand base earlier this week. A confirmed breakdown below 153.50 could accelerate a retracement toward this area. Conversely, a sustained break above 154.30 would negate the bearish structure and resume the uptrend.
🎯 Trade Setup
Idea: Short from resistance, targeting retest of key support zone.
Entry: 154.07– 154.24
Stop Loss: 154.28
Take Profit 1: 153.04
Take Profit 2: 152.88
Risk–Reward Ratio: ≈ 1 : 5.72
A decisive hourly close above 154.28 invalidates the bearish setup.
🌐 Macro Background
The Japanese Yen (JPY) strengthens modestly during Thursday’s Asian session, buoyed by revived BoJ rate hike bets, though upside momentum remains limited due to policy uncertainty.
According to FXStreet’s Haresh Menghani, “The Japanese Yen attracts some buying as hopes for an imminent BoJ rate hike persist, though policy caution caps gains.” 【FXStreet】
BoJ Outlook: Minutes from the September BoJ meeting highlighted policymakers’ openness to raising interest rates, citing that the 2% inflation goal has been largely achieved. However, the central bank remains cautious amid external risks and weak global demand.
Fiscal Context: Japan’s new Prime Minister Sanae Takaichi continues to favour aggressive fiscal spending, dampening expectations of rapid monetary tightening.
USD Factors: The US Dollar remains firm after the ADP employment report showed 42,000 new private-sector jobs in October and ISM Non-Manufacturing PMI rose to an eight-month high, reinforcing the Fed’s hawkish bias.
Shutdown Impact: The US government shutdown, now in its 36th day, clouds near-term data reliability and limits aggressive USD buying despite strong fundamentals.
Overall, the Yen’s short-term strength is tempered by BoJ caution and global risk recovery, while the Fed’s hawkish stance continues to anchor USD/JPY above 153. Yet, with technical rejection from resistance and potential consolidation, a short-term corrective dip looks likely.
🔑 Key Technical Levels
Resistance: 154.07 – 154.24
Support: 152.88 – 153.04
Psychological Level: 154.00
📌 Trade Summary
USD/JPY is encountering resistance around 154.20 while forming lower intraday highs. The combination of BoJ rate speculation and Fed hawkish stability suggests a range-bound but corrective bias. The preferred setup is a short from 154.07–154.24, targeting a retracement to 153.00, provided price remains capped below 154.30.
⚠️ Disclaimer
This analysis is for reference only and does not constitute trading advice. Trading involves significant risk, and proper risk management is essential.

USDJPY - Great buy opportunity trade!USDJPY is in a clear bullish channel and has been heading to the upside for a while. USDJPY recently just broke a powerful resistance zone and also held onto support multiple times without ever breaking it. The price is currently approaching a powerful support zone (green trendline) and is very likely to bounce upwards once it has been hit.

USDJPY on free fall!!USDJPY Seems to be on its bear trend, Traders willing to take this opportunity can execute at market execution.

USDJPY Is going UP! great buy trade opportunity!USDJPY is currently stuck inside a strong upward channel and has been moving in a bullish direction for a very long time. It bounced back up from the 50.0 golden fibonacci zone and is very likely to now head toward the 1.618 extension level. It recently broke through a very strong resistance zone (the white line drawn) and is now very likely to test the next resistance zone (the 1.618 extension level) - This is a great buy trade!

USDJPY Is going UP! great buy trade opportunity!USDJPY is currently stuck inside a strong upward channel and has been moving in a bullish direction for a very long time. It recently broke through a very strong resistance zone (the white line drawn) and is now very likely to test the next resistance zone (the upper red trendline) - This is a great buy trade!

USDJPY Local Short!
HI,Traders !
#USDJPY went up and made
A retest of the horizontal
Resistance of 153.179 from
Where we will be expecting
A local bearish pullback
And a move down !
Comment and subscribe to help us grow !
