USDJPY: Tight Range, Big Breakout Coming – Bulls Eye 150.80In recent weeks, USDJPY has been one of the most frustrating pairs to trade.
Since early August, the pair has fluctuated inside a very narrow range between 146.70 and 148.50 — less than 1.5% of movement.
However, such tight consolidations rarely last. They usually precede strong moves, and in my opinion, this breakout is more likely to come to the upside.
Looking at the broader picture:
• The April low around 140 (which also tested September last year’s low) marked a strong structural support.
• From there, the pair began climbing in a constructive way, consistently putting in higher lows on the long-term chart.
• During the current consolidation, we’ve seen two notable bullish reactions: dips slightly below 147.70 were bought aggressively on 14 August and again just two days ago, leaving behind clean bullish pin bars on the daily chart.
Putting these pieces together, my bias is bullish. I expect the current range to eventually resolve higher, with 150.80 as the next major resistance and natural target for bulls.
That being said, the market still needs to confirm this idea:
• Upside acceleration comes with a clear break above 148.50.
• The bullish case would be invalidated by a daily close below 146.50.
As always, patience is key — range markets test our discipline, but they also prepare the ground for the next big move. 🚀
Usdjpysignal

USDJPY exactly dropped from the liquidity zone!As our previous prediction on USDJPY for the potential down trend upon liquidity sweep price in fact started to move in the major direction of the trend. There was few pip over extension which may drive the price now well below the support level. Multiple timeframe trend on USDJPY is bearish, price may continue to drop to the long term monthly supprt 144.81

USDJPY and GBPJPY Analysis todayHello traders, this is a complete multiple timeframe analysis of this pair. We see could find significant trading opportunities as per analysis upon price action confirmation we may take this trade. Smash the like button if you find value in this analysis and drop a comment if you have any questions or let me know which pair to cover in my next analysis.

The Trapdoor Series | USDJPY and the Illusion of StabilityHello traders,
"Markets often build structures that look strong from the outside, but inside they hide a trapdoor waiting to open. On this chart, USDJPY is trading within a rising channel, showing strength at first glance. Yet, multiple CHoCH (Change of Character) points reveal that momentum is fragile every rise carries a hidden weakness.
📌 What stands out here:
Middle Zone has acted as a deceptive balance point, pulling price back again and again, but never giving clear continuation.
Liquidity Pool below, where sell-side orders remain untouched, acts as the hidden floor that price could test at any time.
Gap Fill reaction shows how quickly the market closes imbalances before deciding on its next move.
BSL vs SSL battle highlights how traders are tricked between the highs and lows of the channel, unsure which side will truly break.
This structure is like walking on a floor that looks solid but has a trapdoor hidden beneath. Each candle is a step some are firm, some are fragile and traders who rush forward risk falling through the false ground.
💡 Lesson: A trapdoor only opens when enough weight is placed on it. Similarly, in markets, the real move only happens after enough liquidity has been built to justify a breakout. Until then, what looks like stability can simply be a false stage covering the real path.
👉 The question is: will USDJPY’s next move reveal the hidden trapdoor below 🔻, or will it defy expectations and climb higher 🔺 before the floor gives way? Share your perspective — every view adds another piece to the puzzle."

USDJPY Daily Forecast -Q3 | W36 | D5 | Y25📅 Q3 | W36 | D5 | Y25
📊 USDJPY Daily Forecast
🔍 Analysis Approach:
I’m applying Smart Money Concepts, focusing on:
Identifying Points of Interest on the Higher Time Frames (HTFs) 🕰️
Using those POIs to define a clear trading range 📐
Refining those zones on Lower Time Frames (LTFs) 🔎
Waiting for a Break of Structure (BoS) for confirmation ✅
This method allows me to stay precise, disciplined, and aligned with the market narrative, rather than chasing price.
💡 My Motto:
"Capital management, discipline, and consistency in your trading edge."
A positive risk-to-reward ratio, paired with a high win rate, is the backbone of any solid trading plan 📈🔐
⚠️ Losses?
They’re part of the mathematical game of trading 🎲
They don’t define you — they’re necessary, they happen, and we move forward 📊➡️
🙏 I appreciate you taking the time to review my Daily Forecast.
Stay sharp, stay consistent, and protect your capital
— FRNGT 🚀
FX:USDJPY

USDJPY Daily Forecast -Q3 | W36 | D4 | Y25📅 Q3 | W36 | D4 | Y25
📊 USDJPY Daily Forecast
🔍 Analysis Approach:
I’m applying Smart Money Concepts, focusing on:
Identifying Points of Interest on the Higher Time Frames (HTFs) 🕰️
Using those POIs to define a clear trading range 📐
Refining those zones on Lower Time Frames (LTFs) 🔎
Waiting for a Break of Structure (BoS) for confirmation ✅
This method allows me to stay precise, disciplined, and aligned with the market narrative, rather than chasing price.
💡 My Motto:
"Capital management, discipline, and consistency in your trading edge."
A positive risk-to-reward ratio, paired with a high win rate, is the backbone of any solid trading plan 📈🔐
⚠️ Losses?
They’re part of the mathematical game of trading 🎲
They don’t define you — they’re necessary, they happen, and we move forward 📊➡️
🙏 I appreciate you taking the time to review my Daily Forecast.
Stay sharp, stay consistent, and protect your capital
— FRNGT 🚀
FX:USDJPY

USDJPY possible long for 150.50#usdjpy price remain stuck withing descending wedge channel for one & half month. Ultimately price broke channel to the up side. 147.30-146.75 area of interest for long. stop loss below 146.60. target: 150.50

USDJPY H4 : (Short Position)By analyzing the H4 time frame and observing liquidity at the lows, I have a bearish scenario from 148.60 to 147 or lower

USD/JPY Swing Setup ⁝ Why Thief Layer Strategy Wins Here📊 Asset: USD/JPY — "The Ninja" Forex Bank Heist Plan (Swing/Day Trade)
🎯 USD/JPY Quick Snapshot
🔸 Daily Change: +0.39% (↑)
🔸 52-Week Range: 139.57 - 158.89
📊 Retail & Institutional Sentiment
🔹 Retail Traders: Bearish (60%) – Caution due to political uncertainty in Japan.
🔹 Institutional Traders: Bullish (70%) – Expect USD strength amid BOJ-Fed policy divergence.
🔹 Fear & Greed Index: 62/100 (Greed) – Moderate risk appetite favoring USD.
🔍 Fundamental & Macro Score
🏦 BOJ Policy Outlook:
• Rate hike uncertainty keeps JPY weak.
• Score: 3/10 (Bearish for JPY) 🐻
💵 Fed Policy Outlook:
• 90% chance of 25bps rate cut in September.
• Score: 7/10 (Bullish for USD) 🐂
🇯🇵 Political Risk (Japan):
• Leadership uncertainty weighs on JPY.
• Score: 4/10 (Negative for JPY) ⚠️
🌐 Trade War Risks:
• US tariff tensions may dampen USD strength.
• Score: 5/10 (Neutral)
🎯 Overall Market Outlook
🟢 Bullish (Long) Score: 65% ✅
🔴 Bearish (Short) Score: 35% ❌
📌 Summary: USD/JPY leans bullish due to BOJ hesitation, Fed cuts, and JPY political risks.
❓ WHY THIS Setup?
🔸 USD/JPY is respecting bullish structure while retail is mostly short → contrarian signal 🚨.
🔸 Institutional flow shows confidence in USD strength vs JPY weakness 📈.
🔸 BOJ hesitation + political instability in Japan continues to suppress JPY demand 🐻.
🔸 Layered entry strategy reduces risk of bad timing + maximizes capture of bullish wave ⚡.
🔸 Key target zone 151.500–152.000 offers strong risk/reward for swing & day traders 🎯.
✅ Thief Trading Plan: Bullish Setup
🔸 Entry (Thief Style Layer Strategy 🪤):
• 147.500
• 148.000
• 148.500
• 149.000
(Increase/adjust layers as per your own strategy.)
🔸 Stop Loss (Thief SL 🔒):
• Base SL @146.000
• Adjust according to risk tolerance & personal strategy
🔸 Target 🎯:
• Trap/reversal zone near 152.000
• Safer exit before reversal @ 151.500
⚡ Strategy Breakdown
🔹 Method: Thief OG Layer Strategy = scaling with multiple limit orders instead of single-entry.
🔹 Benefit: Absorbs noise, builds positions step-by-step, reduces FOMO.
🔹 Bias: Swing/Day trade friendly with bullish momentum in higher zones.
👀 Related Pairs to Watch:
💷 OANDA:GBPJPY
💶 OANDA:EURJPY
🇨🇭 OANDA:CHFJPY
💵 OANDA:USDCHF
✨ “If you find value in my analysis, a 👍 and 🚀 boost is much appreciated — it helps me share more setups with the community!”
#USDJPY #Forex #SwingTrading #DayTrading #JPY #ForexStrategy #TradingPlan #FXThief #LayerStrategy #SmartMoney

USDJPY Long Bias Forecast Q3 W35 D28 Y25 – NY Session 🗓️ USDJPY Long Bias Forecast
Q3 W35 D28 Y25 – NY Session
Top-Down Technical Outlook
🔹 Weekly Timeframe
Price Action: Strong rejection from the Weekly 50 EMA, acting as dynamic support.
Note: With two trading days left in the week, the previous weekly wick remains a key area — it may still fill, suggesting further upside potential.
Implication: Structure suggests continuation to the upside, but current price must confirm with internal shifts before entry.
🔹 Daily Timeframe
Current Price: Hovering around the Daily 50 EMA – a key equilibrium level.
Expectation: Potential bullish reaction if buyers defend this zone.
Risk Consideration: Aggressive long entries must be approached cautiously without a confirmed change in internal structure (CHOIS).
🔹 4H Timeframe
Confluence:
Bullish wick closure on the last candle suggests rejection from lower prices.
Order Block (OB) identified near Daily 50 EMA – an ideal POI.
Narrative: Structure is preparing for a potential shift. Look for breaks of internal structure (BOS) to confirm bullish intent.
🔹 1H Timeframe
Candlestick Confirmation: Last 3 consecutive bullish candles forming a classic bullish continuation pattern.
Order Block in alignment with 4H and Daily 50 EMA adds weight to the area.
Bias: Bullish – pending confirmation via BOS and clean pullbacks.
🔹 5-Minute Timeframe
Microstructure:
Refined entry points within OB zone.
Ideal for tight stop entries post BOS and retest of lower-timeframe OB.
Watch For:
Shift from bearish to bullish market structure.
Entry following a break + retest of a demand zone or OB.
✅ Confluences for Longs
Rejection from Weekly 50 EMA.
Price respecting Daily 50 EMA.
4H OB + Bullish candle closure.
1H Bullish formation + OB.
5M potential BOS/CHOIS for refined entry.
⚠️ Cautions / Trade Management
Wait for internal structure shift on lower timeframes before full commitment.
Liquidity sweeps below current price are still possible before upside continuation.
Maintain awareness of macroeconomic catalysts (e.g., U.S. or Japan economic data or central bank commentary).
FRGNT
FX:USDJPY

USDJPY – DAILY FORECAST Q3 | W35 | D28 | Y25📊 USDJPY – DAILY FORECAST
Q3 | W35 | D28 | Y25
🔍 Daily Forecast | USDJPY
Here’s a concise breakdown of the current chart setup 🧠📈:
📌 Higher time frame order blocks have been identified — these are our patient points of interest 🎯🧭.
We wait for a confirmed break of structure 🧱✅ before executing any position.
This keeps us disciplined, and in sync with what the price action is actually telling us — not what we want it to say.
📈 Risk Management Protocols
🔑 Core Principles:
Max 1% risk per trade
Execute only at pre-identified levels
Use alerts, not emotion
Stick to your RR plan (minimum 1:2)
🧠 You’re not paid for how many trades you take — you're paid for how well you manage risk.
"Trade what the market gives, not what your ego wants."
Stay mechanical. Stay focused. Let the probabilities work for you. 🎯📊
FRGNT
FX:USDJPY

USD/JPY Bullish Continuation Towards 149.00This USD/JPY (1H) chart shows a bullish setup:
Price is respecting the ascending channel (support & rejection lines).
Currently, price is near the FVG (Fair Value Gap) zone between 147.257 – 147.526, suggesting a possible retracement before continuation upward.
Both EMA 70 & EMA 200 are aligned closely, acting as dynamic support.
A long entry is expected from the FVG zone with a target point at 148.975 – 149.002.
Stop-loss lies below the FVG around 147.251.
👉 Overall bias: Bullish continuation towards 149.00 after filling the FVG.

USDJPY – Downward Pressure Aiming Straight At 146.000?📉 USDJPY Under Pressure – Could the Drop Extend to 146.000 and Beyond?
The US Dollar continues to weaken across the board, and USDJPY is now showing strong bearish momentum on the H2 timeframe. The chart highlights several critical Fair Value Gaps (FVGs) and liquidity zones that could guide price action in the coming sessions.
📊 Technical Outlook (H2):
Recent rejection confirms supply pressure, opening the door for a deeper retracement.
Key FVG Zone between 148.57 – 149.52 acts as a short-term supply area.
As long as price trades below this zone, bearish continuation remains in play.
🔑 Levels to Watch:
147.94 – minor reaction zone.
146.56 – 146.03 → strong demand / liquidity pool; price may test these levels soon.
A clean break below 146.00 could open the path toward deeper downside targets.
⚡ What This Means:
With USD weakness persisting, USDJPY could face another significant leg lower. Traders should monitor liquidity grabs and confirmations around the 146.xx zone for potential setups.
🔥 Do you see USDJPY holding the 146.00 demand area, or will the sell-off accelerate further?
👇 Share your view in the comments!

USDJPY may drop to daily low!USDJPY from the daily there is a sideway move, with a strong rejection from the daily resistance 148.78. Today's price so far tested the daily high and currently from the hourly perspective price is creating multiple doji with liquidity grab from the daily resistance giving a high probability for the price to drop to daily support level.
A possible buy trade is high probable.

USDJPY has done false breakdown?USDJPY trade setup for today :
Before we look at potential entry in this pair first let’s look at multiple timeframe analysis in this market.
Monthly: 150.79 Monthly resistance price has got rejection strongly from the top
Weekly: After multiple doji formation, price is about to bounce off the support level potentially move back to the upside.
Daily: With a massive rejection on Friday, USDJPY started to fill the imbalance and price may continue to move back to the upside.
Entry timeframe 4H : Upon rejection from any previous candles support, price may continue to bounce.
Possible trade recommendation : Bullish entry with SL above sessions high

USDJPY Set to drop to support?USDJPY trade setup for today :
Before we look at potential entry in this pair first let’s look at multiple timeframe analysis in this market.
Monthly: 150.79 Monthly resistance price has got rejection strongly from the top
Weekly: Previous weekly closed with bearish engulfing patter with liquidity grab.
Daily: Upon formation of head and shoulder price has got rejection with a strong momentum and price may continue to drop to support level.
Entry timeframe 4H : As price has confirmed cross over of 20ema and 10ema we may see price continue to drop to daily support level.
Possible trade recommendation : Bearish with SL above the sessions high.

USD/JPY) Bullish Trend Read The captionSMC Trading point update
Technical analysis of USD/JPY (2H) analysis you shared:
---
Technical Breakdown
1. Price Action & Zone
Price retraced into a Fair Value Gap (FVG) / demand zone (yellow box) around 147.00 – 147.40.
Strong buying interest is visible from this zone.
2. Falling Wedge Pattern
A falling wedge has formed, which is typically a bullish reversal pattern.
Price is attempting to break out above wedge resistance, showing potential for upside momentum.
3. EMA (200 Close)
Price is interacting with the 200 EMA (147.58), serving as dynamic resistance.
A sustained breakout above this EMA would confirm bullish continuation.
4. RSI (14)
RSI currently around 46–50, suggesting neutral momentum with room for upside.
---
Trade Idea
Bias: Bullish
Entry Zone: On breakout & retest of wedge / demand zone.
Target: 148.680 (as marked).
Invalidation: Below 146.60 (clear break under demand/FVG zone).
Mr SMC Trading point
---
This setup suggests a bullish reversal from support, with a likely push toward 148.68 after wedge breakout.
please support boost 🚀 this analysis)

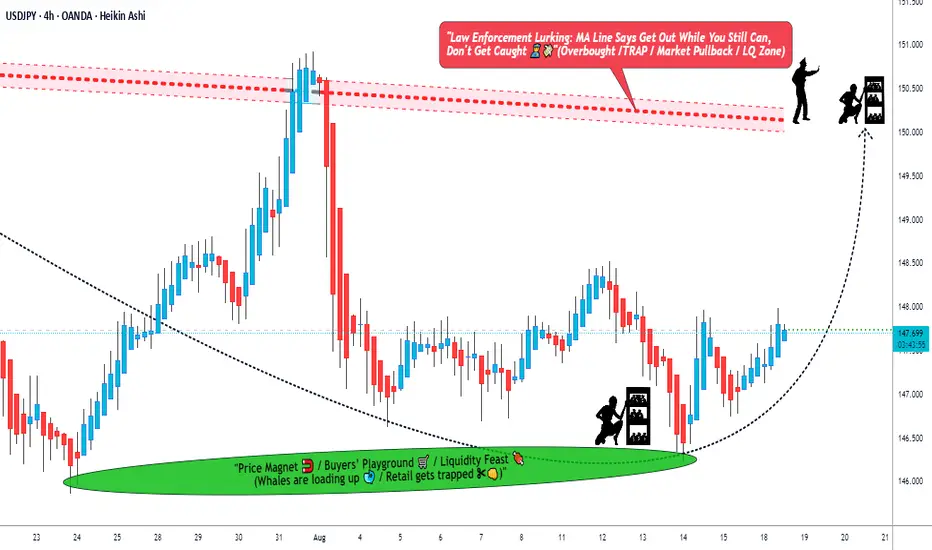
"The USDJPY Ninja Trade – Silent Entry, Big Exit!"🚨💰 USD/JPY “The Ninja” Forex Bank Heist Plan (Swing Trade) 🐱👤💴💵
🎭 Dear Money Makers, Robbers & Thief OG’s,
It’s time to gear up for our biggest Ninja heist on the Forex streets!
We’re breaking into the USD/JPY vault with a Bullish Master Plan – grab your mask, load your limit orders, and let’s rob the market clean! 💰🔫
🗡️ Heist Entry (Layering Style) 📈
Thief doesn’t enter with one bullet – we spray the vault with multiple limit orders! 🎯
First layer: 147.600
Second layer: 147.400
Third layer: 147.200
👉 Add more layers if you want a deeper pullback entry – the more locks you pick, the bigger the loot! 🏦💎
🛑 Thief Stop Loss
This is Thief SL 🔒: 146.500
But remember, dear ladies & gentlemen (Thief OG’s) – adjust your SL based on your own strategy, capital & risk appetite. Stay slick, don’t get caught! 🚔💨
🎯 Target Escape Zone
Police barricade spotted 🚨👮 @ 150.700
Our heist exit point is locked at 150.000 🏃♂️💨
👉 Make sure you grab the loot & escape before the cops arrive. Take profit & celebrate with stolen sushi 🍣 & sake 🍶!
⚠️ Thief Trading Notes
News drops = extra police patrols 🚔 – avoid opening fresh entries during major releases.
Trail your stops to lock in profits – no thief leaves empty-handed!
Stay alert to price traps – don’t get stuck behind enemy lines.
💎 If this heist plan made you some loot, smash that 💖 & BOOST button to power up the Thief Gang 🚀🤝💰
The more boosts, the bigger our robbery squad becomes!
Stay tuned, Ninjas 🐱👤 … the next heist plan is already loading.
💵💎🚀 Thief Trader OUT.
USDJPY - ShortUSDJPY Analysis - SELL 👆
In this Chart USDJPY H4 Timeframe: By Nii_Billions.
❤️This Chart is for USDJPY market analysis.
❤️Entry, SL, and Target is based off our Strategy.
This chart analysis uses multiple timeframes to analyze the market and to help see the bigger picture on the charts.
The strategy uses technical and fundamental factors, and market sentiment to predict a BEARISH trend in USDJPY, with well-defined entry, stop loss, and take profit levels for risk management.
🟢This idea is purely for educational purposes.🟢
❤️Please, support our work with like & comment!❤️

USDJPY ready to drop another 100 pip?USDJPY has done a fake out with retest of the daily high price started to move back to the major direction of the trend with second step liquidity grab 147.27 level with a price action confirmation to reject further back below. As the last day of trading week price may continue to drop to long term support 145.90 with further possibility to reject back below.

USD/JPY 1D Forex Chart - August 12, 2025daily performance of the U.S. Dollar (USD) against the Japanese Yen (JPY) as of August 12, 2025. The current exchange rate is 148.277, reflecting a 0.09% increase (+0.136). The chart includes a trendline indicating a potential upward movement, with a buy signal at 148.277 and a sell signal at the same level. Key support and resistance levels are marked, with a notable range between 146.786 and 151.234. The chart spans from early 2025 to mid-2026, showing historical price action and future projections.

USDJPY potential buy area!USDJPY 4H price has formed 2 important impulse and started to move back to the upside with new series of higher high and higher low showing a potential trend continuation.
Daily price is just crossed above 10ema and may pullback to daily 10ema which is also 4h support an important level where a bullish trade is high probale.

USD/JPY Poised for Breakout as Fundamentals & Technicals AlignUSDJPY is entering a critical juncture where both macroeconomic conditions and price structure are pointing toward a potential bullish continuation. The pair has been consolidating just under a descending trendline after a sharp drop from July’s highs, but strong US fundamentals, a persistently dovish Bank of Japan, and upcoming political catalysts are creating the perfect environment for an upside breakout. If buyers can reclaim momentum above near-term resistance, the path toward retesting multi-month highs appears open, with yen crosses likely to follow the lead.
Technical Analysis (4H Chart)
Price is consolidating around 147.46 after falling from the 150.91 high.
A descending trendline from the late-July peak is being tested. A confirmed breakout would likely accelerate bullish momentum.
Key upside targets:
148.96 – immediate resistance & short-term target (previous swing high).
150.91 – major resistance at July’s high.
Stop-loss at 146.43 safeguards against deeper retracements.
The structure reflects a series of bullish continuation patterns (flags, breakouts, retracements).
Fundamental Analysis
Current Bias: Bullish
USD Strength: Strong US data and anticipation of Trump’s “major” economic announcement are lifting the dollar.
JPY Weakness: Despite better-than-expected Japan Eco Watchers Survey, the BoJ’s ultra-loose stance continues to suppress yen demand.
Rate Differentials: Still heavily in USD’s favor, sustaining upward pressure on USD/JPY.
Risk Sentiment: Even with mild geopolitical tensions, USD’s safe-haven appeal is preventing JPY from benefiting.
Risks:
Disappointing US political announcements.
Hawkish surprises from the BoJ.
Sharp swings in risk sentiment favoring the yen.
Key News/Events Ahead:
Trump’s economic policy reveal.
US CPI & PPI releases.
BoJ policy signals or commentary.
Leader/Lagger Dynamics:
USDJPY is the leader for yen crosses, often setting the tone for GBPJPY, AUDJPY, and CHFJPY.
Summary:
USDJPY’s bullish outlook is reinforced by the combination of favorable fundamentals and a technical setup pointing toward a breakout. A move above 147.80–148.00 could open the door to 148.96 in the short term and 150.91 in the medium term. With yen crosses closely tied to USDJPY’s movements, this pair’s breakout could spark broader JPY weakness across the board, making it a pivotal chart to watch in the days ahead.
