USDNOK


ANALYSIS: USDNOK BREAK OR BOUNCEUSDNOK is currently ranging on the 4hr timeframe after price rejected the weekly resistance zone.
In order to look for short opportunities, we need to see a break and close below this 4hr range.
We could look for early opportunities at the minor resistance.


USDNOK: 4H Rectangle. Scalp opportunity.The pair is ranged within a 4H 8.67182 - 8.80533 Rectangle and as long as 1D remains neutral (RSI = 51.622, ADX = 25.601, Highs/Lows = 0.0000) it will be an ideal scalping opportunity. Buy zone = 8.67182 - 8.69700, Sell zone = 8.7881 - 8.80533.
** If you like our free content follow our profile (www.tradingview.com) to get more daily ideas. **
Comments and likes are greatly appreciated.

ANALYSIS: USDNOK WEEKLY CHART SUGGESTS A REVERSALLooking at the USDNOK weekly chart we can see that price rejected the
key weekly highs. Despite the fall in Oil, the Norwegian Krona performed well,
this could be a sign of strength to come.
We will be watching the 4hr timeframe for shorting opportunities in line
with the weekly timeframe.


USDNOK short swing trade setupUSDNOK short swing trade setup
Sell 8.65720
T1 8.60250
T2 8.55945
SL 8.71145

Trend Analysis For USD-NOK But with NOK-USD view of situation Possible Sell Opportunity for USD-NOK. This analysis was done on NOK-USD, the analysis will show supporting zones to buy which in turn is Opportunity to sell USD-NOK.

USD/NOK Sell Limit Hi All ,
Setting my sell limit on this pair , When price touch that resistance i expect 30-40pips drop or more , NFP will push this .
Many Thanks.

USDNOK - approaching Resistance!USDNOK is approaching Resistance. Price can sell off towards 8.45 - 8.40. However A break and close above 8.82 would initially open up for a potential continuation towards 9.00.

VIDEO ANALYSIS: USDNOK AT KEY SUPPLY ZONEIn this video update, we take a look at USDNOK as price sits at a key supply zone.
The USD Index highlights the potential weakness to come in the USD and with
Crude oil prices stabilising after the recent inventories we could see this market
trade within the range. Technically the daily candle is showing a false breakout.
The 4hr timeframe also shows price forming a bearish channel where we could
see a bearish breakout.


USDNOK Short Nice Opportunity Entering short at the top of 6mo range. Reversal zone.
TP 266pips
SL 70pips
Go small!
DXY also looking bearish, matching our play here.


some short leftI entered this earlier with a gold long. Yet, this might have a little left on the move.


USD NOK BUY (US DOLLAR - NORWEGIAN KRONE)Hi there. Price is forming a continuation pattern to the upside. Wait for the price to hit the bottom of the pattern and watch strong price action for buy.

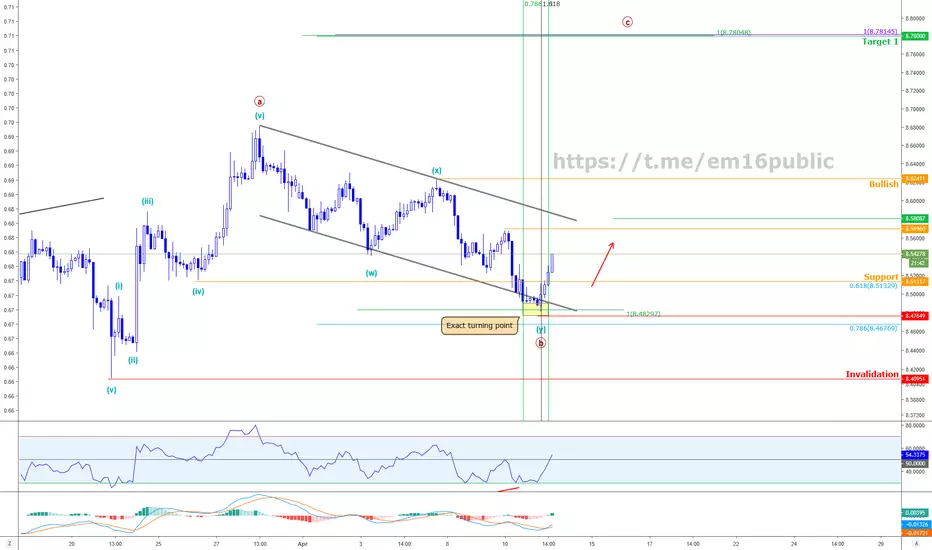
USDNOK - Time and Ratio indicate the botom is in place !Looking for price to go up to 8.7 as first target.
Time Fib and Fib projection (extension) perfectly align around 8.48 and indicate the bottom is in place.
Any move below 8.40 invalidates the count but you can stop if price comes below 8.46.
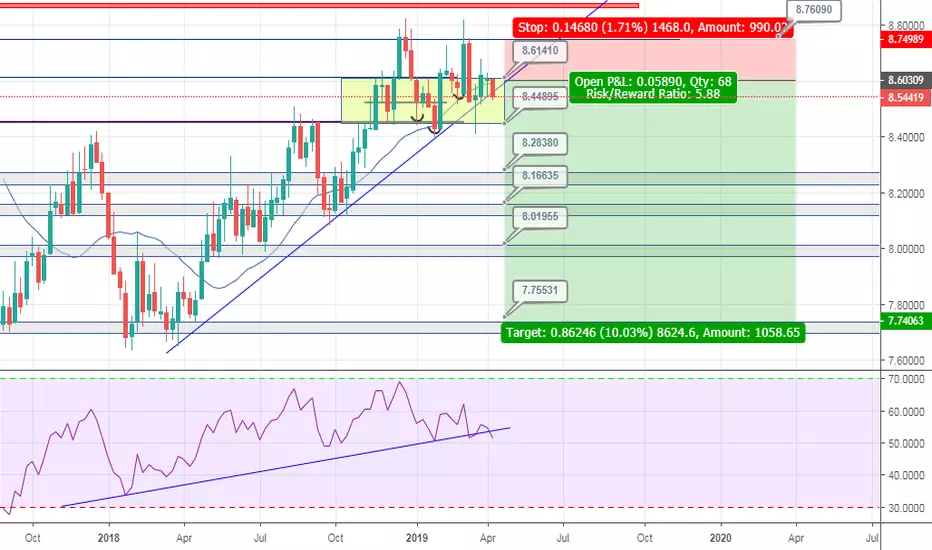
USD/NOK Sell Hi All,
opening my Second Swing Trade on this pair . Looking at the chart and candlestick pattern i see trend reversal to the previous low , now this might take a few months , but for day traders, you can take profit at the bottom of the rectangle range and then re-enter when price move back up to the top of the range .
DAY/ SWING remember SL to entry as always .
Many Thanks.

Usd/NokHi All ,
I'm joining the trend on this pair , The downward movement stopped at the bottom of the rectangle range and since then price has moved up to test the previous high , so as always , SL to entry when price move in our direction and we will ride this to the previous high .
Many Thanks.

