USD/JPY - Interest Rate Ahead! (08.12.2025) 📝 Description FX:USDJPY
USD/JPY continues to respect the Bearish Channel Pattern, with price rejecting the upper boundary and failing to break the resistance zone. Combined with strong fundamentals—expected Fed rate cut and potential BoJ tightening—the setup favors downside movement.
A break and retest of intraday support confirms continuation toward lower channel targets.
📌 Trading Plan📉 Bearish Continuation
Entry Idea: Look for sells below 155.00 after confirmation
Target 1: 154.28 (1st Support)
Target 2: 153.94 (2nd Support / Channel Bottom)
Bearish Confirmation: Clean rejection from resistance zone + break below small retracement support
⚠️ Fundamental Updates (Today)
1️⃣ Federal Reserve Meeting
→ Markets widely expect a rate cut, weakening the USD.
2️⃣ Bank of Japan Rate Outlook
→ BoJ may increase interest rates, a JPY-strengthening factor.
Combined effect:
🔻 USD weak + 🔺 JPY strong → Bearish USD/JPY bias
⚠️ Disclaimer
This idea is for educational analysis only.
Not financial advice. Always trade with proper risk management.
👍 Support the Analysis❤️ LIKE the post💬 COMMENT your view🔁 SHARE to help others
Your support motivates more high-quality analysis! 🙌
#USDJPY #ForexTrading #BearishSetup #ChannelPattern #TechnicalAnalysis #FundamentalAnalysis #JPY #USD #FXMarket #TradingView #PriceAction #Kabhi_TA_Trading
DJ FXCM Index

GBPUSD Bullish Setup: Waiting for the Perfect PullbackGBPUSD has broken above the daily resistance and has established a clear uptrend on the 1-hour timeframe. The market structure is currently bullish, supported by a clean upward trendline.
On the 1H chart, price has created a Fair Value Gap (FVG) and is now expected to make a pullback after forming a swing high. The ideal retracement zone is around the 50%–61.8% Fibonacci levels, which aligns perfectly with:
- A strong support level
- The 1H FVG zone
- The Fibonacci retracement levels
- The uptrend trendline
This area forms a high-probability confluence zone for a potential long entry.
Once price reaches this zone, we must wait for a 5-minute Change of Character (CHOCH) to the upside.
If the market prints a clear bullish CHOCH with a strong candlestick confirmation, a long position may be justified.
However, if the price reaches the trendline and breaks below it without giving a bullish CHOCH on 5M, the setup becomes invalid and no long trade should be taken.

EURUSD Channel Up starting its new Bearish Leg.The EURUSD pair has been trading within a 1-month Channel Up and has already completed two straight red 1D candles. Last time this happened, the pattern had technically started its previous Bearish Leg.
Since there is a high degree of symmetry between the structural Legs of this pattern, we expect the current one to repeat the former -1.40% decline and target 1.15250.
---
** Please LIKE 👍, FOLLOW ✅, SHARE 🙌 and COMMENT ✍ if you enjoy this idea! Also share your ideas and charts in the comments section below! This is best way to keep it relevant, support us, keep the content here free and allow the idea to reach as many people as possible. **
---
💸💸💸💸💸💸
👇 👇 👇 👇 👇 👇

WEEKLY WARMAP: DOLLAR MARKETThe week begins with a balanced dollar, firm U.S. yields, and suppressed volatility.
DXY remains inside its 97.672–99.985 range, reflecting equilibrium rather than trend.
No directional signal is valid until structure breaks.
Short-end yields moved ~2.8% higher last week and extended another ~0.76% into Monday’s session.
The 10-year yield advanced ~2.88% last week with further upside today.
The curve is repricing risk while volatility remains suppressed following a ~16.6% decline.
This week’s macro catalysts:
FOMC decision + Powell press conference
JOLTS labor demand data
PPI
Weekly jobless claims
Federal budget and projections
All influence: credibility, yield expectations, liquidity conditions.
Cross-asset behavior remains neutral.
ES stays inside its 6540.25–6953.75 bracket — strong order flow but extended location near the monthly upper boundary and roughly +2 deviations above the mean.
Gold remains inside its 3996.2–4380.7 weekly range.
Key DXY levels:
98.175 — downside liquidity
98.917 — upside structural trigger
Inside this band = non-directional behavior.
Outside = actionable change.
The overall environment reflects structural tension, not directional conviction.
TECHNICAL CONTEXT (CORE5 STRUCTURE)
DXY trades only 0.11% from monthly balance, creating conditions for algorithmic defense at key price boundaries.
The current question:
rotation or continuation?
Price remains inside its daily range (97.672–99.985).
Structure is balanced, but location matters:
DXY sits within the dynamic discount zone on the DGM model
This typically supports accumulation
But there is a bullish volume cap beneath price — an unfinished orderflow pocket resembling a bookkeeping discrepancy
This imbalance often requires a downward corrective spike before any sustained upward movement.
If bearish flow develops:
Liquidity sits cleanly below 98.175 and may be targeted before stabilization.
If bullish flow emerges:
A daily close above 98.917 is required to confirm shift.
Anything below this level is intra-range noise.
Current read:
Structure: balanced
Geometry: supportive zone
Volume: incomplete
Order flow: neutral, awaiting data
Execution: conditional environment, not trend environment
This week’s direction depends on how DXY responds to the incoming data sequence.
WEEKLY TAKEAWAY
Two levels govern the week:
98.175 → downside liquidity
98.917 → upside structural trigger
Inside the band: neutral.
Outside the band: decisive.
— CORE5DAN
Institutional Logic. Modern Technology. Real Freedom.

GBPUSD POSSIBLE SELL & BUY SETUP✅ BUY Scenario (Bullish)
Bias: Bullish as long as price stays above the demand zone at 1.32150–1.32124.
✔️ Conditions for a Buy
Price pulls down into the green demand zone
We see a reaction or CHoCH on lower timeframes
Price begins to push upward from demand
✔️ Long Entry
Inside 1.32150–1.32124
(This is your best discounted “buy” area)
✔️ Stop-Loss
Below 1.31770 (the liquidity sweep low)
✔️ Take Profit
The red supply zones above:
First target: 1.33500
Main target: 1.34775
✔️ Simple Logic
Demand → Sweep → Shift → Buy pullback → Target supply.
✅ SELL Scenario (Bearish)
Bias: Bearish only if price breaks below demand and fails to rebound.
✔️ Conditions for a Sell
Price breaks below 1.31770
Retests that level as new supply
Fails to reclaim demand (lower highs form)
✔️ Short Entry
After a pullback into the broken demand turned supply
(A retest of 1.32124–1.32150 from the underside)
✔️ Stop-Loss
Above the retest wick
✔️ Take Profit
Lower liquidity zones around:
1.31000
1.30500 (major downside target)
✔️ Simple Logic
Breakdown → Retest → Sell → Target lower liquidity.
🎯 Clean Summary
BUY:
Wait for price to dip into 1.32150–1.32124 → Look for reaction → Buy → Target 1.34775.
SELL:
Wait for price to break below 1.31770 → Retest → Sell → Target 1.30500.

EUR/USD - Buy Entry (H1 - Flag Pattern)The EUR/USD Pair, Price has been trading within a Flag Pattern on the H1 chart, forming consistent higher highs and higher lows. Price action is now testing the upper boundary of the Pattern, signalling a possible breakout. FX:EURUSD
✅Market Context:
1️⃣Strong Upward Structure Inside the Pattern.
2️⃣Buyers are showing strength near Resistance.
3️⃣Breakout above the Trendline indicates Momentum continuation toward higher zones.
✅Trade Plan:
Entry: Buy after Confirmed Breakout above the Resistance (H1 candle close above trendline or retest of the breakout).
💰Take Profit (TP): At the Key Zone – a Major Resistance area identified ahead.
🛑Stop Loss (SL): Below the Pattern Structure.
✅Psychological Discipline :
1️⃣Stick to plan – No Revenge Trades.
2️⃣Accept losing trades as Part of the Strategy.
3️⃣Risk only 1–2% of your account balance per trade.
✅ Support this analysis with a
LIKE 👍 | COMMENT 💬 | FOLLOW 🔔
It helps a lot & keeps the ideas coming!
⚠️ Disclaimer: This analysis is for educational purposes only and does not constitute financial advice. Forex trading involves high risk. Trade only with capital you can afford to lose and always do your own research.

Forex: Weekly Review Overall sentiment has been positive ever since the market jumped on 'relatively dovish' comments from FED member WILLIAMS. And the positivity remained throughout the week starting Monday 1 December, backed up by another string of 'softish' US data and the (likely) incoming appointment of HASSETT to replace FED chair POWELL. (The theory being Hassett will push a dovish agenda).
The potential spanners in the works could be the upcoming FOMC meeting, is the market over exuberant expecting a rate cut? Will chair POWELL have one more hawkish twist in him?. And although subsided for now, AI bubble concerns still simmer in the background.
For now, I'll begin the new week looking for 'risk on' trades, the risk to any trade could be 'lackluster movement' ahead of Wednesday's decision.
The week didn't pass without the odd hiccup, namely negative UKRAINE war comments keeping geopolitical concerns on the markets mind. And 'hawkish' BOJ comments combined with president TAKACHI walking back some stimulus comments (in an attempt the calm the Japanese bond market) gave the JPY bouts of strength. I reiterate that the sooner the BOJ hike and declare the end of the hiking cycle, the better, we will likely get bouts of choppy JPY movement until then.
Following on from the previous week's positive CAD data, Friday's 'hot' Canadian jobs data keeps sentiment for the CAD bouyed, as ever, the risk to any CAD long trades would be its penchant for tracking the USD and oil.
On a personal note, it was a week of two trades, CAD JPY long which stopped out very quickly, aside from 'only' using a 15min stop loss, I could only surmise sentiment took a brief hit from Putin's negative comments. Wednesday's NZD USD long took an age and was eventually closed for a small profit, the fact I was still in the trade during Fridays 'hot' CAD data meant I had to sit that one out. Missing out on a trade due to already being in one does occasionally happen and is just something we have to accept.
I being the new week with a tentative 'risk on bias'. But with four central bank decisions, it could be a week of twists and turns ahead.

Velocity Of Money Rolling Over Again!The Real Interpretation
This chart is telling one story:
Money supply growth has massively outpaced real output for decades.
It lines up perfectly with:
Falling real productivity
Stagnant wages
Declining borrower quality
Rising debt-to-GDP
Asset inflation decoupling from fundamentals
The economy shifting from productive borrowing → consumption and asset speculation
You don't fix this with “policy choices.”
You fix it with real wealth creation, which requires creditworthy borrowers — not printing.
Forward-Looking View
Unless:
Productivity rises
Real output accelerates
Borrowers gain real income strength
Capital flows into productive sectors instead of financial games…this ratio won’t materially rise.
That means:
Every new dollar is buying less GDP
Long-term growth potential is fading
More money chasing fewer productive opportunities
More fragility in the credit system
It’s a classic late-cycle fiat symptom.
Here are questions to ask:
If “money creation” creates growth, why is GDP-per-dollar collapsing?
Why did 40 years of money expansion not produce proportional GDP?
If borrowers create loans, where are the new productive borrowers?
Why did QE cause asset inflation but no sustainable GDP boost?
If the system is “fine,” why does each new dollar buy less real output?
Perma Bulls, MMTers, Politicians etc.. can’t answer those without admitting the private-sector engine is weakening.
The less productive output per $ while the markets keep rising & rising will only produce less and less profit per share over time. No matter how much lipstick they put on that pig. Eventually, the economy & markets will CRASH! They always correct themselves in the end.
Perma Bulls have no exit strategy and will go down with the boat!
MMTers will want Gov to borrow and spend EVEN MORE! despite the empirical self-evident fact that print and play doesn't work!
Politicians will borrow and spend even more, claiming they will "STIMULATE THE ECONOMY"
I got all that from just one chart? NO! The entire spectrum of data.
Here is one
THANK YOU for getting me to 5,000 followers! 🙏🔥
Let’s keep climbing.
If you enjoy the work:
👉 Drop a solid comment
Let’s push it to 6,000 and keep building a community grounded in truth, not hype.

EUR/USD Still Struggling to Trend but Bulls Take Step ForwardThat 1.1500 level in EUR/USD has proven to be a tough spot to crack and the higher-low from two weeks ago has now pushed into a higher-high.
But with that said, buyers seemingly refused to drive this week even with a higher-high to go along with that higher-low, and this sets the stage for next week's FOMC meeting as a breakdown in the USD will likely need EUR/USD bulls to make a push.
For next week, it's the 1.1593 level that looms large in EUR/USD and if that level gives way, it's going to look like a failed breakout and it'll expose the 1.1500 level for another re-test.
For USD-weakness, GBP/USD has shown more attractive bullish structure and for USD-strength, USD/JPY makes for a stronger argument, at least until some semblance of trend shows itself in EUR/USD. - js

Trade closed manually It was a slow burner and almost hit the profit target but I've eventually closed my NZD USD trade for a small +0.7 profit (to avoid weekend risk).
All in all, the positive narrative remains, meaning until something changes, I'll continue looking for 'risk on trades' short USD, JPY (BOJ rate hike chatter being a risk) and also, short CHF appears viable again. (It's now all eyes on next week's fed meeting).
Side note that positive data boosted the CAD today and would have made a nice trade for anyone at the charts at the time and not already in a trade.
Wishing you a lovely weekend

GBPUSD on a multi-year decline that's far from being over.The GBPUSD pair is currently on a 5-week rebound following the November 03 Low just below its 1W MA50 (blue trend-line). Despite this short-term reaction, the general long-term trend remains bearish following the June 30 2025 High.
That High started a Double Top sequence that is similar to both previous Cycle Tops since January 22 2018. Even though this latest one didn't take place exactly on the Lower Highs trend-line, it was priced on the closest level to the 1M MA200 (red trend-line) since September 2014.
At the same time, the 1W RSI printed the exact same 8-year Resistance Zone rejection pattern as the previous 4 times. Based on the previous 2 Cycles, we expect the 1st Leg of this long-term correction to approach the 1W MA200 (orange trend-line) on a -7.64% (minimum) drop, targeting 1.2750. Then after a bounce to retest and get rejected on the 1W MA50, we expect it to aim then 9-year Symmetrical Support Zone at 1.2100.
---
** Please LIKE 👍, FOLLOW ✅, SHARE 🙌 and COMMENT ✍ if you enjoy this idea! Also share your ideas and charts in the comments section below! This is best way to keep it relevant, support us, keep the content here free and allow the idea to reach as many people as possible. **
---
💸💸💸💸💸💸
👇 👇 👇 👇 👇 👇

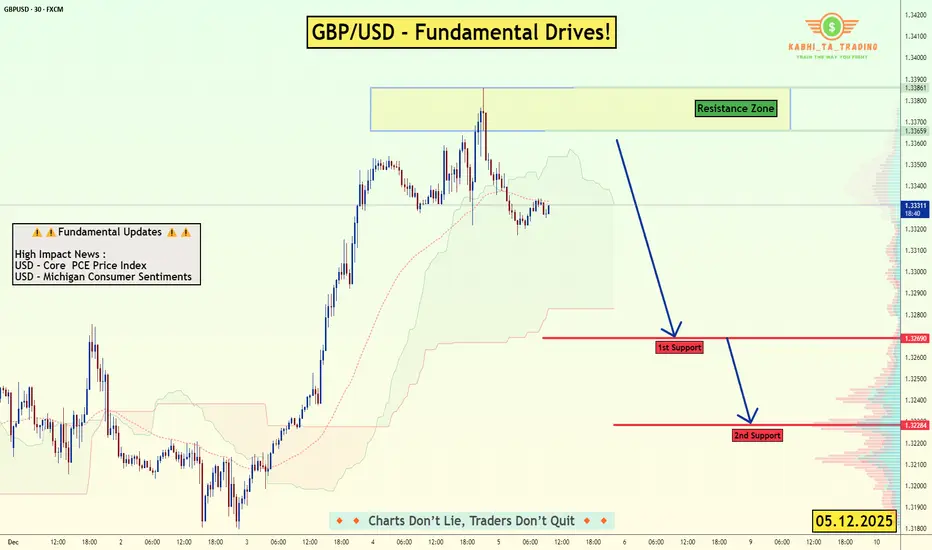
GBP/USD – Fundamentals Drive the Move! (05.12.2025)📝 Description FX:GBPUSD
GBP/USD is currently trading below the resistance zone after failing to hold recent bullish momentum. With USD Core PCE Price Index and Michigan Consumer Sentiment releasing today, the pair may see increased volatility, potentially pushing the price lower if USD strengthens.
A rejection from the resistance zone combined with weakening intraday structure suggests a possible bearish continuation toward support levels.
📌 Key Support & Resistance Levels
🔺 Resistance Zone: 1.3359 – 1.3386
🟥 1st Support: 1.3269
🟥 2nd Support: 1.3228
⚠️ Fundamentals Today
1️⃣ USD – Core PCE Price Index (High Impact)
2️⃣ USD – Michigan Consumer Sentiment (High Impact)
#GBPUSD #ForexAnalysis #PriceAction #Fundamentals #USDNews #TechnicalAnalysis #TradingPlan #ChartAnalysis #FXTrading #TradingView #Kabhi_TA_Trading
⚠️ Disclaimer
This chart is for educational purposes only, not financial advice.
Always use stop-loss and manage position size according to your risk tolerance.
👍 Support the Analysis❤️ Please LIKE💬 Drop a COMMENT
🔁 SHARE if you found this helpful!
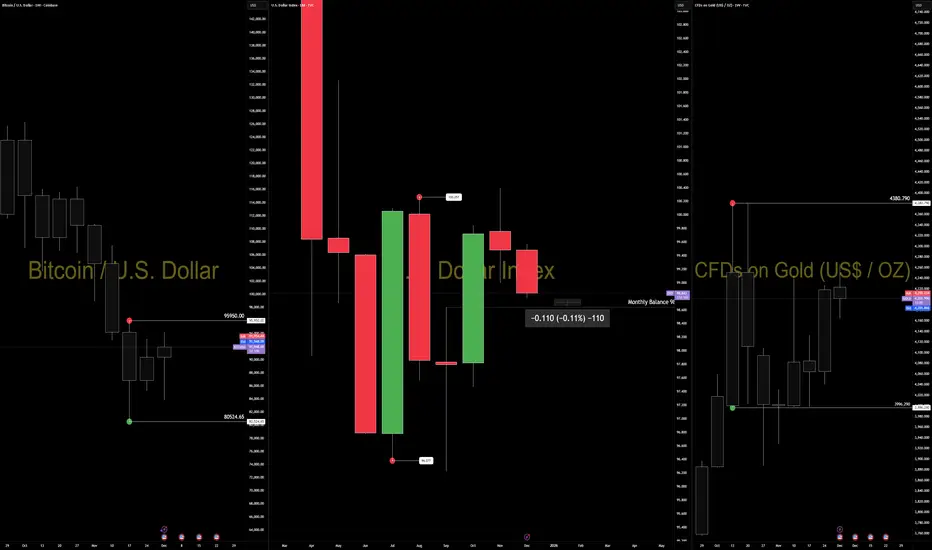
The Dollar Is Compressing Into 98.635 — Macro Pressure Meets StrThe dollar has been under steady macro pressure all week.
Rate cut expectations, softer yields, and liquidity repricing have weakened the USD across the board.
We’ve seen the same conditions lift EURUSD, gold, and BTC — not because those markets react to DXY levels, but because they respond to the same macro drivers.
That is the correct interpretation.
Now the structural question is simple:
DXY is sitting less than 0.11% above monthly balance and pressing into 98.635 — the level algorithms historically defend.
This is the inflection.
If 98.635 holds:
USD stabilizes, stretched rotations cool, and we likely see counterflow in EUR, gold, and BTC.
If 98.635 breaks:
Macro pressure accelerates, and the next leg of dollar weakness opens with far more momentum.
The key distinction:
FA explains the pressure.
TA defines the resolution.
Cross-asset strength today isn’t randomness.
It’s macro conditions expressed differently across instruments while USD approaches the structural point where the next phase becomes obvious.
Watch 98.635.
Structure will answer what fundamentals only set up.
— CORE5DAN
Institutional Logic. Modern Technology. Real Freedom.
USDJPY Channel Up is pulling back in search of a bottom.The USDJPY pair has been trading within a Channel Up pattern since the April 22 market bottom. Right now it is on its latest Bearish Leg, correcting the rally that priced the Higher High, in search of a bottom (Higher Low).
The last pure Higher Low was priced exactly on the 1D MA100 (green trend-line). We expect the price to bounce either on the 1D MA50 or on the 1D MA100, which means for traders that they can allocate the risk (lots) evenly on those entries. The Target is the 162.000 Resistance.
---
** Please LIKE 👍, FOLLOW ✅, SHARE 🙌 and COMMENT ✍ if you enjoy this idea! Also share your ideas and charts in the comments section below! This is best way to keep it relevant, support us, keep the content here free and allow the idea to reach as many people as possible. **
---
💸💸💸💸💸💸
👇 👇 👇 👇 👇 👇

EUR/USD - Triangle Breakout (03.12.2025)📝 Description🔹 Setup Overview FX:EURUSD
EUR/USD has broken above the Triangle Pattern, signaling a potential bullish continuation.
Price retested the breakout zone cleanly and is now showing steady upward momentum.
A break above the next intraday resistance could trigger a move toward the higher liquidity levels shown on the chart.
📌 Support & Resistance Levels
🔺 Resistance 1: 1.1666
🔺 Resistance 2: 1.1700
🟩 Support Zone: 1.1600 – 1.1588
#EURUSD #ForexAnalysis #TrianglePattern #Breakout #FXTrading #PriceAction #TechnicalAnalysis #TradingView #ChartStudy #Kabhi_TA_Trading #ForexTrader #MarketAnalysis
⚠️ Disclaimer
This analysis is for educational purposes only.
Not financial advice. Always trade with proper risk management and stop-loss protection.
👍 Support the Analysis❤️ Like the post 💬 Comment your view 🔁 Share to help the community!

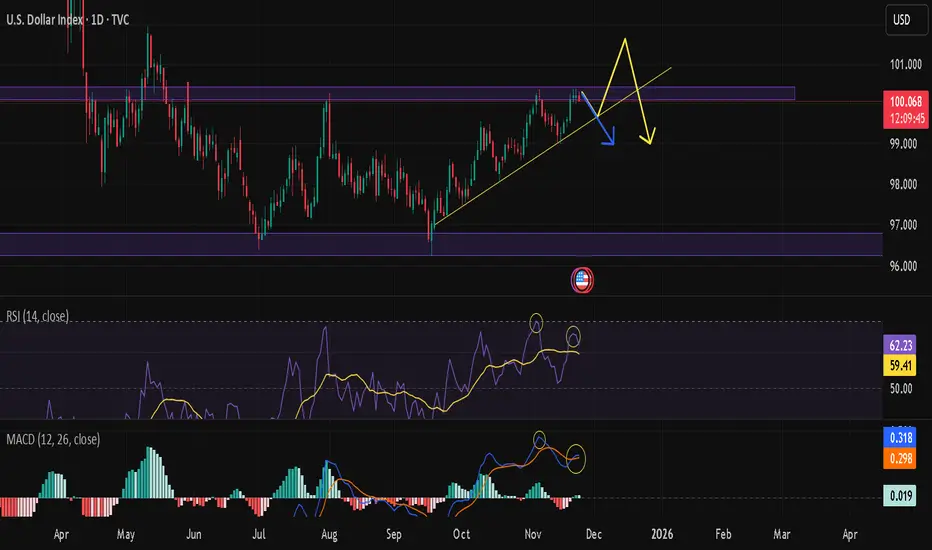
DXY at a KEY “Decision Point” on the Supply ZoneAfter an extended bullish duration, the DXY is now challenging a technically critical “Supply Zone” (100.150 – 100.600). Further away from key levels, both pump and dump up and down, momentum oscillators on all time frames give us mixed signals of exhaustion from buyers and that we are near to making a big decision in the direction of our market.
A comprehensive technical look that includes the broader structures and multi-month macroeconomic supply-demand analysis.
TECHNICAL OUTLOOK
Critical Resistance (Purple Zone): We are currently sitting right inside that 100.150 – 100.600 corridor. This is a level we know well—it’s packed with strong selling pressure and smart money order blocks. Think of this zone as a huge mental hurdle for the bulls; trying to go "Long" here without seeing a clean, high-volume breakout is just asking for trouble with a bad risk/reward setup.
Trend Structure: That ascending yellow trendline connecting the lows since September has been holding the price up so far. But look closer—the space between the price and this trend support is squeezing tight (Compression). This usually tells us one thing: volatility is kicking in and a big move is brewing.
Negative Divergence (RSI) : Here’s the warning sign. While the daily chart is trying to make new highs or just hanging on at resistance, the RSI is losing steam and making lower highs. This "Bearish Divergence" is a classic signal that the trend is running on fumes.
Momentum (MACD) : The MACD histogram is fading out, which confirms the bulls are getting tired. It hints that profit-taking—and the sellers taking over—is likely just around the corner.
MACROECONOMIC AND FUNDAMENTAL DYNAMICS
Fed Expectations : The market is scrambling to rethink the Fed's rate path for 2025. We are watching the data like hawks right now; even a small sign of cooling in jobs or PMI data could spark a rejection from this resistance and send the DXY correcting downwards.
Bond Yields : Any pullback in the US 10-Year Treasury Yields (US10Y) is going to add fuel to the fire for sellers on the Dollar Index.
Liquidity Hunt: Watch out for the "fakeout." Market makers might try to push the price just above that 100.600 level to grab liquidity and hunt the stops of early shorters before slamming it back down. Keep your eyes peeled on the Price Action here.
STRATEGY AND OUTLOOK
Since we are banging our heads against resistance, opening new long positions here just isn't juicy enough risk-wise.
Bearish Scenario: If we see a hard crash with volume breaking that ascending yellow trendline, that seals the deal for a reversal. If that happens, we’re looking at intermediate supports first, with the main target being that 96.50 level down low.
Bullish Scenario : Unless we get a solid daily candle close above 100.800, any rallies should be looked at as opportunities to sell. If the price stays above that level, then this idea is dead in the water.
Conclusion: It’s a "sit on your hands" moment. Waiting for that trend support to break is the safest confirmation we can get before jumping in.
Disclaimer : Just sharing my personal notes and educational analysis here, not financial advice.
DXY is making perhaps the final pull-back before a massive rallyThe U.S. Dollar index (DXY) has been trading within a Channel Up since the March 2008 bottom during the U.S. Housing Crisis. This is not the first time we use this pattern to identify key macro trend shifts, in fact we revisited it a little over 2 months ago.
The incredible symmetry it's been showing, with clear correction phases (red Channels) followed by bullish phases, eventually lead to price rallies to the 1.618 Fibonacci extension.
Right now the price is past a 1W Death Cross, which has always been a bottom signal on this multi-year Channel Up, and is pulling back on perhaps the final mini drop before the new 2-year Bullish Leg begins.
This has always happened at the end of the Bear Cycles (red correction phase) with the Arc pattern showing a final pull-back before the decisive rebound the breaks above the 1W MA50 (blue trend-line). That break-out is the confirmation of the Bull Cycle start (Bullish Leg).
With the 1M RSI having already touched its 16-year Support Zone, which has provided the most optimal Buy Signals throughout this pattern, we expect the Dollar Index to start rising aggressively in the long-term, targeting the 120.000 - 128.000 Zone on its way to the 1.618 Fib ext, which has been where the previous Higher Highs (Cycle Tops) were priced.
Notice also that a solid peak indicator (Sell signal) is when the 1M RSI hits 80.00, indicating that the market is massively overbought (overheated trend).
---
** Please LIKE 👍, FOLLOW ✅, SHARE 🙌 and COMMENT ✍ if you enjoy this idea! Also share your ideas and charts in the comments section below! This is best way to keep it relevant, support us, keep the content here free and allow the idea to reach as many people as possible. **
---
💸💸💸💸💸💸
👇 👇 👇 👇 👇 👇

DXY Analysis (4H Chart)DXY Analysis (4H Chart)
The US Dollar Index (DXY) has been in a steady downtrend, trading below both short-term EMAs, which shows weakening bullish momentum. Price has now dropped into a key support zone — an area where buyers previously stepped in.
At this level, two potential scenarios stand out:
1. Bullish Reaction (Green Path)
If buyers defend the support zone again, DXY could see a bounce toward the 21 EMA and potentially higher. This would signal short-term stabilization after the recent drop.
2. Break Below Support (Red Path)
If the support fails, the downtrend may accelerate, opening the door for a deeper move lower. This would confirm sellers maintaining strong control.
Summary
DXY is currently testing a major support zone.
Trend remains bearish while below EMAs.
Market may either bounce from support or extend the decline depending on upcoming momentum.

NZD USD long: live trade The recent theme (dovish FED re-pricing) continues, nudged along by another round of 'generally soft' US data. The overall mood remains positive and today, the USD JPY has downward momentum. I've therefore chosen the USD to short.
I've chosen the NZD to long as it's currently the currency with momentum, backed up by the recent RBNZ 'hawkish narrative'.
The risk to the trade is USD profit taking or fresh 'negative market sentiment'.

Bearish drop off?US Dollar index (DXY) has rejected off the pivot and could drop to the 1st support.
Pivot: 99.54
1st Support: 98.62
1st Resistance: 100.28
Disclaimer:
The opinions given above constitute general market commentary and do not constitute the opinion or advice of IC Markets or any form of personal or investment advice.
Any opinions, news, research, analyses, prices, other information, or links to third-party sites contained on this website are provided on an "as-is" basis, are intended to be informative only, and are not advice, a recommendation, research, a record of our trading prices, an offer of, or solicitation for, a transaction in any financial instrument and thus should not be treated as such. The information provided does not involve any specific investment objectives, financial situation, or needs of any specific person who may receive it. Please be aware that past performance is not a reliable indicator of future performance and/or results. Past performance or forward-looking scenarios based upon the reasonable beliefs of the third-party provider are not a guarantee of future performance. Actual results may differ materially from those anticipated in forward-looking or past performance statements. IC Markets makes no representation or warranty and assumes no liability as to the accuracy or completeness of the information provided, nor any loss arising from any investment based on a recommendation, forecast, or any information supplied by any third party.

BTC/USD on the 15-minute timeframe Neutral Chart InterpretationNeutral Chart Interpretation
This chart shows BTC/USD on the 15-minute timeframe, using several Exponential Moving Averages (EMA 7, 21, 50, and 9). The main focus appears to be on potential support zones and how price might behave around them.
1. Current Price Area
The price is moving sideways near the EMAs.
Multiple EMAs are close together, showing a short-term consolidation phase.
2. First Support Zone (S1)
A grey box highlights a nearby support area just below the current price.
The chart suggests that if price dips into this zone, it may stabilize before attempting another upward move.
3. Second (Stronger) Support Zone
A wider support region is marked lower on the chart.
This level appears to act as a stronger cushion if the market experiences a deeper pullback.
4. Upward Scenario (Green Arrows)
The chart shows an illustrated potential path where the price could rebound from one of the support zones and continue moving upward.
These arrows simply represent possible movement — not a prediction or signal.
5. EMA50 Highlight
The EMA50 label suggests that this moving average is being watched as a dynamic support during pullbacks.
Safe Posting Notes
This explanation avoids giving trade signals or recommendations.
It sticks to neutral chart interpretation only: price levels, zones, and market structure.

BTCUSD (15m) – Support Rejection & EMA RecoveryBTCUSD (15m) – Support Rejection & EMA Recovery
Bitcoin dropped into a key support zone and showed a strong rejection wick, signaling buyer interest. Price has now pushed back above the 7 EMA and is challenging the 21 EMA, which is the first sign of short-term momentum shifting.
Two possible outcomes from this area:
1. Bullish Scenario (Green Path)
If BTC holds above the support zone and continues reclaiming the EMAs, price may look for a short-term recovery toward the next intraday highs.
2. Bearish Scenario (Red Path)
If price fails at the EMAs and falls back below the support zone, continuation to the downside becomes more likely.
Summary
Strong support reaction.
EMAs acting as early momentum indicators.
Both bounce and breakdown are possible depending on how price behaves around 21 EMA.

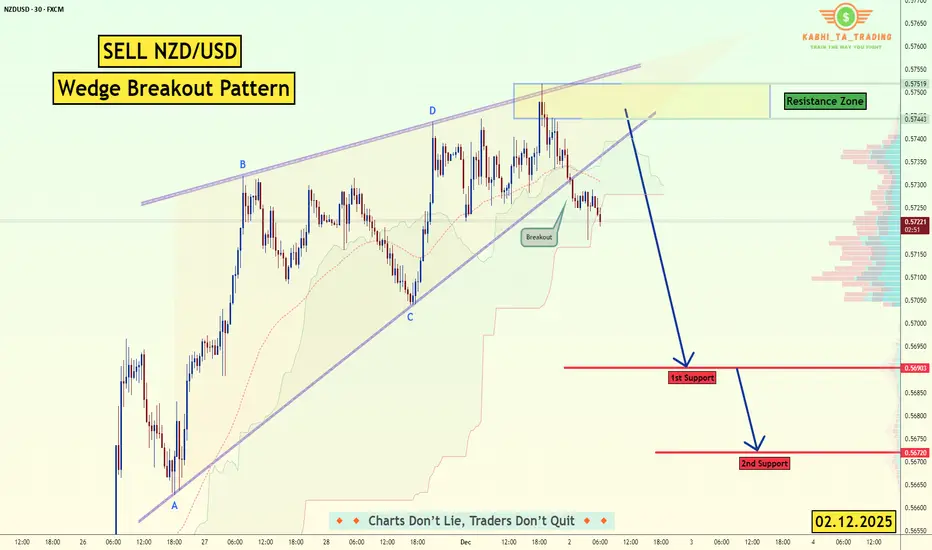
NZD/USD - Wedge Breakout (02.12.2025)📝 Description🔹 Setup Overview OANDA:NZDUSD
NZD/USD has broken below a Rising Wedge structure — a bearish continuation signal.
After retesting the lower trendline, price rejected sharply from the Resistance Zone, confirming seller strength.
Today’s fundamentals add further downside pressure, making this setup align with market sentiment.
📌 Trading Plan 📍 Bearish Scenario (Primary Plan)
Sell Opportunities: After retest of the broken wedge trendline.
Target 1: 0.5690 (1st Support)
Target 2: 0.5670 (2nd Support)
#NZDUSD #Forex #PriceAction #WedgePattern #BearishSetup #FXAnalysis #TradingView #TechnicalAnalysis #Fundamentals #USDStrength #ChartAnalysis #Kabhi_TA_Trading
⚠️ Disclaimer
This analysis is for educational purposes only — not financial advice.
Always manage your risk & use proper stop-loss levels.
👍 If you found this analysis helpful:
💬 Comment your views❤️ Like the post🔁 Share to support the work!