Potenial inverse head and shoulders pattern for Bitcoin This is the scenario I’m believing in for the near term for BINANCE:BTCUSD .
One more leg down to confirm the neckline around 78,300 USD.
Quick reversal price action to retest the 92,300 USD (ish) level.
If the breakout takes place to the upside, then I think we will retest the previous highs, with a higher probability of going much higher. Although I believe the tariffs will have a big impact on the USD (DXY index), which I believe will have a strong effect on BTC for the near term, around the coming 6 months. So, I believe the new high will most likely come in Q4 this year, making this cycle different from the historic crypto cycles. Although, there is still a chance that other countries will start to adopt more crypto-friendly policies for crypto or Bitcoin, making this thesis more uncertain. If the policies come out as positive, then I think there are good chances of reaching new highs earlier than Q4, 2025.
DJ FXCM Index

HERE IS USDJPY TRIANGLE PATTERNHello Guys Here Is Chart Of USDJPY in 4-H AT
Entry Level: SELL Around 148.800
Resistance: 149.300
Target Will Be : 146.800
This analysis assumes the price respects the Triangle Pattern.

Weekly FOREX Forecast Mar 24-28: Buy CAD, CHF, JPY vs USD!This is an outlook for the week of March 24 - 28th.
In this video, we will analyze the following FX markets:
USD Index
EUR
GBP
AUD
NZD
The USD Index is entering a Daily +FVG, which is nested in a Weekly +FVG. This is a bearish indication for the USD, which is a potential bullish situation for EURUSD, GBPUSD, AUDUSD and NZDUSD. This will be potentially bearish for the USDCAD, USDCHF, and USDJPY. Wait for the market structure shift going in the direction of your TP, and enter on the pullback.
Enjoy!
May profits be upon you.
Leave any questions or comments in the comment section.
I appreciate any feedback from my viewers!
Like and/or subscribe if you want more accurate analysis.
Thank you so much!
Disclaimer:
I do not provide personal investment advice and I am not a qualified licensed investment advisor.
All information found here, including any ideas, opinions, views, predictions, forecasts, commentaries, suggestions, expressed or implied herein, are for informational, entertainment or educational purposes only and should not be construed as personal investment advice. While the information provided is believed to be accurate, it may include errors or inaccuracies.
I will not and cannot be held liable for any actions you take as a result of anything you read here.
Conduct your own due diligence, or consult a licensed financial advisor or broker before making any and all investment decisions. Any investments, trades, speculations, or decisions made on the basis of any information found on this channel, expressed or implied herein, are committed at your own risk, financial or otherwise.

GBP/USD LONGHi !
Based on the current price action and I have prepared 2 trades for next week.
First is a long position from 1.287 where is VAL , price has respected this area, making it a good level for initiating a smaller long position with limited risk.
Forward I am looking at 1.3 area and looking to scaling in after confirmation above 1.302 ensures that I participate in the trend continuation without overexposing prematurely.
Step 1: Small Entry at 1.287
Entry: Long position at 1.287.
Stop Loss: Below 1.2800.
Take Profit: Partial profit near resistance at 1.3000, or hold until breakout confirmation.
Step 2: Scale In After Breakout
Entry Trigger: Wait for price action to break and hold above 1.302 (confirmed by strong candlestick close or volume spike).
Entry Price: Enter larger position at 1.302.
Stop Loss: Below recent breakout level (~1.295).
Take Profit Levels:
First Target: 1.3200.
Second Target: 1.3400.
FX:GBPUSD

EURUSD Channel Down bottomed. Short term buy.EURUSD is trading inside a (1h) Channel Down pattern, which just reached its bottom.
Last time that happened, the market rallied by 1.25%.
Trading Plan:
1. Buy on the current market price.
Targets:
1. 1.09200 (+1.25%).
Tips:
1. The RSI (1h) is trading on higher lows, which is a bullish divegernce in contrast to the price's lower lows. Standard bottom signal.
Please like, follow and comment!!

USDCAD Channel Down aiming for the 1D MA200.The USDCAD pair has been trading within a Channel Down and is currently around the 1D MA50 (blue trend-line) following its latest Lower High formation.
If the current Bearish Leg is as strong as the previous one, we can expect the price to hit at least the 1D MA200 (orange trend-line) at 1.4000.
-------------------------------------------------------------------------------
** Please LIKE 👍, FOLLOW ✅, SHARE 🙌 and COMMENT ✍ if you enjoy this idea! Also share your ideas and charts in the comments section below! This is best way to keep it relevant, support us, keep the content here free and allow the idea to reach as many people as possible. **
-------------------------------------------------------------------------------
💸💸💸💸💸💸
👇 👇 👇 👇 👇 👇


EUR USD Sell Continuation Setup EUR USD has formed a bearish break and retest pattern that also align with the 0.618 - 0.50 Fib Retracement level signaling a continuation of a downtrend.
EUR USD for sell ?

USDJPY DAILY ANALYSISHello traders here is my setup for USDJPY for the week as you can see the price has been on a down trend, and now you can see that the price have done a retracement and it is now on the level of structure that was recently broken and it is likely to act as resistance now I have to wait for confirmations like bearish engulfment then I would look to short the USDJPY.
NP: This is not a financial advice its just my prediction, what do you think?

DXY: Starting a new Channel Up rally into Summer.The U.S. Dollar Index is near the oversold zone on its 1D technical outlook (RSI = 37.232, MACD = -1.040, ADX = 33.922) having reached the bottom of the 9 month Channel Up. The 1D RSI was oversold last week but is seen rebounding. This is exactly the kind of formation we had on the previous bottom of the Channel Up as well as the December 28th 2023 low.. The selling sequences that led to those lose have been almost the same as today's (-6.32% and -5.74%). The last Channel Up bullish wave reached exactly the 1.618 Fibonacci extension. Consequently we can go long here with an acceptable risk, targeting the top of the Channel Up (TP = 113.000).
## If you like our free content follow our profile to get more daily ideas. ##
## Comments and likes are greatly appreciated. ##

gold on double retrace to sell#XAUUSD price have breakout new ATH, now we await for another retracment below 3030 for strong bearish.
Below 3030 have strong bearish zone that will continue the bearish till 3000-2997, stop loss at 3043.
But if price holds strong till correction at 3052 then possible bullish is expected to reach 3072.

USDJPY BEARISH CHART ANALYSIS IN 1-HHello Guys Here Is Chart Of USDJPY in 1-H AT
Entry Level: SELL Around 149.800
Resistance: 150.100
Target Will Be : 148.500
If USDJPY breaks upper resistance level, Then It went to go up more and setup invalid

$USINTR - U.S Interest Rates (March/2025)ECONOMICS:USINTR
March/2025
source: Federal Reserve
- The Fed keep the funds rate unchanged at 4.25%-4.5%,
but signaled expectations of slower economic growth and rising inflation.
The statement also noted that uncertainty around the economic outlook has increased, but officials still anticipate only two quarter-point rate reductions in 2025.

CAD JPY BUY Trade Setup 2 hour timeframe On the 2 hour timeframe CAD JPY has broken a key structure level forming a Higher high and higher low uptrend pattern, we need to wait for a retest of the higher low level for the completion of a Bullish Break and Retest pattern, also this level align with the Fib Retracement zone 0.618-0.50
Entry will be based off candlestick confirmation on the retest level.
Patience Patience ⏰👌🏻

EURUSD: Big Bearish Divergence on 4H.EURUSD is bullish on its 1D technical outlook (RSI = 66.538, MACD = -0.013, ADX = 29.911) but just crossed under the 4H MA50 for the first time since the March 3rd 2025 breakout when the parabolic rally started. The strongest sell signal is nonetheless given by the 4H RSI which, while the price is on a Channel Up, it has been on a Channel Down, i.e. a Bearish Divergence. The previous time an uptrend broke below its 4H MA50 on the same RSI Bearish Divergence was on the September 30th 2024 High. The result was a strong bearish breakdown to the S1 level. Consequently, we can turn bearish here and aim a little higher than S1 (TP = 1.0400).
## If you like our free content follow our profile to get more daily ideas. ##
## Comments and likes are greatly appreciated. ##

btc on bearish#BTCUSD price have been rejecting down below 82k multiple times, now we await for double breakout below 83735 to sell.
If price falls below 83735 then possible drop below 82k will occur which will form new zone for bearish, stop loss at 84700.
Above the rectangle holds bullish if the H1 candle closes above.

Gold at $3,000: The Ultimate Panic Buy or Just Another Bubble? 💰 Gold Hits Record Highs – Because the World is on Fire 🔥
Ah, gold—humanity’s favorite panic button. As of March 2025 , gold prices have skyrocketed past $3,000 per ounce . Why? Because the world can’t go five minutes without a crisis. 🌍💥
Trade wars? Check.
Geopolitical conflicts? Check.
The eternal struggle between "experts" predicting doom and moonboys screaming ‘buy the dip’? Check.
With the U.S. economy wobbling like a Jenga tower after a few tequila shots and global uncertainty at an all-time high, investors are piling into gold like it’s the last lifeboat on the Titanic. 🚢💨
🏦 Central Banks: The Ultimate Gold Hoarders
If you think you have a gold addiction, meet central banks. These guys have been buying over 1,000 metric tons per year —basically turning their vaults into dragon lairs. 🐉💰
Why? Because they definitely trust fiat currencies… just not enough to NOT hedge against their own policies. 😏
China, India, and Turkey are leading the charge, stacking gold like it’s a limited edition NFT.
The logic? If everything goes to hell, at least they’ll have something pretty to look at.
📈 What Do the ‘Smart People’ Think? (Spoiler: They Don’t Agree 🙄)
Let’s check what the big banks are saying—because if there’s one thing banks are great at, it’s being consistently wrong with their predictions.
JP Morgan Private Bank is feeling "constructive" about gold. Which is just a fancy way of saying "Eh, we have no clue, but it looks good." They think potential Fed rate cuts could send gold higher. 🚀
VanEck highlights how central banks and investors drove gold to new highs in 2024. Basically, everyone’s running for cover while pretending it’s a “strategic allocation.”
🤔 Should You Buy Gold or Just Watch the Chaos?
Pros: You get a shiny rock that everyone suddenly cares about during a crisis. 🌟
Cons: No dividends, no passive income, and you basically just hope some sucker will pay more than you did. 😬
Gold is a great hedge when the world is melting down, but let’s not pretend it’s some magical wealth generator. If you’re buying, just make sure it’s not because your Uber driver said it’s "going to the moon." 🚀🌕
(Not financial advice. But definitely sarcastic advice. 🤷♂️)
If you want the deeper breakdown (the one nobody’s telling you), drop a comment or DM me. Maybe I’ll let you in on the real insights. 👀🔥

If you don't have DXY, keep an eye on USDCHF.Today we are waiting for the Federal Reserve interest rate decision, where the Bank is expected to keep the rates unchanged. However, it's the press conference, which we are more bothered about. Keep your eyes on TVC:DXY , but if you don't have MARKETSCOM:DOLLARINDEX , then MARKETSCOM:USDCHF will be just as good.
Let's dig in.
FX_IDC:USDCHF
Let us know what you think in the comments below.
Thank you.
74.2% of retail investor accounts lose money when trading CFDs with this provider. You should consider whether you understand how CFDs work and whether you can afford to take the high risk of losing your money. Past performance is not necessarily indicative of future results. The value of investments may fall as well as rise and the investor may not get back the amount initially invested. This content is not intended for nor applicable to residents of the UK. Cryptocurrency CFDs and spread bets are restricted in the UK for all retail clients.

USDJPY EA MAN UPDATE > READ THE CHAPTIAN Key Observations:
Resistance Level: The price is testing a key resistance zone around 150.026, where selling pressure could emerge.
EMA Confluence: The price is currently above both the 30 EMA (149.639, red) and 200 EMA (149.339, blue), indicating an overall bullish trend.
Projected Bearish Move: A rejection from the resistance zone could lead to a pullback towards the 149.117 support level, aligning with the potential short-term bearish scenario.
If price fails to break above the resistance and starts forming lower highs, a move towards the target point at 149.117 could unfold.

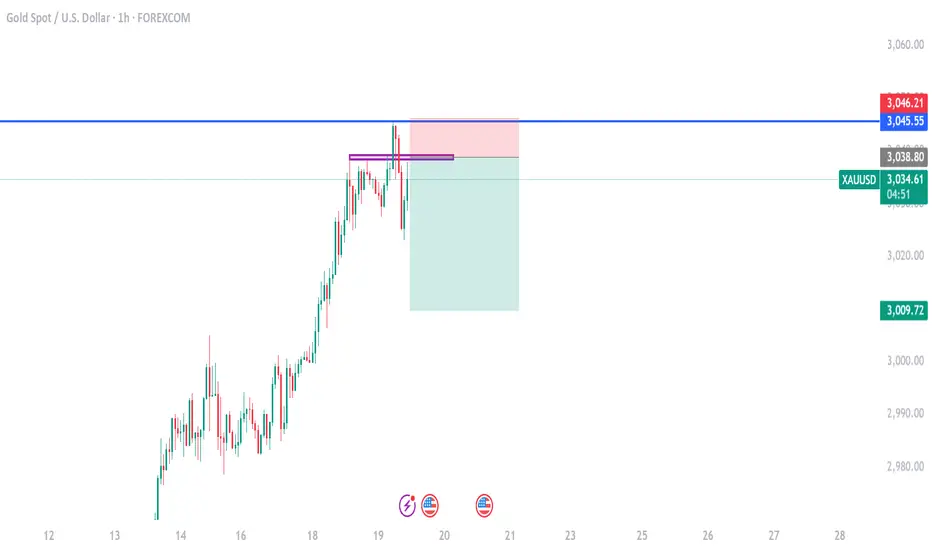
gold on bearish#XAUUSD price have successful reached 3040-3045 yesterday target on buy, now price is forming a new range.
Another breakout which will touch the rectangle 3038-3039 holds a strong rejection which will drop the price back 3009, Stop loss at 3046.
Above the ATH 3045.5 holds a strong bullish continuous to reach 3056 or more.
GOOGL, Short, 1D✅ GOOGL broke the key support at 166.25, confirming bearish momentum. The price is expected to decline further toward the next key support at 149.50.
SHORT 📉
✅ Like and subscribe to never miss a new analysis! ✅

USD/CHF: Bearish Continuation Towards Key SupportUSD/CHF has maintained a strong bearish trend, forming a series of lower highs and lower lows. The chart highlights a **Deep Crab** harmonic pattern, which previously triggered a corrective move before resuming its overall downtrend.
Currently, price action is trading near **0.8767**, approaching a key support zone at **0.8722** (HOP level). The recent rejection from the **H4 supply zone** around **0.8920** further confirms bearish momentum, suggesting sellers remain in control.
**Key Considerations:**
- A breakdown below **0.8722** could accelerate further downside, extending losses towards lower psychological levels.
- A potential pullback may occur if buyers step in at support, but the overall bearish structure remains intact unless a significant reversal signal appears.
**Conclusion:** USD/CHF remains under bearish pressure, with a high probability of further declines. Traders should monitor price action at support for potential continuation or reversal signals before committing to new positions.

GBP/USD: ID50 Setup Bullish Trade Opportunity1. **ID50 Setup Formation:**
- The market appears to have formed a **peak formation low**, followed by a reversal into an upward trend.
- The price retraced to the **50 EMA (blue line)**, which aligns with the **ID50 trade entry zone** in BTMM.
- A bounce off this moving average suggests **bullish continuation**.
2. **Market Structure & Momentum:**
- Higher highs and higher lows are evident, confirming an uptrend.
- The **red EMA (13 EMA)** remains above the **50 EMA**, reinforcing the bullish sentiment.
- Price recently tested the **50 EMA support**, indicating a potential **buying opportunity**.
3. **Key Levels to Watch:**
- The nearest **resistance zone** is around **1.29700**, which might serve as the next target.
- Support is currently around **1.29000**, aligning with the 50 EMA.
**Conclusion:**
If the price maintains support above the 50 EMA, the **bullish ID50 setup** suggests a continuation of the uptrend. A break above recent highs could lead to further gains. However, traders should watch for potential **stop hunts** before a strong move occurs.
