CORE5 WEEKLY WARMAP — 1 DECEMBER 2025The market opens the week with the dollar locked inside a well-defined range between 97.67 and 99.98. Price is sitting near the mid-zone around 98.60, showing no structural breakout. Until one of these levels is taken out with conviction, this is a rotation environment, not a trend environment.
Yields continue to firm. The 10-year is up about 1.63 percent and the 2-year roughly 1.66 percent. Higher yields paired with a rangebound dollar create a more selective backdrop for risk assets. ES holds strength inside its upper band, but rising volatility signals a shift toward more two-way movement. Gold liquidated last week’s high and remains in a two-month bullish range. Across the six-chart grid, the underlying message is the same: strength on the surface, tension underneath.
The calendar is dense. ISM Manufacturing, ADP employment, ISM Services, trade balance, consumer credit, Michigan sentiment, and the full employment situation report arrive in a tight cluster. Each print feeds directly into expectations for the Fed’s December path.
Through the CORE5 lens, the dollar’s range defines the entire week. Market Structure confirms a rotation box. Dynamic Geometry shows price in discount, favoring fast intraday swings rather than smooth trends. Volume Flow flipped bearish last week after failing the bullish daily range, turning prior volume shelves into supply. Order Flow across FX pairs remains bullish, removing justification for blind shorting of risk assets. Execution must stay high-frequency, level-to-level, and based on clear confirmation.
The weekly thesis is direct: markets are being driven by firm yields and a heavy sequence of U.S. data. This is a reaction-driven week, not a predictive one. Intraday rotations offer more clarity than directional conviction.
The takeaway: the dollar remains inside its box, yields are firm, and volatility is rising. Treat every level as a behavior test. Trade the rotations, not your opinions.
— CORE5DAN
Institutional Logic. Modern Technology. Real Freedom.
DJ FXCM Index

EURUSD Channel Up peaks on this trend-line?The EURUSD pair has been trading within a 10-day Channel Up and is currently on its 2nd Bullish Leg. Both previous rallies since October got rejected on the Lower Highs trend-line shown on the chart.
With the 1H RSI already overbought, we expect the Channel Up to peak there again and make at least a -0.50% pull-back. Our Target is 1.15900.
---
** Please LIKE 👍, FOLLOW ✅, SHARE 🙌 and COMMENT ✍ if you enjoy this idea! Also share your ideas and charts in the comments section below! This is best way to keep it relevant, support us, keep the content here free and allow the idea to reach as many people as possible. **
---
💸💸💸💸💸💸
👇 👇 👇 👇 👇 👇

USD/JPY - H4 - Breakdown Watch!(29.11.2025)📝 Technical Description FX:USDJPY
USD/JPY has been moving inside a clean ascending channel on the H4 timeframe.
Price is now sitting inside the Reversal Zone, struggling to break above the channel’s mid-line resistance. A bearish correction is possible if the market fails to reclaim the upper zone.
This setup remains a pending order, and requires confirmation before execution.*
📊 Trading Plan (My View)🔻 Bearish Scenario (Primary Setup)
If price rejects the Reversal Zone, expect a bearish channel breakdown.
Target a correction toward the key support zones shown on the chart.
🎯 Key Levels
Reversal Zone: 156.300 – 156.500
Support Zone (Target): 153.093
⚠️ Today’s Fundamental Updates – 29 Nov 2025
1️⃣ Bank of Japan Policy Sentiment Shifts
BoJ Governor Ueda hinted that an interest rate increase may come sooner,
as the government boosts spending to stimulate the economy.
➡ This generally strengthens the JPY, increasing downside pressure on USD/JPY.
2️⃣ US Dollar Weakness Drivers
Rising expectations of rate cuts from the Federal Reserve.
Treasury yields softening due to recession worries.
➡ A weaker USD supports the bearish setup on USD/JPY.
📌 Summary
Strong channel resistance + bearish fundamentals on USD → JPY
= High-probability reversal correction setup once confirmation appears.
⚠️ Wait for breakout confirmation before entering.
⚠️ Disclaimer
This analysis is for education only.
Not financial advice. Always trade with proper risk management.
❤️ Support the Work
If this analysis helped you,👉 Please LIKE 👍 & COMMENT 💬
Your support motivates me to post more high-quality setups daily!
#usdjpy #forex #forexanalysis #priceaction #channelpattern #technicalanalysis
#fxsignals #tradingview #chartanalysis #jpy #boj #fundamentals #usdweakness #reversalpattern

Forex: Weekly Review It was very pleasing that, by and large, the week starting Monday 24 November was a 'risk on' week.
Following on from the 'WILLIAMS' comments the previous Friday, the positive mood was enhanced by some 'goldilocks' US data on Tuesday. And the 'risk on sentiment' remained for the rest of the week, briefly taking a pause during Thanksgiving. But returning for a final flourish on Friday.
Given how difficult the past few months have been, this week's 'narrative and price action' was comforting and encouraging , trading is much more straightforward when the overall mood is positive and I begin the new week continuing my bias for 'risk on' trades.
But it should be noted that it would only take some 'hot US data', or a 'hawkish comment' for the uncertainty to return. And that's without mentioning anything the BOJ or President Trump could send our way. And as ever I'll be keeping any eye on the VIX and the S&P along with keeping up to speed with the narrative.
In other news, the AUD, NZD and GBP had 'good weeks', obviously boosted by the positive environment but also their own fundamentals, 'hot' AUD CPI, a 'hawkish cut' from the RBNZ and the UK budget appeased GBP sentiment.
It's a slow process but peace in the UKRAINE creeps ever closer (EUR and GBP positive) and finally, 'hot GDP' boosted the CAD on Friday, it could well be that (similar to NZD) front loaded rare cuts are filtering through to the economy.
On a personal note, it was a week of two trades, both 'risk on' and both short USD. A EUR USD on Tuesday, post US data. And a GBP USD post UK budget. It is pleasing there could have actually been another trade or two in there. And any trade could have been any type of risk on concoction.
I unfortunately missed Friday due to (once again) out of the blue uncle John duties. Not to get too personal but I have a nephew who has down syndrome and autism and I'm happy to shoulder some if his care when it's required.
I begin the new week feeling a little more emboldened than the previous couple of months. But it is prudent to be aware that anything can happen at any moment to flip the narrative in its head.
Let's see what December brings.

USD - A Month of Resistance at Prior SupportThe 100.22 level continues to be a massive spot on the DXY chart. Bulls have been in control ever since the Fed started cutting rates in September and that's similar to last year. But, unlike last year, buyers haven't been able to extend the breakout as its been a more grinding affair so far this Q4. Notably, however, bulls aren't yet out of it.
The 100.22 level first came back into play on August 1st before reversal showed around the NFP release. But it was back in the picture in early-November. At the time, EUR/USD had started to re-test the 1.1500 handle and GBP/USD had plunged with its weakest RSI read on the daily chart in more than two years.
But in DXY, support held at a major spot - 98.98, which is the 61.8% Fibonacci retracement of the 2021-2022 move. This led to another bounce and another test of 100.22.
For this round, the level was tested for five consecutive days into this week, until sellers were finally able to provoke pullback. But, so far, bears haven't been able to get below the recent higher-low so there's still a claim to bullish structure on the daily, and that aligns well with the bearish backdrop on daily EUR/USD.
For shorter-term support, we're seeing a familiar level back in the mix at 99.40, helped to set the highs back in June.
If looking for USD-weakness, GBP/USD can be compelling. For USD-strength, USD/JPY is more attractive currently. And for both EUR/USD and USD, it's that 1.1500 level in the major pair that stands out as significant. - js

DXY bottomed and is starting the new Bullish Leg.The U.S. Dollar index (DXY) has been trading within a Channel Up since the October 01 Low last week even broke above its 1D MA200 (orange trend-line) for the first time since March 05 2025.
Technically, that is confirmation for the long-term continuation of the uptrend. As long as the 1D MA50 (blue trend-line) holds, we expect DXY to start the new Bullish Leg of the Channel Up as yesterday it hits its bottom.
There is a high symmetry between the last three Bullish Legs but since the 'weakest' one has been +2.17%, we have a Target at 101.100. As you can see, that would even test the 1W MA50 (red trend-line), which is the natural long-term Resistance of the market.
Notice also the 1D RSI bounce on its 2-month Support Zone as well as the just formed Bullish Cross on the 4H MACD. All perfectly aligned with bottom formations signaling buy opportunities.
---
** Please LIKE 👍, FOLLOW ✅, SHARE 🙌 and COMMENT ✍ if you enjoy this idea! Also share your ideas and charts in the comments section below! This is best way to keep it relevant, support us, keep the content here free and allow the idea to reach as many people as possible. **
---
💸💸💸💸💸💸
👇 👇 👇 👇 👇 👇

GBP/USD - Next stop @ 1.3300 ?The GBP/USD pair has broken out of a well-defined symmetrical triangle on the M30 timeframe. FX:GBPUSD
🔍 Technical Breakdown
📈 Triangle Breakout confirmed with bullish momentum
🟩 Key Bullish Targets marked above, aligned with previous liquidity zones
🟥 Demand / Re-Entry Zone highlighted below — potential retest area
📊 EMA structure supportive of upward continuation
🎯 Expecting a measured move continuation if price holds above breakout zone
⚠️ Disclaimer
This chart is for educational purposes only and not financial advice.
Always do your own analysis and manage risks properly. Trading involves significant risk of loss.
👍 Support the Analysis If you found this helpful:
❤️ Leave a like
💬 Drop a comment
🔁 Share your viewpoint below
Your support motivates me to post more setups like this!

Trading quiet markets: General rule of thumbAs North America celebrates Thanksgiving, US stock and bond markets are closed. The currency market continues as normal.
'In general' a good rule of thumb in quiet markets is that 'movent continues in the prevailing direction'. Although likely very slowly.
It is very pleasing that the recent 'risk on sentiment' and the currencies behaving as you would expect, has continued.
I wouldn't blame anyone for placing a risk on trade today, in fact, overall sentiment and currency movement invites a trade. (AUD USD long for example).
Personally, I prefer to wait until liquidity picks up again, which for me, means waiting until at least Friday's European session.
I realise it is easier to sit on the sidelines with two trades under my belt this week.
If you are trading, it is prudent to be aware that some platforms 'widen spreads' in quiet times.

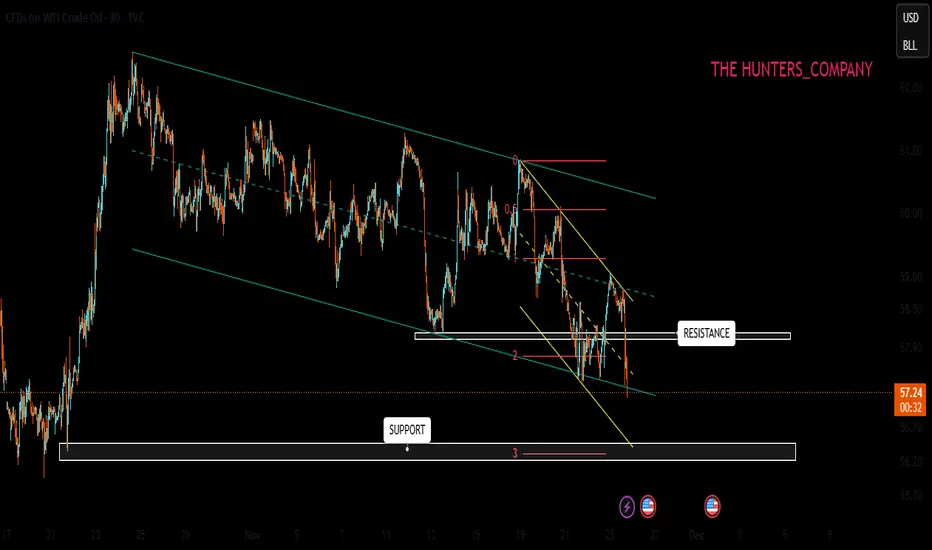
USOIL : Full analysisHello friends
Well, you see that we have a descending channel in which the price is moving, and considering that the price reached the ceiling of the channel, we had a Sharpe decline, and now it seems that the sellers want to break the channel, and the first support identified could be the buyers' stronghold, where we need to see if they support the price or not.
If they support, there is a significant resistance in their way. This area is full of sell orders and can naturally correct the price. In this regard, breaking this resistance is very important and vital for price growth.
Now what if the buyers cannot support the price in the support area and the price falls further?
Well, we need to find areas again for a sell trade because if the descending channel is broken, the fall will be heavier and it is better to move with the trend.
This analysis is purely technical and is not a buy or sell recommendation.
*Trade safely with us*
Bullish bounce off?US Dollar Index (DXY) is reacting off the pivot, which acts as a pullback support and could bounce to the 1st resistance.
Pivot: 99.54
1st Support: 98.89
1st Resistance: 101.35
Disclaimer:
The opinions given above constitute general market commentary and do not constitute the opinion or advice of IC Markets or any form of personal or investment advice.
Any opinions, news, research, analyses, prices, other information, or links to third-party sites contained on this website are provided on an "as-is" basis, are intended to be informative only, and are not advice, a recommendation, research, a record of our trading prices, an offer of, or solicitation for, a transaction in any financial instrument and thus should not be treated as such. The information provided does not involve any specific investment objectives, financial situation, or needs of any specific person who may receive it. Please be aware that past performance is not a reliable indicator of future performance and/or results. Past performance or forward-looking scenarios based upon the reasonable beliefs of the third-party provider are not a guarantee of future performance. Actual results may differ materially from those anticipated in forward-looking or past performance statements. IC Markets makes no representation or warranty and assumes no liability as to the accuracy or completeness of the information provided, nor any loss arising from any investment based on a recommendation, forecast, or any information supplied by any third party.

GBP/USD — Bearish Outlook Toward 1.26867GBP/USD remains under sustained bearish pressure after failing to hold above the key structural levels at 1.34825 and 1.33906. These two resistance zones now define the upper boundary of the broader downtrend, confirming that sellers remain in control.
Price is currently moving within a corrective phase, and any recovery attempt below these key levels is expected to face renewed selling interest. The bearish continuation scenario remains valid as long as the pair stays capped below 1.33906.
The next major objective for bears is the downside target at 1.26867, corresponding to the 1.0 Fibonacci extension and the final completion zone of the current corrective wave.
A break below intermediate supports—1.31642, 1.30846, and 1.29907—will accelerate momentum toward the target.
Key Levels
Major Resistance: 1.34825
Secondary Resistance: 1.33906
Intermediate Supports: 1.31642 • 1.30846 (50%) • 1.29907 (0.618)
Final Downside Target: 1.26867

GBP USD long: 'risk on' tradeWhisper it quietly but I'm very quietly enthused by this week's 'price action'. Following on from the WILLIAMS speech on Friday, US data and the overall narrative (FED cuts are coming) continues the 'risk on' theme.
The market appears to like the UK budget, therefore I've entered GBP USD long.
Any concoction of 'risk on' trade is arguably viable, particularly long AUD (hot CPI) or NZD (hawkish cut).
Plus the JPY is showing itself as a short option.
GBP USD has made a new (recent) daily high and for better or worse I've made my choice.
The risks to the trade are 'thanksgiving lull', no considerable 1hr swing for a stop loss. Or 'out of the blue' negative market sentiment.
Once again, it is a trade I will hold through market close if necessary.
Wishing our North American friends a fantastic Thanksgiving.

USDCAD starting a massive 2-year rally.The USDCAD pair has been trading within a Channel Up since the May 31 2021 market bottom. In recent weeks it broke above its 1W MA50 (blue trend-line) following a June 16 2025 Higher Low, just above the 1W MA200 (orange trend-line), which has been holding as the natural Support since September 2022.
Given the potential peak on the 1W CCI and the similarities with the previous Higher Low bottom formations, we expect the pair to start the new long-term Bullish Leg. With the previous two Bullish Legs rising by at least +13.00%, we anticipate the price to reach 1.53000 within 2 years time.
---
** Please LIKE 👍, FOLLOW ✅, SHARE 🙌 and COMMENT ✍ if you enjoy this idea! Also share your ideas and charts in the comments section below! This is best way to keep it relevant, support us, keep the content here free and allow the idea to reach as many people as possible. **
---
💸💸💸💸💸💸
👇 👇 👇 👇 👇 👇

EUR/USD – H1 Wedge Breakout |Bullish Momentum Targeting 1.1600📌 Setup Overview FX:EURUSD
EUR/USD has broken out of a falling wedge on H1, signalling a potential bullish trend reversal.
Price has reclaimed the Ichimoku cloud — now acting as support, showing fresh buyer strength.
• Pattern: Wedge Breakout Pattern
• Timeframe: H1 Chart
• Bias: Bullish
• Reason for setup: Breakout & Retested
🎯 Trading Plan
• Entry idea: Retest of breakout zone for confirmation before continuation
• TP1: 1.15886 (1st Resistance)
• TP2: 1.16148 (2nd Resistance / liquidity sweep zone)
🧠 Fundamental Drivers
1️⃣ 80% probability the Federal Reserve cuts rates in December → weaker USD supports bullish EUR/USD
2️⃣ Upcoming high-impact data to watch:
• EUR – German GDP
• USD – Core PPI
• USD – Retail Sales
Fundamentals currently favour bullish EUR side, with USD losing momentum.
#EURUSD #forex #forexanalysis #priceaction #chartanalysis #technicalanalysis #fundamentalanalysis #tradingview #supportandresistance #smartmoney #breakout #wedgebreakout #ichimokucloud #marketstructure
📌 What to expect
Break/retest continuation structure suggests 1.1588 is the first magnet.
If momentum remains strong, price could extend to 1.1614 liquidity zone.
🔖 SAVE this post so you don’t miss the update when levels hit.
👍 LIKE if you want more Wedge & Breakout setups.
⚠ Disclaimer:
Trade for education/study only. Manage risk according to your own system.

GBPUSD: Liquidity Grab off 1.31000CRT suggests Pound/Dollar could drop further below 1.31000, however, is there enough bearish momentum to keep it dropping? With wicks to the bottom that Liquidity Grab could experience a pullback, maybe back towards the POI it created whilst dropping.

DXY 7mo rounding bottom -- more gains likelyEarly 2025 saw a nasty TVC:DXY drawdown; one of the worst starts for the Dollar against foreign currencies in decades.
Despite bearish calls for the Dollar to drop significantly further it's been consolidating at the bottom of a long standing 19 year upward trend channel.
On the daily chart featured above, there's now a clear rounding bottom on TVC:DXY over the past 7+ months, with a clear, sharp uptrend in momentum right along the way.
The risk is to the upside imo.

EUR USD longSoft' US data accross the board continues the 'post WILLIAMS narrative'. Maybe the FED do need to be more dovish than the market has anticipated?
It's a short USD trade, I've chosen the EUR to long as it is the currency with the current momentum.
The risk to the trade is the world we live in and the narrative couple flip back at any moment. Plus, as is becoming increasingly common, there is no 'solid swing' to place a stop loss behind.
This is a trade I will hold overnight if necessary.

USD/JPY – Bearish Flag Breakdown (25.11.2025)📝 Description 📌 Setup Overview FX:USDJPY
USD/JPY has completed a Bearish Flag on the M30 timeframe and price has now broken below the flag support with momentum.
The Ichimoku Cloud is acting as resistance, showing sellers stepping in again after a short pullback.
📉 Bias: Bearish continuation📍 Pattern: Bear Flag (Breakout confirmed)
🎯 Trading Plan
• Entry idea: After a clean breakout & retest confirmation below the flag base zone
• TP1: 156.055 (1st Support)
• TP2: 155.622 (2nd Support)
• SL suggestion: Above 157.000 (invalidates breakdown)
• RR potential: 1:2 — 1:3 depending on entry
🧠 Why this move makes sense
1️⃣ Price rejected Ichimoku cloud + structure resistance
2️⃣ USD weakness continues after recent pullback
3️⃣ JPY demand increases as risk sentiment cools ahead of key macro events
📌 What to expect
If price retests the flag support from below and rejects again, bearish momentum could accelerate toward 156.05 → 155.62.
💬 Your turn
Which target will hit first in your view — TP1 or TP2?
👇 Comment below — I reply to all comments.
🔖 SAVE this post so you don’t miss the trade update.
👍 LIKE if you want more Bear Flag & Triangle setups.
⚠ Disclaimer: For educational purposes only. Not financial advice. Trade based on your plan & risk management.
#USDJPY #forex #bearflag #priceaction #tradingview #technicalanalysis #chartanalysis #forexanalysis #ickycloud #supportandresistance #forextrading #marketstructure #smartmoney

EURUSD Last bounce before a Lower Low.The EURUSD pair continues to trade within its 2-month Channel Down and following the start of the latest Bearish Leg since the November 13 Lower High rejection on the 1D MA50 (blue trend-line), we are now experiencing the first consolidation phase.
Based on the previous Bearish Legs of this pattern, this consolidation could end up in a short-term rebound limited by the 0.786 Fibonacci retracement level, only for it to be rejected and resume the bearish trend.
Both previous rejections eventually made a Lower Low for the Channel Down, hitting the -0.618 Fibonacci extension (minimum), declining in total Bearish Leg terms by at least -2.03%.
As a result, our 1.14200 medium-term Target (still above both conditions) remains valid, but we will close it earlier if we see the price hit the 1D MA200 (orange trend-line) and fail to close the 1D candle below it.
---
** Please LIKE 👍, FOLLOW ✅, SHARE 🙌 and COMMENT ✍ if you enjoy this idea! Also share your ideas and charts in the comments section below! This is best way to keep it relevant, support us, keep the content here free and allow the idea to reach as many people as possible. **
---
💸💸💸💸💸💸
👇 👇 👇 👇 👇 👇

DXY Market NoteThe U.S. Dollar Index (DXY) is consolidating within a narrow range of 100.00–100.40, a level worth monitoring for directional clarity.
At the same time, price is sitting just below a previous daily order block (OB), which acts as a supply zone. This area could cap further upside in the short term unless buyers show strong momentum to break through.
Key scenarios to watch:
Bullish breakout above 100.40 → signals continuation higher, but must overcome supply from the daily OB.
Failure to hold 100.00 → opens risk of deeper retracement toward lower support zones.
Rejection at the daily OB → could reinforce range-bound behaviour or trigger a pullback.
In summary, DXY is at a pivotal point: the weekly chart hints at strength, but the nearby daily supply zone demands caution. Waiting for confirmation, either a clean breakout or rejection will provide clearer direction.
⚠️ Disclaimer ⚠️This journal entry is for educational and documentation purposes only. It does not constitute financial advice or a recommendation to trade. All trading involves risk, and past performance does not guarantee future results. Always conduct your own analysis and consult with a licensed financial professional before making trading decisions.

Bullish continuation setup?US Dollar Index (DXY) could fall to the pivot which acts as a pullback support that lines up with the 38.2% Fibonacci retracement and could bounce to the 1st resistance, which is a multi-swing high resitance.
Pivot: 99.80
1st Support: 99.53
1st Resistance: 100.35
Disclaimer:
The opinions given above constitute general market commentary and do not constitute the opinion or advice of IC Markets or any form of personal or investment advice.
Any opinions, news, research, analyses, prices, other information, or links to third-party sites contained on this website are provided on an "as-is" basis, are intended to be informative only, and are not advice, a recommendation, research, a record of our trading prices, an offer of, or solicitation for, a transaction in any financial instrument and thus should not be treated as such. The information provided does not involve any specific investment objectives, financial situation, or needs of any specific person who may receive it. Please be aware that past performance is not a reliable indicator of future performance and/or results. Past performance or forward-looking scenarios based upon the reasonable beliefs of the third-party provider are not a guarantee of future performance. Actual results may differ materially from those anticipated in forward-looking or past performance statements. IC Markets makes no representation or warranty and assumes no liability as to the accuracy or completeness of the information provided, nor any loss arising from any investment based on a recommendation, forecast, or any information supplied by any third party.

USD Cup and Handle x2The 100-100.22 zone in DXY is a familiar one...
The latter price set the low in Q3 last year, just before the USD reversal took over, and it was back in-play as the high in August 1st of this year.
More recently, that price has held the highs earlier in November and then for the past few trading days and as yet, sellers haven't been able to take over.
The door is open for bullish breakouts in DXY and the big component of that is the 1.1500 handle in EUR/USD. If the Euro can finally get below that psychological level, the door is open for USD breaks.
The challenge then becomes the Yen, as a push up to or at least close to the 160.00 level in USD/JPY will probably elicit another intervention threat from the MoF.
Shorter-term, there's another cup and handle that's built from those recurrent resistance tests at 100.22. - js

AUD/USD – Fundamentals Driving Downtrend | 24.11.2025Bearish Channel + Rate-Cut Expectation Pressure = Downside Continuation Setup
🔍 Technical Setup
AUD/USD continues to trade inside a falling channel, respecting the trendline resistance (multiple rejections marked). Price is currently moving toward the resistance zone, offering a potential sell-on-retest opportunity before further downside.
📌 Bias remains bearish as long as price stays below the channel resistance + Ichimoku cloud.
🎯 Trading Plan :
📌 Targets (Support Levels):
1st Support: 0.64130
2nd Support: 0.63912
📌 Invalidation / Risk:
A breakout above 0.6480 would reduce bearish bias.
⚠️ Today’s Fundamental Drivers :
1️⃣ Rate-cut expectations surged:
Markets now price 69% chance of a December rate cut, up from 44% last week → weakens AUD.
2️⃣ New York Fed statement shook sentiment:
Fed official highlighted weak job market as a bigger risk than high inflation, increasing probability of monetary easing → USD firming vs risk currencies like AUD.
➡️ When fundamentals + technical trend align, continuation move is likely.
AUDUSD analysis, AUD/USD forecast, AUDUSD sell setup, Forex signals, Australian dollar outlook, Rate cut impact on forex, AUD technical analysis, price action strategy
⚠️ Disclaimer
This chart is for educational purposes only — not financial advice.
Always manage risk and follow your own trading plan.
❤️ Support the Analysis
If you found this helpful — LIKE 👍 & COMMENT 💬
Your support motivates more daily high-quality chart setups!
