EURUSD could target 1.0300 if this level breaks.The EURUSD pair has been trading within an 11-year Channel Down and has found itself on a 2-month pull-back currently ever since the September 17 2025 market High.
Technically that was a Lower High for this long-term pattern and was formed while the 1W RSI has been on Lower Highs, against the price's Higher Highs, which is a huge Bearish Divergence.
This is the same kind of divergence that was present during the Channel's last two Lower Highs in January 2021 and February 2018. Both tops initiated Bearish Legs that got confirmed when the price broke below its 1W MA50 (blue trend-line).
On both occasions, the price hit at least the 0.618 Fibonacci retracement level of the Channel Down, declining by at least -15.25%.
As a result, if the 1W MA50 breaks again, being the market's last Support, we expect EURUSD to target at least 1.0300.
---
** Please LIKE 👍, FOLLOW ✅, SHARE 🙌 and COMMENT ✍ if you enjoy this idea! Also share your ideas and charts in the comments section below! This is best way to keep it relevant, support us, keep the content here free and allow the idea to reach as many people as possible. **
---
💸💸💸💸💸💸
👇 👇 👇 👇 👇 👇
DJ FXCM Index

USD/CHF - Trendline Rejection (10.11.2025)📊 Setup Overview : FX:USDCHF
USD/CHF continues to respect the descending trendline and Ichimoku cloud resistance, signaling potential downside pressure. Price is currently retesting the resistance zone (0.8070–0.8085) — a strong supply area that has rejected multiple times.As long as this zone holds, we expect a move toward the next support zones.
🧭 Trade Plan
Bias: 🔻 Sell / Short-term Bearish
Entry Zone: 0.8060 – 0.8080 (wait for confirmation candle or rejection)
Target 1 (1st Support): 0.8015
Target 2 (2nd Support): 0.7995
Invalidation: Break and close above 0.8085 (Resistance Zone)
⚡ Fundamental Updates
1️⃣ U.S. Treasury yields eased slightly as consumer confidence declined.
2️⃣ Markets now price a 66% chance of a rate cut in December, according to CME’s FedWatch Tool.
3️⃣ U.S. government shutdown concerns keep the dollar under mild pressure as investors watch debt issuance risk.
💬 Summary
A clear trendline rejection combined with fundamental USD weakness supports a short bias.
Wait for confirmation before entering — patience protects capital.
⚠️ Disclaimer
This analysis is for educational purposes only and not financial advice.
Always do your own research and manage risk wisely.
📢 Support My Work
💚 Like, Comment & Share this idea to motivate more chart updates!
🧠 “Charts Don’t Lie, Traders Don’t Quit.”
#USDCHF #ForexAnalysis #TradingView #PriceAction #Trendline #Ichimoku #TechnicalAnalysis #ForexTrader #Fundamentals #SwingTrading #KABHI_TA_TRADING

USDCAD Alert! — Smart Money + Elliott Wave + Price Action + Fib🚨 USDCAD Wave C Correction Alert!
According to Wave Theory Confluence , we’re likely approaching the end of Wave B (Y) around the 1.4150–1.4300 zone — aligning with the 0.5–0.618 Fibonacci retracement levels. 📉
Price is showing exhaustion near this area with signs of liquidity grab (BSL hit) and smart money distribution , suggesting potential bearish reversal setups ahead. 🔍
Expecting Wave C to unfold next, targeting deeper downside correction before the next impulsive leg resumes.
📊 Key Confluences:
Elliott Wave B completion zone
Smart Money liquidity sweep
Bearish structure shift forming
Fibonacci rejection area
Fundamentals still favor short-term CAD strength
💡 Trade Idea: Watch for confirmation of bearish momentum and structure break before entering shorts toward 1.33–1.32 region.
Stay sharp — Wave C could be fast and decisive! ⚡
What’s your take, traders? 🤔
Do you think Wave C is about to drop hard or will bulls surprise us again? 🐻📉🐂
Drop your analysis 👇 — let’s see who nails the next big move! 🚀
#USDCAD #ForexAnalysis #ElliottWave #SmartMoneyConcepts #PriceAction #WaveTheory #ForexTrading #SwingTrade #Fibonacci #FXForecast #TechnicalAnalysis #TradeSetup #MarketStructure #USD #CAD #ForexCommunity

EUR USD long. Fundamental explanation It's a 'risk on trade'. Suggestions an end to the showdown is in sight, plus dovish noises coming out of Japan contribute to the market starting the week in a good mood.
I would suggest any form of risk on trade is viable. I've chosen the EUR to long because I like the support I have placed a stop loss behind, plus the profit target isn't asking for a new high.
I've chosen the USD to short because in this moment, it is weaker than the JPY and CHF, plus I've read an end to the shutdown is likely to be USD negative.
The risk to the trade is negative market sentiment. Or, I should have longed a currency with more momentum (such as the AUD). Likewise, maybe JPY is the better short option.
It is a trade I will leave overnight, until conclusion either way.

DXY — Range Structure HoldsThe US Dollar Index (DXY) started the week trading just below a bearish distribution fractal low at 99.321. Price holds inside a short-term bearish range between 99.000 (low) and 99.500 (high) while still operating within the broader daily bullish structure. DXY is currently moving through the daily imbalance cap near 99.035, sitting in the premium zone — compression remains active as larger participants stay patient. Market Structure Mapping (MSM) shows price tightening in that upper zone — the calm before the bigger players step in.
Market Structure Mapping (MSM) shows price pressing into the daily imbalance high near 99.035, lining up with the range-low fractal around 99.032. That’s the lower edge of Monday’s structure — tight, clean, and holding steady. Volume Flow Analytics (VFA) points to order-flow absorption — buyers keep hitting the tape, but liquidity keeps taking the other side.
It’s that slow-burn type of session where participation fades and bigger players quietly build positions under the surface. If that pattern holds, price could drift back toward the discount area once participation increases.
No rush — London already had its short trade this morning.
Now it’s just about waiting for confirmed order flow before taking the next setup.
The dollar’s steady as Washington works on a funding deal to end the government shutdown, calming market nerves.
Ten-year Treasury yields hover just above 4.1 %, keeping a floor under USD as investors still get paid to hold dollars.
Inflation’s sitting near 3 %, growth data is mixed, and delayed reports mean traders are reacting more to headlines than numbers.
For now, yields and improving political tone offer support — but it’s not bulletproof.
If debt or growth headlines turn sour again, that support can fade fast.
🦅 CORE5 RULE:
Slow days build strong traders. Wait for the flow, not the noise.
— CORE5DAN
Institutional Logic. Modern Technology. Real Freedom.

GBPUSD Intraday Technical AnalysisGBPUSD Intraday Technical Analysis - 10 Nov 2025
British Pound/US Dollar at 1.31545 (3:15 PM UTC+4) — key confluence setup emerging.
📌 Market Context: Wyckoff accumulation phase post-September swing; Dow Theory secondary correction fading; Gann Square-of-9 targets 1.3180/1.3120.
🗺️ Multi-Timeframe Pulse:
1D: Double-bottom pattern near 1.3050; RSI 52 (neutral bias); Ichimoku cloud support 1.3020; bullish pennant forming.
4H: Rising channel 1.3120-1.3200; EMA21>EMA50>EMA200 (golden cross); VWAP from Oct 15 = 1.3145 (neutral pivot).
1H: Flag continuation above 1.3140; BB midline 1.3150; VWAP slope slightly bullish after 1.3100 test.
30M: Symmetrical triangle 1.3120-1.3170; hidden bull divergence on RSI; volume declining pre-breakout.
15M: Bull flag over 1.3140; Tenkan>Kijun bullish cross; stochastic RSI reset ready.
5M: Falling wedge retest 1.3140; hammer candlestick confirms intraday support; watch false breakout above 1.3175.
🎯 PRIMARY LONG SETUP
Entry: 1.3140-1.3155 (flag support + VWAP) — confirm on 15M bullish close >1.3160.
Stop Loss: 1.3115 (below triangle base).
Target 1: 1.3175 (+30 pips).
Target 2: 1.3200 (+55 pips — channel top).
Target 3: 1.3240 (+95 pips — harmonic extension).
Confirmation: RSI>55, volume spike >20% avg, VWAP support intact.
⚡ MOMENTUM SCALP: Add above 1.3200 ONLY if RSI>65 + sustained volume; trail stop to 1.3180.
🔻 REVERSAL SHORT SETUP
Entry: 1.3225-1.3250 (supply zone) — trigger on bearish engulfing + RSI divergence.
Stop Loss: 1.3280 (above channel resistance).
Targets: 1.3190 → 1.3150 → 1.3110 (Gann support).
Confirmation: 5M/15M RSI bearish divergence; BB upper band rejection on 1H.
🚨 BREAKOUT PROTOCOL:
BULL: 1H close >1.3200 confirms breakout; target 1.3300; move stop to BE+10.
BEAR: 1H close <1.3120 with volume expansion = retest 1.3050 double-bottom support.
📊 INDICATOR SNAPSHOT: BB squeeze (30M) tightening; MACD histogram positive; VWAP slope neutral-bullish; EMA21 acting as trigger line.
⚠️ PATTERN ALERTS: Harmonic bat PRZ at 1.3250; rising channel failure <1.3140 = Wyckoff spring signal; H&S risk if neckline 1.3090 breaks.
📈 TIMING & RISK: UK inflation data Nov 12 elevates volatility; BoE speakers expected; Gann 90° window 18:00 UTC. Risk ≤1% per setup; avoid chasing; lock partials at TP1.
Educational analysis only. Align entries with your plan, manage risk, adapt to price action.

Bullish momentum to extend?The US Dollar Index (DXY) is declining toward the pivot level, which serves as an overlap support zone, and may rebound toward the 1st resistance.
Pivot: 98.29
1st Support: 97.14
1st Resistance: 101.91
Disclaimer:
The above opinions given constitute general market commentary, and do not constitute the opinion or advice of IC Markets or any form of personal or investment advice.
Any opinions, news, research, analyses, prices, other information, or links to third-party sites contained on this website are provided on an "as-is" basis, are intended only to be informative, is not an advice nor a recommendation, nor research, or a record of our trading prices, or an offer of, or solicitation for a transaction in any financial instrument and thus should not be treated as such. The information provided does not involve any specific investment objectives, financial situation and needs of any specific person who may receive it. Please be aware, that past performance is not a reliable indicator of future performance and/or results. Past Performance or Forward-looking scenarios based upon the reasonable beliefs of the third-party provider are not a guarantee of future performance. Actual results may differ materially from those anticipated in forward-looking or past performance statements. IC Markets makes no representation or warranty and assumes no liability as to the accuracy or completeness of the information provided, nor any loss arising from any investment based on a recommendation, forecast or any information supplied by any third-party.

Forex: Weekly Review I found the week starting Monday 3 November to be a difficult trading environment.
On the surface, all is well. Central banks are cutting interest rates during a reasonably strong economic environment. Inflation is gradually falling, the US and China trade negotiations are tentatively positive. Company earnings continue to exceed expectations. All in all, although it's been years in the making (and may still take years to be confirmed), the 'soft landing narrative' is alive and well.
But, a potentially slower pace of FED rate cuts, a resurfacing of US / CHINA tension (particularly regarding rare earth), suggestions AI stocks are overvalued...All combined with the ongoing government shutdown to ensure a negative tone throughout the week.
We did get a bit of private sector data, Monday's 'soft' manufacturing data kick-started the negative mood. Wednesday's 'positive' ADP JOBS and ISM SERVICE data provided us with the only 'positive sentiment' day of the week. But the positivity evaporated once the 'overvalued tech concerns' kicked in.
A 'still hawkish RBA' didn't help the AUD as the commodity currencies struggled in the overall negative environment. But a 'BOE hold' did give the GBP some restpite from recent woes, perhaps a bit of profit taking after a couple of weeks negativity.
All in all, the fact the VIX barely rose above 20 suggests to me the negativity isn't too concerning and 'risk on' trades could resume soon. But I begin the new week with an open mind.
On a personal note, it was a bit of a disappointing week of two trades, AUD JPY long during Wednesday's positivity, perhaps I was a little late to the party. A trade immediately after ADP data may well have hit profit, it's always tricky when two pieces of data are released an hour apart, do you go with the initial release or wait for the second piece of data? Whichever option you choose, sometimes it goes for you, sometimes it goes against you. All you can do is make a decision that feels right in the moment.
By Friday, I felt the JPY strength was overdone and placed a USD JPY long, based on diverging interest rate speculation. The trade was eventually closed for a small profit.
Let's see what the new week brings.

US Dollar: Buy The Rally!Welcome back to the Weekly Forex Forecast for the week of Nov. 10-14th
In this video, we will analyze the following FX market: USD Dollar
The USD is in a pullback... that I believe is ending. Buying is the best bet! Once price gives the signature of a market shift from bearish to bullish, buys are valid!
Enjoy!
May profits be upon you.
Leave any questions or comments in the comment section.
I appreciate any feedback from my viewers!
Disclaimer:
I do not provide personal investment advice and I am not a qualified licensed investment advisor.
All information found here, including any ideas, opinions, views, predictions, forecasts, commentaries, suggestions, expressed or implied herein, are for informational, entertainment or educational purposes only and should not be construed as personal investment advice. While the information provided is believed to be accurate, it may include errors or inaccuracies.
I will not and cannot be held liable for any actions you take as a result of anything you read here.
Conduct your own due diligence, or consult a licensed financial advisor or broker before making any and all investment decisions. Any investments, trades, speculations, or decisions made on the basis of any information found on this channel, expressed or implied herein, are committed at your own risk, financial or otherwise.

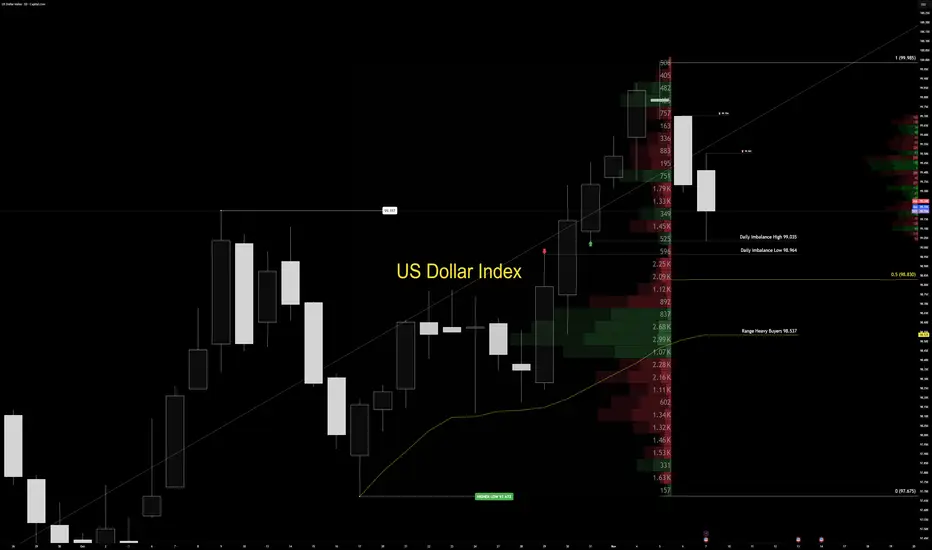
Sunday Dollar War Map | Week Ahead — DXY Structure OutlookThe US Dollar Index (DXY) continues to trade within a controlled bullish range, holding the upper half of its daily structure between 97.675 (range low) and 99.985 (range high). Price remains anchored inside premium territory, with a daily imbalance cap defined between 99.035 (high) and 98.964 (low).
Volume delta stays concentrated deep in the discount zone near 98.537, showing that institutional participation remains limited. Early in the week, price may probe deeper into that imbalance cap to trigger larger positioning before any directional expansion. Until confirmed volume steps in, the tactical stance remains clear: observe, don’t predict. Professionals wait for conviction — amateurs try to guess it.
The active order flow imbalance remains unfilled, and price typically reacts once single prints inside that imbalance get touched. However, the heavy volume concentration across the lower half of the range deserves attention — trading directly into the cap often causes reactive blowback. That’s not random; it’s how market maker logic plays out through volume flow behavior.
On the macro side, US yields continue to climb as investors demand higher compensation for duration risk. The 10-year Treasury yield hovers near 4.1%, while the 30-year sits close to 4.7%. Meanwhile, fiscal pressure continues to build — record government debt and renewed shutdown risks are keeping confidence fragile.
The outcome is a balancing act: rising yields support the dollar in the short term, while long-term credibility remains under pressure. For now, the dollar holds its ground — but each move is conditional.
Professionals trade participation, not prediction. The market doesn’t reward speed — it rewards confirmation. Let the tape show its hand before you show yours. Structure speaks first. Volume decides who listens.
— Institutional Logic. Modern Technology. Real Freedom.
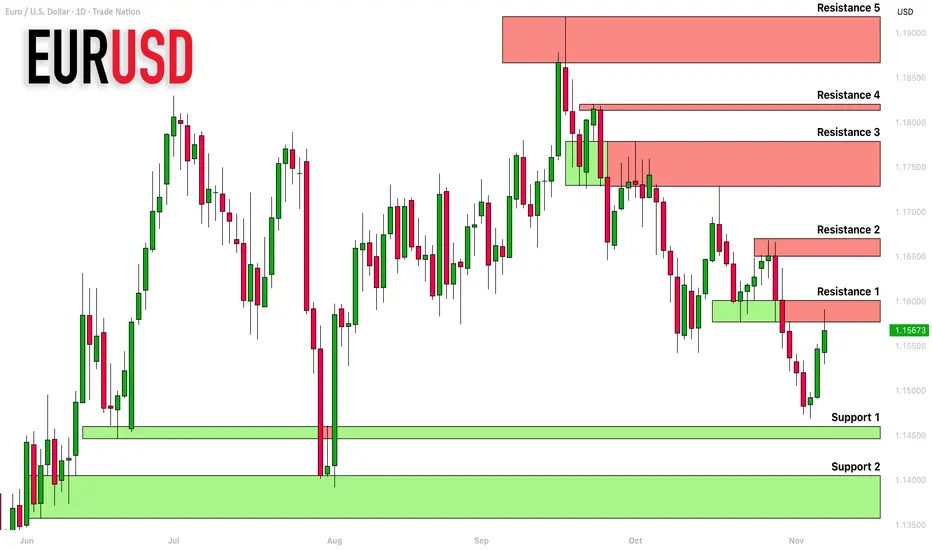
EURUSD: Support & Resistance Analysis For Next Week 🇪🇺🇺🇸
Here is my latest structure analysis and important
supports and resistances for EURUSD for next week.
Consider these structures for pullback/breakout trading.
❤️Please, support my work with like, thank you!❤️
I am part of Trade Nation's Influencer program and receive a monthly fee for using their TradingView charts in my analysis.
USDCAD: Bullish Outlook Explained 🇺🇸🇨🇦
USDCAD is going to rise from a key daily support cluster.
A formation of a bullish imbalance candle after its test
suggests a strong buying interest.
Expect a bullish movement at least to 1.4074
❤️Please, support my work with like, thank you!❤️
I am part of Trade Nation's Influencer program and receive a monthly fee for using their TradingView charts in my analysis.

NZDUSD Channel Down forming a Low. Buy Signal.The NZDUSD pair has been trading within a Channel Down since the July 01 2025 High and is currently approaching its bottom (Lower Lows trend-line).
Four out of five Lower Lows have rebounded on a Bullish Leg to at least the 0.618 Fibonacci retracement level. With the 1D RSI also oversold, we expect a new Bullish Leg to start and target yet again the 0.618 Fib at 0.57250.
-------------------------------------------------------------------------------
** Please LIKE 👍, FOLLOW ✅, SHARE 🙌 and COMMENT ✍ if you enjoy this idea! Also share your ideas and charts in the comments section below! This is best way to keep it relevant, support us, keep the content here free and allow the idea to reach as many people as possible. **
-------------------------------------------------------------------------------
💸💸💸💸💸💸
👇 👇 👇 👇 👇 👇

Gold – Bearish Momentum Builds | Key Support at 3983GOLD | Fundamental & Technical 💎
🔻 Fundamental:
Gold climbed back above $4,000 as traders weigh the impact of recent U.S. labor data on the Federal Reserve’s rate path.
🟢 With the Fed’s final 2025 meeting approaching and key data delayed by the U.S. government shutdown, markets face heightened uncertainty over the next policy move.
🟢 Despite the recovery, the broader trend remains technically sensitive near a key resistance zone.
🕯 Technically:
Currently, gold is testing the 4025 resistance area.
🔽 As long as price remains below 4025, bearish pressure may continue toward 3983 → 3961.
🔼 A 1H close above 4025, however, would confirm renewed bullish momentum, targeting 4055, with an extended upside path toward 4105 if momentum accelerates.
Key Levels
Pivot Line: 4025
Resistance: 4053 · 4076 · 4105
Support: 3984 · 3961 · 3925

DXY — London SessionThe US Dollar traded through 99.357, confirming a wide range between 97.6 and 99.9.
This is already a large playing field, and today’s movement needs extra care.
It’s Friday, and with weekend flows plus U.S. politics in the mix, price can move irregularly.
Signals need double confirmation before bias.
We have our range, and the focus now is to respect it — not rush it.
The professional move: wait for structure to prove intent.
Discipline always beats impulse.
Fundamentals
Dollar strength remains supported by cautious sentiment.
Yields are steady, and investors are holding defensive exposure rather than chasing risk.
It’s less about fresh demand — more about managing positioning ahead of next week’s data.
— CORE5DAN
Institutional Logic. Modern Technology. Real Freedom.

EURUSD: Bearish Move From Resistance Confirmed 🇪🇺🇺🇸
EURUSD finally retested a broken structure that I showed you earlier.
There is a high chance that the pair will continue retracing from that,
following a formation of a double top pattern and bearish imbalance.
Goal - 1.152
❤️Please, support my work with like, thank you!❤️
I am part of Trade Nation's Influencer program and receive a monthly fee for using their TradingView charts in my analysis.

USD JPY. LONG The message coming from the FED remains 'a slower pace of rate cuts' (all bar one member). Japan's new president inserts a 'dovish team, all in all, I feel JPY strength is 'overdone'.
Once again it was a coin toss whether to long USD or AUD.
The risk to the trade is negative market sentiment, it is very early in the trading day and anything can happen.
Because it's early in the trading day, I've gone for a 1 5:1 risk reward. I will close the trade before end of day (if it's ongoing), to avoid weekend risk.
I have found it difficult to form a strong conviction in the direction of the currencies this week. I've not been able to commit to the negative sentiment, Due to the overall uncertainty I suspect there has been some profit taking across all assets. Hopefully next week will bring a little more clarity and cohesion.

GBP/USD – BoE Rate Decision Ahead |(06.11.2025)🧠 Setup Overview:
GBP/USD is trading inside a descending channel, with price recently rebounding from a strong support zone near 1.3000.
Ahead of the Bank of England (BoE) interest rate decision, the pair is positioned for a possible bullish breakout if the BoE maintains rates and highlights inflation risks.
📊 Trading Plan:
Bullish Scenario:
If the BoE holds rates and remains cautious on inflation → expect GBP/USD to rebound toward 1.3120 – 1.3180.
Breakout confirmation above channel resistance will strengthen the bullish view.
Bearish Scenario:
If the BoE signals dovish tone or hints at future rate cuts, GBP/USD could drop below 1.3000, targeting 1.2850 – 1.2710.
⚙️ Technical Levels:
🟢 1st Resistance: 1.3133
🟢 2nd Resistance: 1.3171
🔴 Support Zone: 1.3000 – 1.3020
Pattern: Falling Channel → Potential Breakout
🧩 Fundamental Insight (Today – 6 Nov 2025)
1.Markets price a 1-in-3 chance of a BoE rate cut to 3.75%, but consensus expects a hold at 4.00%.
2.UK inflation at 3.8% YoY remains above the BoE’s target, supporting a hawkish stance.
3.A surprise dovish tone, however, could hit the pound hard against the USD, especially as US data remains resilient and the dollar stays firm.
#GBPUSD #BoE #Forex #TechnicalAnalysis #PriceAction #ChartPatterns #KABHI_TA_TRADING #FundamentalAnalysis #BankOfEngland #InterestRates #FXMarket #TradingPlan #ForexSetup #ChartsDontLieTradersDontQuit #GBP #USD #TradingView
⚠️ Disclaimer:
This analysis is for educational purposes only and not financial advice. Always do your own analysis and manage risk carefully before trading news events.
💬 Support My Work ❤️
If you find this chart helpful — LIKE 👍, COMMENT 💭, and FOLLOW 🔔 to stay updated with more daily Forex setups and price action insights!

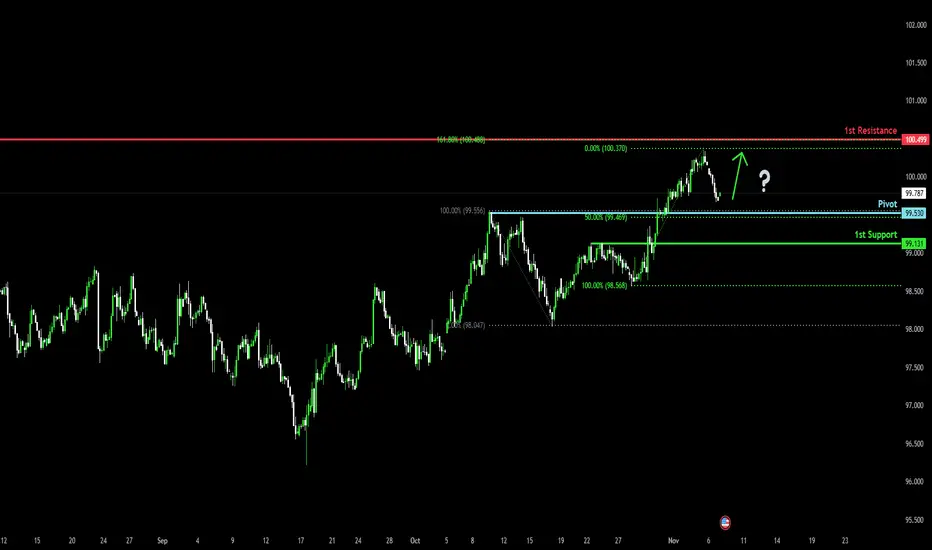
Bullish bounce off 50% Fibonacci support?The US Dollar Index (DXY) is falling towards the pivot, which has been identified as a pullback support that aligns with the 50% Fibonacci retracement and could bounce to the 1st resistance.
Pivot: 99.53
1st Support: 99.13
1st Resistance: 100.49
Disclaimer:
The above opinions given constitute general market commentary, and do not constitute the opinion or advice of IC Markets or any form of personal or investment advice.
Any opinions, news, research, analyses, prices, other information, or links to third-party sites contained on this website are provided on an "as-is" basis, are intended only to be informative, is not an advice nor a recommendation, nor research, or a record of our trading prices, or an offer of, or solicitation for a transaction in any financial instrument and thus should not be treated as such. The information provided does not involve any specific investment objectives, financial situation and needs of any specific person who may receive it. Please be aware, that past performance is not a reliable indicator of future performance and/or results. Past Performance or Forward-looking scenarios based upon the reasonable beliefs of the third-party provider are not a guarantee of future performance. Actual results may differ materially from those anticipated in forward-looking or past performance statements. IC Markets makes no representation or warranty and assumes no liability as to the accuracy or completeness of the information provided, nor any loss arising from any investment based on a recommendation, forecast or any information supplied by any third-party.
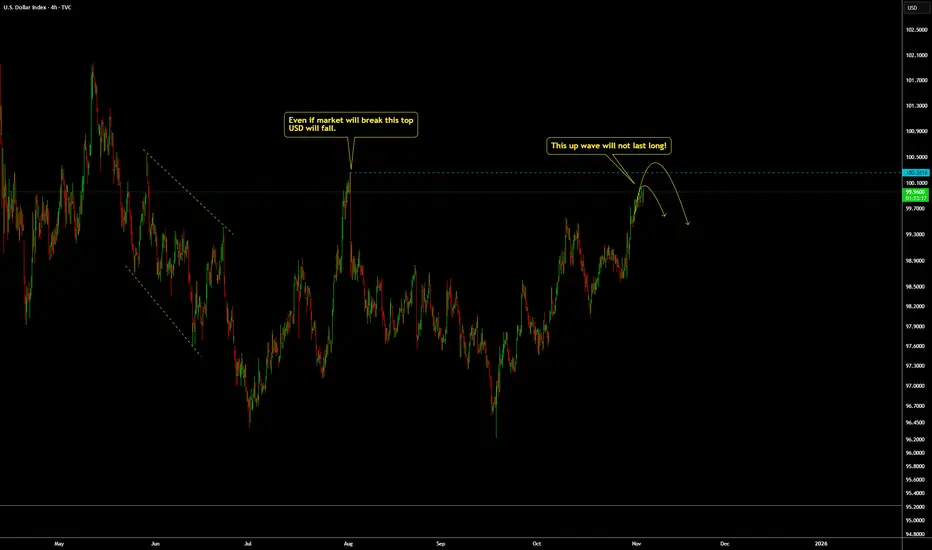
DXY(Dollar Index): This up wave will not last long.For TVC:DXY , don't be trapped with this up wave, it should not last long. What is happening now is only manipulation based on what we see.
Fed will continue to cut rates if not this year, next year and they are printing money, ending the QT and also things are not okay. Based on that, on the fundamental part of things and We Trade Waves wave analysis concept. Any sell setup we get for DXY we will go for it BUT:
Always remember WTW 4 Golder Rules:
1) Do not jump in
2) Do not over risk/trade
3) Do not trade without Stop Loss
4) Never ever add to a losing position!
Trade with care
We Trade Waves
WTW Team
Disclosure: We are part of Trade Nation's Influencer program and receive a monthly fee for using their TradingView charts in our analysis.
USDCHF Perhaps the best buy opportunity in the market!The USDCHF pair is staging a strong bullish reversal following last week's 1W candle closing above the 1D MA100 (red trend-line). The reason is that every time in the past 3 years (since November 07 2022) the price broke and closed a week above that level, the pair rallied towards the 1W MA200 (orange trend-line).
This time is doing so also at the back of a huge 1W RSI Bullish Divergence of Higher Lows against the prices Lower Lows since April 2025.
We estimate that contact with the 1W MA200 can be achieved around $0.8800 and that is our long-term Target for USDCHF.
-------------------------------------------------------------------------------
** Please LIKE 👍, FOLLOW ✅, SHARE 🙌 and COMMENT ✍ if you enjoy this idea! Also share your ideas and charts in the comments section below! This is best way to keep it relevant, support us, keep the content here free and allow the idea to reach as many people as possible. **
-------------------------------------------------------------------------------
💸💸💸💸💸💸
👇 👇 👇 👇 👇 👇

DOLLAR INDEX (DXY): Too Overbought Now
Looks like Dollar Index finally starts correction.
A test of a significant hisotric daily resistance triggered
a bearish movement and an intraday change of character
on a 4H time frame.
I think that the market may drop lower.
Goal - 99.8
❤️Please, support my work with like, thank you!❤️

DXY — London Session🧭 Market Context
Dollar capped down overnight from 99.762 to 99.704 but still trades above the key bullish structure point at 99.525. The structure remains bullish overall, yet price keeps failing to break through 99.875 — the current cap. London session has filled yesterday’s balance range, leaving us in neutral territory.
We’re sitting on zero deviation — meaning equal chance to push higher or rotate lower.
Before taking any position, we need confirmation.
📈 Technical Frame DSM + VFA
Structure stays constructive but momentum is fading.
Volume shows thinning participation near 99.875 — professionals aren’t chasing.
If we see clear volume conviction through that level, we likely drive higher and fill the capped zone. If price slips below 99.525, expect a liquidity sweep into the lower volume pocket near 99.40. Right now, this is observation mode — not engagement mode.
🌍 Fundamental Frame (Macro Logic)
Overnight softness came from mild risk-on sentiment — Asia equities up, yields down.
Still, the Fed’s tone stays restrictive, and dollar demand remains under the surface.
This move looks more like positioning ahead of NFP than any real shift in trend.
🏛️ Coach’s Lens
When the market sits in balance, patience becomes the edge.
Professionals wait for clarity; amateurs act on hope.
Bias follows structure — not emotion.
🎯 Operator Rule
Confirmation defines conviction.
— CORE5DAN
Institutional Logic. Modern Technology. Real Freedom.
