$USDT.D dropping again!CRYPTOCAP:USDT Dominance Dropping Again!
Another rejection from the trendline now down 40 %-
If 3.8% support breaks, Altseason could explode! 🔥
Usdt

$BALUSD long trade setupCAPITALCOM:BALUSD Long Trade Setup 🚀
The breakdown of the downtrend is confirmed as the price is respecting the trendline support. It is poised for a substantial relocation!
Entry Zone: $1.0664 - $1.1270
Stop Loss: $0.9585
. TP1: $1.55
. TP2: $1.85
. TP3: $ 2.25
Confirmation: Breakout pattern with holding above trendline.
Make the most of 3x–5x margin of safety
It looks like the accumulation is finished.
A breakout season could ensue! 🔥
DYRO, NFA

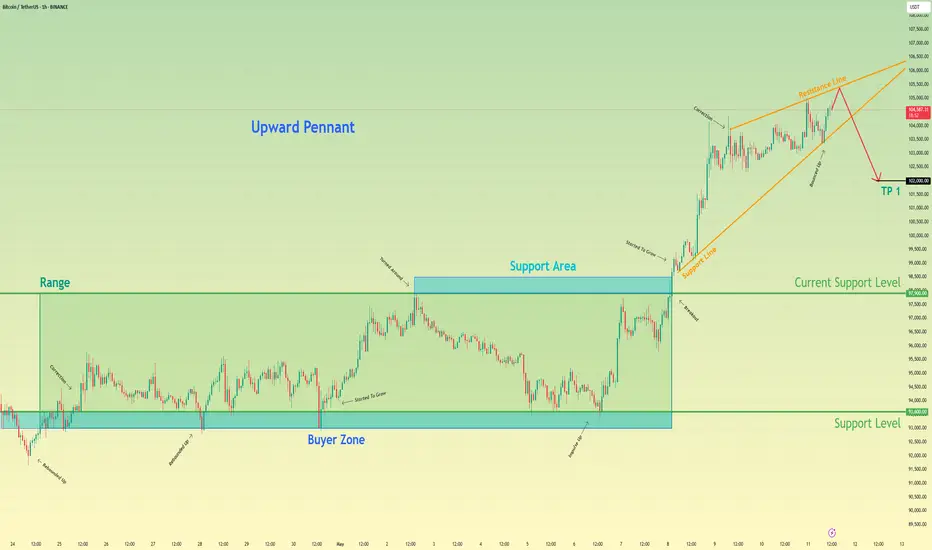
Bitcoin may drop to 102K points, exiting from pennantHello traders, I want share with you my opinion about Bitcoin. After breaking out of a multi-day range and launching a strong impulse from the buyer zone, the price has formed a clear upward pennant pattern. This technical formation often signals a potential slowdown in the bullish momentum, especially when it follows an aggressive move to the upside. The current price action shows that BTC has approached the resistance line of the pennant, but failed to generate further breakout strength. Each new impulse within the structure has weakened, and the market is starting to compress inside narrowing boundaries. The support area has been holding the structure temporarily, but the inability to push through the top of the pennant suggests growing exhaustion among buyers. This setup indicates that BTC may soon break downward from the pennant. So, I expect that it will make a correction that could drive the price down to the 102000 points, thereby exiting from pennant pattern. Please share this idea with your friends and click Boost 🚀
Steibles dominance: USDT.D+USDC.DThe graphic shows Kryptan blood and tears - in red variant. And bullish crypto - triumph in blue!
I am of course counting on the blue variant, as:
1)There has been no normal bulls with the fall of bitcoin dominance.
2)The American newly elected tech team hasn't shown anything meaningful except loud populist statements and family memes.
3)Stimulus with rate cuts, QE, M2 and other liquidity releases haven't really kicked in yet
So I'm waiting for an epic risk on and exit pamp!
Translated with DeepL.com (free version)

$ADA Breaking structure Cardano just touched a long-term descending trendline support and shows signs of a potential reversal. 👀
🧠 Smart money might be watching for a bounce, consolidation, and a sharp move toward the $0.95–$1.05 zone.
🕰️ Patience is key — breakout confirmation will be crucial.

$FHE/USDT Chart Update$FHEUSDT/USDT Chart Update
Strong bounce from the demand zone
6h structure holding firm with a clear bullish reaction
Entry: $0.095–0.097
SL: $0.08615
TP: $0.18484+
It looks ready to explode, so don’t sleep on this one! 👀
DYRO, NFA

$FHE/USDT Bullish Breakout Setup$FHE/USDT Bullish Breakout Setup
Price just broke out of a symmetrical triangle after days of tight consolidation.
Momentum is building, this looks ready to fly. 🚀
- Entry: CMP
- Target: $0.18
- SL: $0.091
High RR setup. Watch closely. DYRO, NFA

$RPLUSDT broken out BINANCE:RPLUSDT has broken out! 🚀
Clean breakout from descending trendline triangle with volume.
Targeting $17.72 (+263%).
Retest zone: $4.60–$5.00
Momentum looks strong, don’t sleep on this move!
DYRO, NFA

$APT/USDT 12H Charts$APT/USDT – Long Trade Setup
- Entry Zone: CMP
Targets:
• TP1: $6.80
• TP2: $8.20
• TP3: $10.83
Stop Loss: $4.85
- Leverage Suggestion: Use 3–5x leverage max.
Breakout from long-term downtrend with bullish momentum building.
Trade with proper risk management!

$AIOZ/USDT Breakout Trade Setup$AIOZ/USDT – Breakout Trade Setup
AIOZ just broke out of its key supply zone after weeks of consolidation!
Strong bullish structure trendline support setup.
- Target: $1.30
- Entry: CMP
- SL: $0.35
DYRO, NFA

$LINK just broke out CRYPTOCAP:LINK just broke out of its downtrend and 100-day SMA!
Bullish reversal confirmed eyes on $30 +86%.
Entry: CMP
- TP1: $18.90
- TP2: $23.50
- TP3: $29.90
Stop Loss: $14.80
Use 3–5x leverage max. DYOR, NFA.

$BTC, Bitcoin update: what is going on?🚨 Bitcoin Update: We've just seen a decent correction on CRYPTOCAP:BTC followed by a strong pump.
I’ve warned about this already — this pump is not organic. It's largely driven by institutions and Michael Saylor, using leverage.
📉 A healthy price movement should look like a staircase: move up, consolidate, reset the daily MACD, then push higher again.
Each rally should be followed by a slight pullback — that’s how sustainable trends are built.
❌ But this natural cycle is being disrupted.
Saylor and ETFs keep buying the top to prevent corrections. Some laugh and call it incompetence, but I believe it’s strategic.
These players don’t care about making money on trades.
Their goal is to inflate the value of their companies (or stock value), which are now heavily tied to Bitcoin’s price.
That’s why they don’t want BTC to consolidate.
Every time there's weakness, they step in to buy, preventing any pullback and forcing the price through resistances and fair value gaps.
🤖 The problem? Bots — which represent +80%+ of the trading volume — are not wired this way.
They sell when BTC is overbought and buy when it's oversold.
But with institutions disrupting this cycle, exchanges end up selling BTC, and whales scoop it up — leading to lower supply on exchanges.
Exchanges then have to buy BTC back at higher prices, sometimes even at a loss — often by printing billions in Tether (USDT) to compensate.
🎈 This entire mechanism is inflating Bitcoin’s price, exactly what Bitcoin maximalists want.
But it also kills the chance for an altseason, which usually comes after Bitcoin tops out.
📊 So what’s next?
Ideally, we get a consolidation to around $91K to avoid a major bearish divergence.
If BTC breaks below $90K, we could see GETTEX:82K — but given current conditions, that’s unlikely.
On the chart, RSI is high on daioly, Williams indicator is turning bearish and MACD too. These are all signs of a most needed consolidation. But as I explained, this is cancelled at the moment.
💰 Can institutions push BTC to a new all-time high?
Yes — they basically have unlimited capital and the money printer will turn back on by September.
But once again, altseason is postponed.
#Bitcoin #BTC #CryptoMarkets #MichaelSaylor #ETF #BTCAnalysis #Altseason #CryptoPump #MarketManipulation #BTCUpdate #Tether #CryptoWhales #DailyMACD #TechnicalAnalysis #CryptoInsights #Web3

$ASTR Breakout Alert🚨 RUS:ASTR Breakout Alert 🚨
Astar RUS:ASTR broke out of a long-term descending channel on the daily chart, closing above key resistance and the 40-day MA.
- Target: $0.09578
- Potential upside: +259%
Watching for confirmation and volume follow-through.

MERL Forming Ascending Pattern – Breakout Ahead?🚀 AQUISUK:MERL Forming Ascending Pattern – Breakout Ahead? 📈
AQUISUK:MERL is currently forming an ascending pattern! 📊 If the price continues to rise, we could see a strong breakout soon. Keep an eye on this potential setup! 🔥
Let’s ride this breakout together! 💼💸

Bitcoin may correct a little and then continue to grow in wedgeHello traders, I want share with you my opinion about Bitcoin. The price has been moving confidently inside an upward wedge structure, which often signals a continuation in strong bullish trends but also warns of potential exhaustion if momentum fades. In this case, the wedge is forming after a clear impulse move and is supported by a solid base at the buyer zone. Multiple impulses from this level and consistent support at the current support zone have pushed the price higher, with bullish momentum now clearly in control. After a breakout from the previous resistance zone and a clean retest of the support area, the price started a strong rally. This move aligns well with the wedge formation, where both trend lines are narrowing upward, indicating that buyers are pushing steadily higher while sellers are becoming more aggressive, a setup that often leads to an explosive breakout if the resistance is breached. Now BTC trades above 93700, consolidating slightly below the wedge resistance line. Based on the wedge geometry and the strong impulse structure that preceded it, I expect the price to continue growing and test the 100000 level, which aligns perfectly with the upper wedge boundary and serves as my TP 1. Please share this idea with your friends and click Boost 🚀

$Bitcoin approaching ATHBitcoin approaching ATH 👀
CRYPTOCAP:BTC breaks out of a multi-month descending triangle and flips key resistance into support.
Now pushing toward the $110K zone, a consolidation range is expected just below the all-time high.
Momentum looks strong.
ATH, retest soon?

$UFD Falling Wedge Breakout in Play📈 $UFD Falling Wedge Breakout in Play 🚀
Unicorn Fart Dust $UFD just broke out of a multi-month falling wedge a classic bullish reversal pattern.
After retesting the breakout zone, the price is holding strong above support.
- Target: $0.408
- Potential Upside: +1957.8%
If this setup plays out, we could witness a massive rally.
Keep your eyes on this low-cap gem! 👀

$BTC support zoneCRYPTOCAP:BTC has broken out of a falling wedge and is now consolidating above the key $91K support zone.
- Eyes are now on the All-Time High at $ 109 K.
- Once that breaks, a price discovery rally toward $ 120k+
It is highly likely. 🧠
- The chart looks.
DYRO, NFA

$1000CHEEMSUSDT Breakout Alert🚨 Breakout Alert! BINANCE:1000CHEEMSUSDT 🚀
Price broke out of a symmetrical triangle on the 12-hour chart, bullish confirmation in play.
- Entry: CMP
- Target 1: 0.001681
- Target 2: 0.002183
- Final Target: 0.003322
- SL: 0.001336
Volume confirmation next?
Watch closely! 👀

formed a bearish head and shouldersXVS has formed a bearish head and shoulders pattern and has already broken below the blue neckline. This breakdown suggests a potential move down to the green line level.
📈 Technical Overview:
Pattern: Bearish Head and Shoulders
Neckline: Blue level, already broken.
🎯 Target: Green line level upon confirmation of the breakdown.

$BR/USDT just broke out$BR/USDT just broke out of a major resistance zone after weeks of compression inside an ascending triangle 📈
Now holding above the breakout level, with a clean 100% upside potential mapped.
If the Bulls defend this zone, the next leg could be explosive.

$INJ Breakout Alert!CRYPTOCAP:INJ breakout alert!
-It finally broke above the downtrend line after months of
consolidation.
-Retest and holding the key support zone around $8.50–
$9.00.
-Now, we are aiming for the next leg toward $26, a
Potential 184% move.
-Trend shift confirmed. Watch closely!🚀
DYRO, NFA

$BTC at the start of the next parabolic run!Bitcoin's parabolic run in 2017 continued on MA11 and with the breaking of the middle band of the mass index indicator, the second parabolic run continued and now we are at the same stage.
