Bitcoin Breakout AlertBTC is consolidating within a symmetrical triangle, gearing up for a potential 19% breakout!
Watch for a strong move above $96K. A breakout could target $112K.
BTC traders, keep your eyes on this setup! 👀
Usdt

BNB is on weekly supportBNB now is staying above the strong weekly support with big shadow, and will raise to $1400 IMO

CAKEUSDT Falling Pattern Setup with 100%-150% Potential Gains CAKEUSDT has recently formed a Falling Pattern, a chart formation that typically signals a period of consolidation or potential reversal. This pattern is often seen in markets that are in the process of finding a bottom before making a sharp upward move. For CAKEUSDT, the pattern is accompanied by good volume, which indicates that there is solid market interest and a buildup of potential for a breakout. With a projected gain range of 100% to 150% or more, traders are watching this pair closely, hoping to capitalize on what could be a significant upward move once the price breaks out of the pattern's resistance.
The Falling Pattern typically shows a series of lower highs and lower lows, followed by a potential breakout when the price moves through the key resistance level. The increasing volume during this phase suggests that buyers are starting to take control, positioning themselves for a potential rally. Investors are growing more interested in CAKEUSDT as it shows signs of bottoming out and setting up for an explosive upward movement. If this pattern follows through, traders could see substantial returns as the price looks to reclaim its previous highs.
As with all chart patterns, the success of the Falling Pattern in CAKEUSDT depends on several factors, including broader market conditions and the overall sentiment in the crypto space. However, the good volume backing this pattern suggests a higher likelihood of a strong reversal. If CAKEUSDT can break above the resistance formed by the Falling Pattern, the next phase could be a sharp rally, potentially pushing the price higher and providing traders with significant profit opportunities.
Traders should remain cautious and monitor key support and resistance levels to make informed decisions as the price action unfolds. If the market continues to favor bullish momentum, CAKEUSDT could experience a strong breakout that leads to notable gains. Given the current technical setup and investor interest, this pair could be one to watch closely in the coming days or weeks for those looking to capitalize on the next big move.

Bitcoin may drop to support line before reboundingHello traders, I want share with you my opinion about Bitcoin. We can observe how the price entered a range when analyzing the chart. It initially dropped to the support level, aligning with the buyer zone at the lower boundary of the range. After spending some time trading near this level, the price dipped further into the buyer zone but quickly rebounded, rising to the upper boundary of the range. Following this, the price reversed and fell back into the buyer zone, where it consolidated for a while before climbing back into the range. Shortly afterward, Bitcoin rallied to the resistance level, corresponding to the seller zone, breaking out of the range and eventually surpassing the 104600 level to reach a new all-time high (109000 points). However, BTC then began to decline within a downward channel, where it broke below the 104600 level again and dropped to the channel’s support line. Although the price attempted to recover, it failed and rebounded from the seller zone back to the buyer zone. Subsequently, the price moved back into the channel, creating a false breakout, and continued its downward movement within the channel. Given the current structure, I anticipate that BTC might drop to the channel's support line before initiating a new upward movement. Based on this outlook, I’ve set my target price (TP) at 101300 points. Please share this idea with your friends and click Boost 🚀

"TRUMPUSDT ABCD Pattern Points to 200%-250% Potential Gains TRUMPUSDT has recently formed a strong ABCD pattern, a classic chart formation that often indicates a potential price reversal or continuation. The ABCD pattern is recognized for its precision and the clear path it suggests for future price movements. In the case of TRUMPUSDT, the pattern is unfolding with good volume, which is crucial for confirming the validity of this setup. With strong buy-side interest supporting the formation, the coin is gaining attention from traders looking for high-reward opportunities. The projected gains for this pattern are substantial, with expectations of a price surge in the range of 200% to 250% or more, provided the pattern plays out as anticipated.
The ABCD pattern in TRUMPUSDT suggests that after completing the initial phases of the pattern, the price is likely to enter a strong upward trend, especially as it nears the D point. The good volume accompanying this pattern is a positive indicator, as it shows that the market is behind this movement, and the setup could trigger a substantial breakout once the price breaks key resistance levels. Investors are already showing significant interest in this pair, which further validates the potential for an explosive move in the near future. Traders are advised to monitor key levels and entry points carefully to maximize the potential profit from this setup.
What makes the TRUMPUSDT chart particularly compelling is the confluence of technical factors. Along with the ABCD pattern, the strong volume and market interest suggest that the momentum could be on the verge of accelerating. If the price successfully breaks the resistance area around point D, it could quickly move higher and potentially retest previous highs, providing traders with the chance for massive returns. As the project gains more traction and investor confidence, the odds of this pattern materializing into a full bullish move increase.
In the broader context of the crypto market, the movement of TRUMPUSDT could be influenced by the trends of major altcoins and market sentiment. However, with the ABCD pattern setting the stage for potential gains, traders might find it a favorable time to enter the market. As always, patience and precision will be key to successfully capitalizing on this pattern. Keeping an eye on volume, key levels, and the overall market environment will be essential for anyone looking to make the most of this setup.

USDT Dominance Chart AnalysisUSDT dominance broke out of a long-term descending channel.
However, it is showing signs of rejection at nearly 4.60% and could head back towards support.
21-day MA (black line): Previously acted as resistance, but now provides some support.
100-day MA (purple line): Was breached, but is now being retested as support.
A red candle after the recent breakout suggests a possible failed breakout scenario.
The green arrow indicates a potential decline towards 4.20% or even lower.
Support: 4.20% (previous resistance, now potential support).
Low Support: 4.00%
Resistance: 4.60%
If you found this analysis helpful, hit the Like button and share your thoughts or questions in the comments below. Your feedback matters!
Thanks for your support!
DYOR. NFA

BTCUSDT Analysis BTC broke the downtrend line, and bullish momentum is on. The price bounced after the breakout point (green region) retest of $95,611, reaffirming firm support.
Hoping for a potential 6.76% return at $102,431!
The bulls will remain dominant if BTC stays above $95,611. A dip below this level will disrupt the setup.

Bad news... Tether Dominance is bullish!#usdt #tether dominance made W bounce in about 1 year period and in weekly candle stick size, #usdtd also formed bullish divergence. This movement seems not good for #crypto and #altcoins in mid term.

Tether Dominance still looks bullish#tether #usdt dominance chart the #usdtd looks bullish and may aid the wick it left upside. Bullish CRYPTOCAP:USDT dominance is bearish for #altcoins and #btc

Bitcoin can continue to fall in downward channel to 92K pointsHello traders, I want share with you my opinion about Bitcoin. Looking at the chart, we can see how the price declined from the support level a little below and then started to grow inside the upward pennant, where it at once broke the support level again and continued to move up. Later BTC reached a resistance level, which coincided with the seller zone, and even rose, breaking this level to 108700 points and then turning around. Price fell below the resistance level, but soon backed up and some time traded between this level until it reached the resistance line of the pennant and then started to decline. In a short time, the price fell below the resistance level, breaking it, and soon exited from the pennant also, after which continued to move down inside the downward channel. In the channel BTC rebounded from the support line and rose to the seller zone, where it some time traded and then continued to decline, breaking the 104500 resistance level again. Bitcoin fell into the buyer zone, where it turned around and made a strong impulse up to the resistance line of the channel. And recently price bounced from this line and continued to move down. So, I think that Bitcoin can move up and then fall lower than the support level, breaking it. For this case, I set my TP at 92K points. Please share this idea with your friends and click Boost 🚀

USDT Dominance + USDC Dominance 1WIMPORTANT!
CRYPTOCAP:USDT Dominance + CRYPTOCAP:USDC Dominance
These two dominances show us the cash position in the market. This is the crudest expression.
With the rise of this chart, we can see that there is an increase in cash transitions in the market or hot money inflows to the market.
In my previous post, I shared information that there may be a movement from the bottom to the falling trend line (red) above. Because this possibility was much higher. The reason was that it made a double bottom formation, supported by the rising trend line (green) and also pointed to a harmonic pattern.
With the OB level on the daily chart, the price retreated with the falling trend line (red) acting as resistance. With its retracement, the upward movement on the BTC side was realised. Because as it is known, this chart works in inverse correlation with the BTC chart.
If this chart continues its upward movement, that is, if it breaks the falling trend line and provides a movement towards 11% levels, then we can see much deeper declines on the BTC side.
Let me add one more comment to overlap here;
On the BTC side, I have been emphasising that I have an expectation of $123k - $130k for the first batch for a long time. So if this chart moves one round lower than these levels, to the bottom of the rising trend line (green), it is possible to see the levels I mentioned on the BTC side. Then again, the dominance chart will now move upwards and may cross the red line, which is the falling trend line, and move towards 11% levels.
Of course, there are other OB resistances on the route, and a pre-bullish retest will probably do. This gives misleading information that the decline on the BTC side is over.
If BTC really returns from the level I mentioned above and moves as I explained in this chart, there may not be a second spring in the market until it reaches 11% levels.

Called move after move for Bitcoin, what happens next?
If you been lucky enough to work out my analysis and pull the trigger on the trade setups that played out over and over again, I commend you for your knowledge of how to read an analysis and then use it to make an informed decision.
If you caught the last analysis I mentioned about a bear trap spike below the blue line and as you can see it played out. You can see I have removed the green trendline on left chart as it is now done with and the green trendline on the right hand side chart is basically invalidated now.
We see on the left chart the orange trendline is respected with the candle closing above it. The white major trendline also held as major support. You can see the other trendlines still being used, especially on 4 hour timeframe.
So, what now?
We need to watch for the right hand side RSI to breakdown under the red trendline for BTC to get to 108k.
On the left chart the RSI needs to break back above trendline. In regards to the price action, we can see a massive buy up in the crash candle that was just made. Price could move up to 108k from here now there are trapped short traders below. This would put the right USDT.D chart at the blue trendline and as per previous analysis we know what happens if that then breaks below this line.
On the bearish side, if price loses the light green vwap line then expect another retest of the white trendline.
Smash the like button and good luck!

Called move after move for Bitcoin, what happens next?If you been lucky enough to work out my analysis and pull the trigger on the trade setups that played out over and over again, I commend you for your knowledge of how to read an analysis and then use it to make an informed decision.
If you caught the last analysis I mentioned about a bear trap spike below the blue line and as you can see it played out. You can see I have removed the green trendline on left chart as it is now done with and the green trendline on the right hand side chart is basically invalidated now.
We see on the left chart the orange trendline is respected with the candle closing above it. The white major trendline also held as major support. You can see the other trendlines still being used, especially on 4 hour timeframe.
So, what now?
We need to watch for the right hand side RSI to breakdown under the red trendline for BTC to get to 108k.
On the left chart the RSI needs to break back above trendline. In regards to the price action, we can see a massive buy up in the crash candle that was just made. Price could move up to 108k from here now there are trapped short traders below. This would put the right USDT.D chart at the blue trendline and as per previous analysis we know what happens if that then breaks below this line.
On the bearish side, if price loses the light green vwap line then expect another retest of the white trendline.
Smash the like button and good luck!

$USDT February Local Top Hit!well well well... look at that.
TA PERFECTION 💯
Should I start charging for my calls? 😂
I couldn't imagine anyone not following my account at this point 🧐
(see prior USDT chart for the original call).

Bitcoin can exit from triangle and continue to fall nextHello traders, I want share with you my opinion about Bitcoin. By observing the chart, we can see that the price started to grow inside the upward channel, where it at once rebounded from the resistance line of the channel and fell to the support line. Then BTC broke the support level and rose in a short time to the resistance line of the channel and then it started to decline. Bitcoin fell to the support level, which coincided with the buyer zone, thereby exiting from the channel and after it some time traded between 94250 level, it fell to 90850 points. Next, the price impulsed and continued to grow inside the upward triangle, breaking the support level again. Later it reached the even resistance level, which coincided with the seller zone. Soon, BTC broke the 104700 level, rose to the resistance line, and then fell back and continued to trades between the 104700 level. Later BTC broke this level and fell below, after which turned around and quickly rose to the resistance line of the triangle and then dropped to the support line, where at the moment continues to trades close. So, in my mind, I think that Bitcoin can move up and then exit from the triangle and continue to decline to the 94250 support level. For this case, I set my TP at this level. Please share this idea with your friends and click Boost 🚀

USDT Dominance is bouncing!#usdt #tether dominance has been defended the support zone very well above green line i drew on chart and now there' s chance that #usdtd may have a hard bounce. The invalidation: CRYPTOCAP:USDT dom. loses the green line with weekly closings.

Ethereum is more bullish than everBullish divergence on daily RSI, falling wedge support & the bullish daily candles make #ethereum supper bullish to me..

USDTDOMINANCE CHART UPDATE !The chart highlights USDT dominance (USDT.D), which is used to measure market sentiment and money flow into or out of stablecoins such as USDT
The chart shows a completed “head and shoulders” pattern, which is often considered bearish in technical analysis.
The neckline has been broken, indicating the possibility of further declines.
The price appears to be testing a descending triangle, which could indicate a continuation of the decline.
The green area below (possibly around 2.5%-3%) could act as a crucial support if dominance continues to decline.
The 50-day (red) and 200-day (green) moving averages are plotted.
Dominance is trading below both moving averages, which reinforces bearish momentum.
A breakdown of the current triangle could lead to further declines towards the marked support area.
If you found this analysis helpful, hit the Like button and share your thoughts or questions in the comments below. Your feedback matters!
Thanks for your support!
DYOR. NFA

Here's the Analysis of $JUPHere's the Analysis of LSE:JUP
#JUP is in a large consolidation range and Price has already nearly got it reacted from the major support zone of $0.65 - $0.69. Price is already at resistance and might dump a little, a flip-over of $1.14 will be a good buy towards the resistance area of $1.42 - $1.46.


Bitcoin will break support level and continue to declineHello traders, I want share with you my opinion about Bitcoin. By observing the chart, we can see that the price a few moments ago rebounded from the support line, which coincided with the support level with the buyer zone and rose to the resistance line. After this, BTC rebounded from this line and dropped back to the support line, breaking the 93400 level, and soon rebounded up, breaking this level one more time. Later BTC rose to the resistance line and then fell to 90850 points, after which made a strong impulse up, breaking the 93400 level with the resistance line too. Then price continued to move up inside Pennant, where it broke the 102700 current support level, made a retest, and then tried to grow more, but failed and made correction below the 102700 level. After this movement, BTC turned back and rose to 109600 points (new ATH) and then made a correction movement one more time. Price fell to the support line of the pennant and then in a short time rose to the resistance line and recently it fell and exited from the pennant. In my opinion, the price can fall to the current support level, break it, and then continue to decline, therefore I set my TP at 99K points. Please share this idea with your friends and click Boost 🚀

HBAR is currently trading at equilibrium.Using my "grafting" trading technique, HBAR is currently trading exactly at the point of equilibrium. This could be either bullish or bearish, depending on the pattern, but it appears that HBAR could potentially drop down to #4 on the wave count, sweeping the lows before making a significant move to the upside.
Nothing in trading is guaranteed, but this pattern plays out in the same fashion frequently.
Good luck, and always use a stop loss!

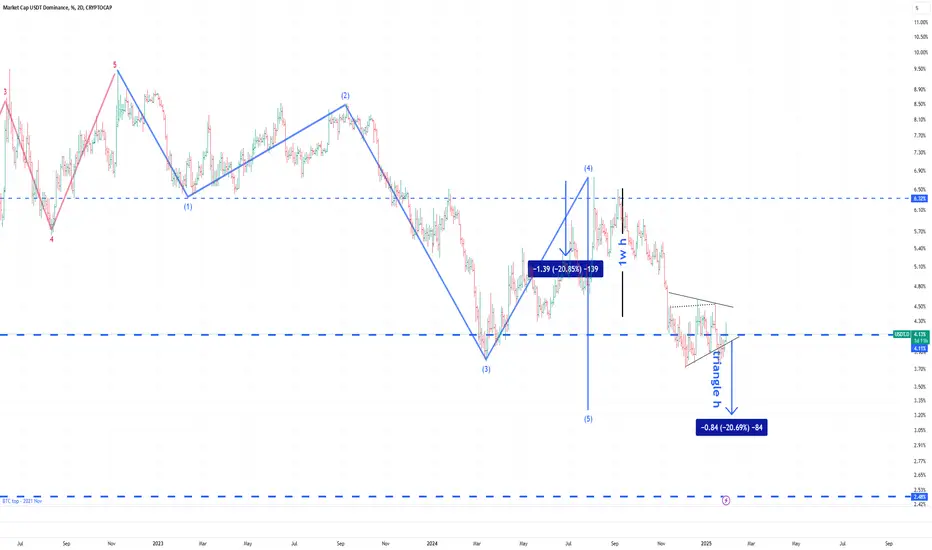
Key to upcoming price action pathHere are 2024 September - November USDt rally metrics:
66 days, 4.6 Trillions volume.
The first sub wave of micro degree is 1.39 points or 20.85% length.
The third sub wave of micro degree is 2.32 points or 35.7%. Which led to +89% at BTC, from 52k to 99k.
The triangle in fourth position has 0.75 points - 16.77% min basement or 0.97 - 20.69% max height. Triangles usually precede the last wave in the direction of the main trend. The terminal point for this triangle may reach 3.15% dominance and last in approximately the next 80 days.
The dominance of USDt on RSI 2D TF signals a downward divergence.
I think the signal line could reach ~22% before meeting the support trend line and reversing. It is -18% from the current point.
These values coincide with trend lines on Bitcoin, about 155k, or +55% from the current point.
Dodgecoin in percentage terms does move about 2x further.
This is a third confirmation proving upcoming rise in all crypto assets.
keep in mind that there is always place for an alternative waves count, but i bet that the analysis results worth millions!
So, wish you safe trading, fat profits and see you again :)