USDT.DUSDT Dominance (4H) Analysis
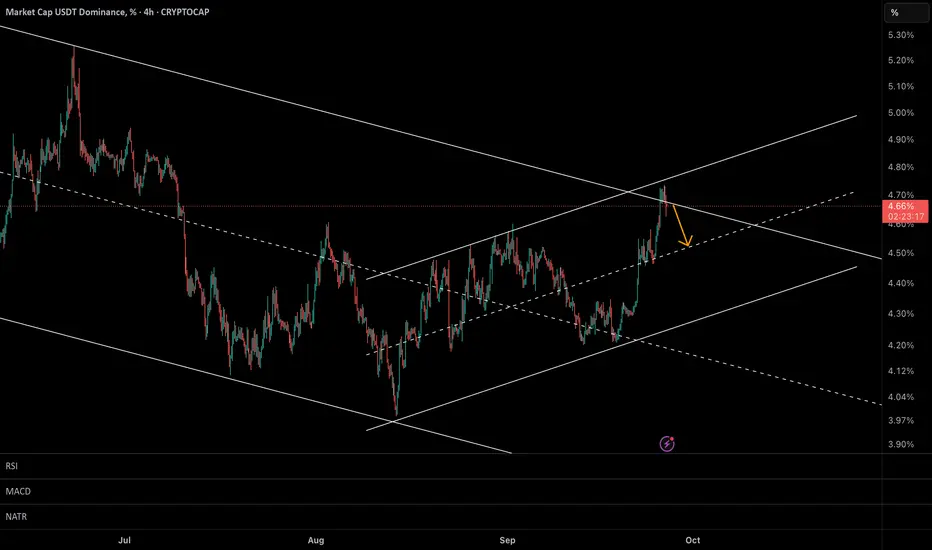
After a strong upward move, USDT dominance is currently retracing from its recent high. The market shows signs of short-term correction, and I expect price to reach the following potential support levels:
4.71% – minor support, possible reaction zone.
4.60% – key short-term level; if broken, further downside likely.
4.50% – next significant support area.
4.43% – deeper correction target if bearish momentum continues.
If dominance holds above 4.60% and forms a bullish structure, we might see another leg up. Otherwise, continuation toward the lower levels seems likely.
Usdt

Understanding the Money Flow in the Coin Market
Hello, fellow traders!
Follow me to get the latest information quickly.
Have a great day!
-------------------------------------
(USDT 1D Chart)
(USDC 1D Chart)
I believe that USDT and USDC show a gap up trend when funds flow into the coin market, and a gap down trend when funds flow out.
Therefore, unless the gap turns into a downtrend, the coin market is expected to maintain its upward trend.
-
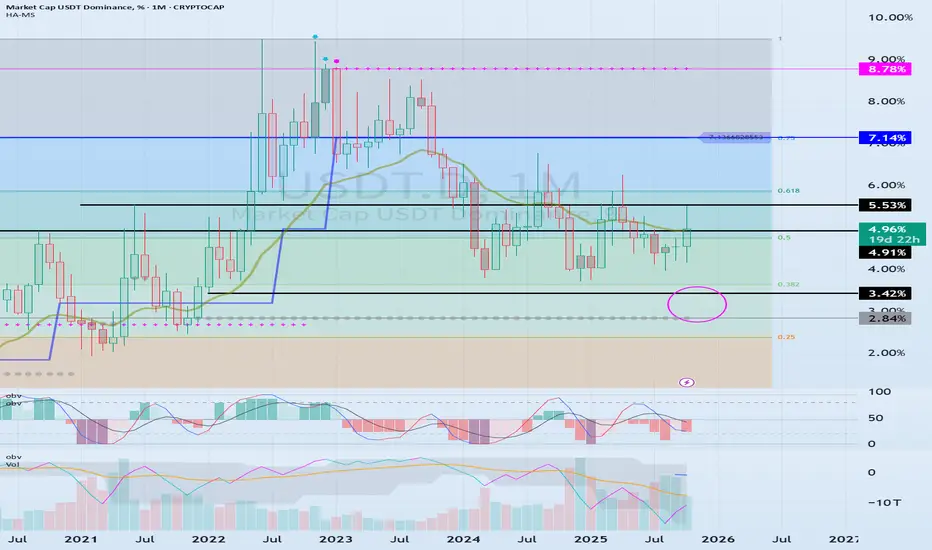
(USDT.D 1D Chart)
(1M Chart)
As funds flow into and out of the coin market through USDT and USDC, USDT dominance is likely to ultimately rise.
However, I believe that the funds (USDT, USDC) flowing into the coin market will change dominance through trading.
In other words, if USDT dominance declines, the coin market is likely to trend upward.
This is because coins (tokens) are being purchased with USDT.
If USDT dominance remains below 4.91 or declines, the coin market is likely to trend upward.
Therefore, if USDT dominance rises without any evidence of fund outflows through USDT or USDC, it can be interpreted as a temporary increase in selling pressure.
If USDT or USDC gaps downward in this situation, the price will fail to defend, leading to a downward trend in the coin market.
Therefore, it's best to look at the USDT and USDT.D charts to understand the general flow of funds.
-
(BTC.D 1D chart)
(1M chart)
I believe BTC dominance reflects the relationship with altcoins, rather than the rise or fall of the coin market or the rise and fall of BTC itself.
In other words, rising BTC dominance indicates a concentration of funds toward BTC, increasing the likelihood that altcoins will gradually move sideways or experience a downward trend.
Therefore, for an altcoin bull market to begin, it must remain below 55.01-62.47 or show a downward trend.
Therefore, it is recommended to check BTC dominance before trading altcoins and develop a trading strategy.
--------------------------------------------------
Summary of the above:
For the coin market to continue its bull market,
1. USDT and USDC must maintain a gaping upward trend.
2. USDT dominance should decline below 4.91.
3. BTC dominance should decline below 55.01.
-
Thank you for reading.
I wish you successful trading.
--------------------------------------------------
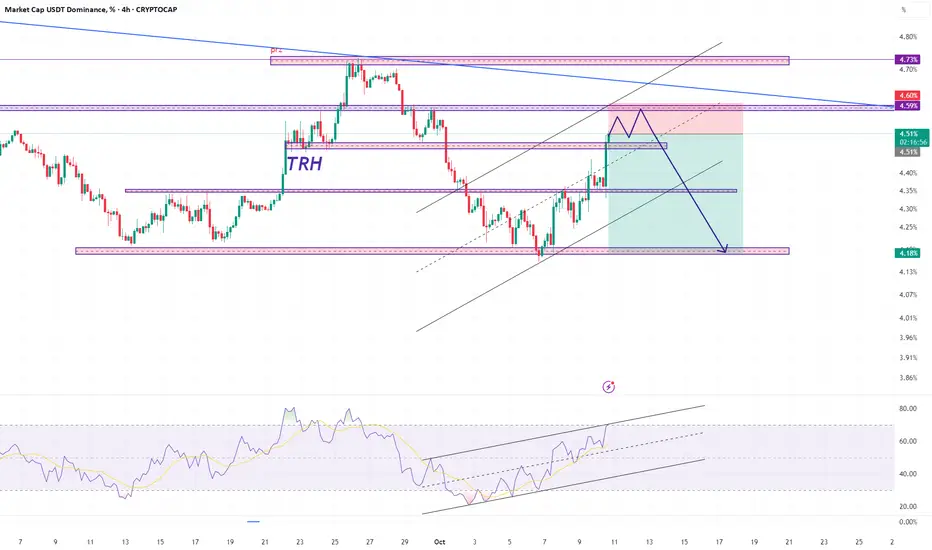
usdt.d 4hHello friends, I am Mehdi.
Given the area, we expect a price correction from this area trh.
Reasons:
We are in the area trh.
There is a possibility of approaching the channel ceiling and then correcting the price.
The resistance at 4.60 is a good place to buy.
I would like to thank you for supporting me by liking and commenting.
And please state your desired currency for analysis.
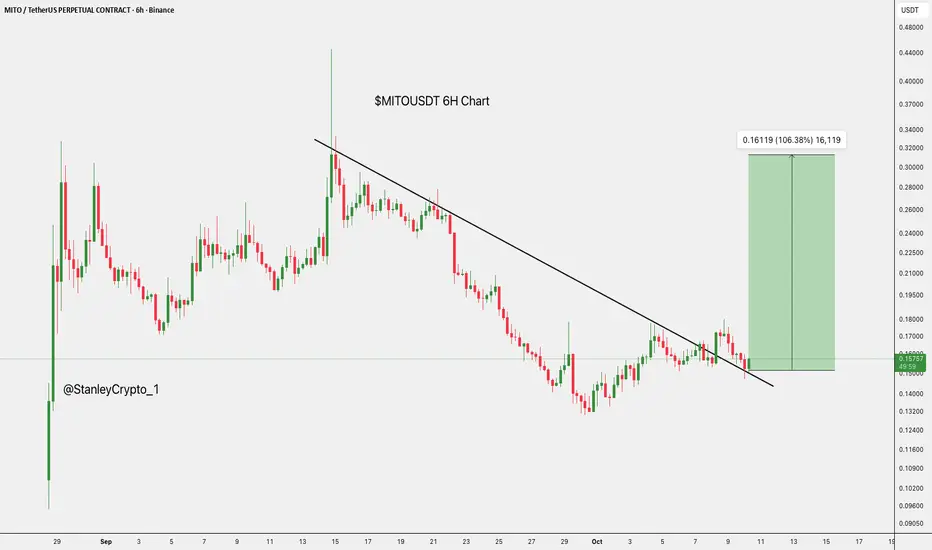
$MITO Breakout Alert: Bullish Reversal in Play.$MITO/USDT has broken above its downtrend line, hinting at a possible bullish reversal.
With momentum building, the price could target around $0.32654, a potential 100%+ gain from current levels near $0.15766.
DYOR, NFA
NEIRO Update📊 NEIRO Update
NEIRO is testing the red resistance zone 🔴
If it breaks out, the first target will be the green line level 🟢

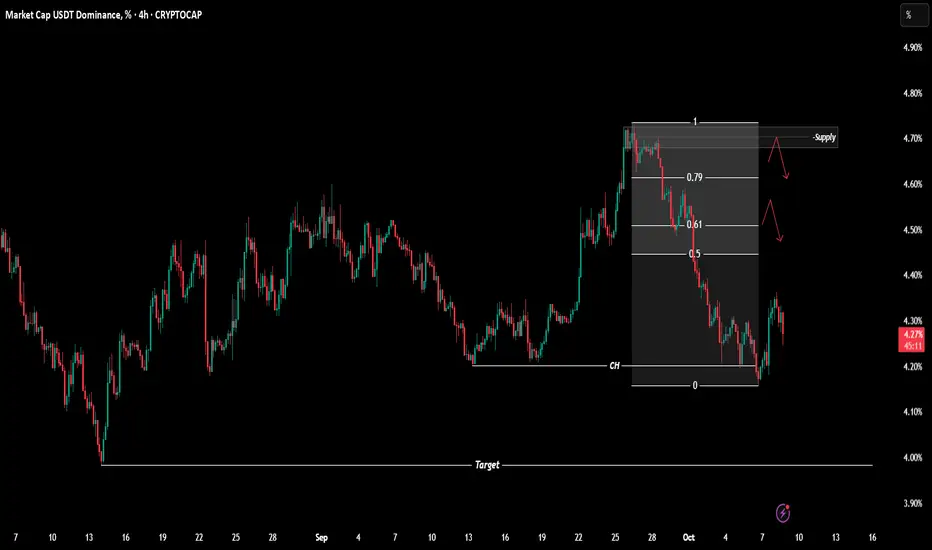
$USDT.D Analysis - Oct 8 | 4H Time FrameCRYPTOCAP:USDT.D Analysis - 4H
Hello and welcome to another analysis from the Satoshi Frame team!
I’m Abolfazl, and today we’re going to analyze Bitcoin on the 4-hour timeframe.
USDT dominance has shown a trend reversal on the 4-hour timeframe and has turned bearish.
The OTE zone and the marked supply area could act as potential rejection zones if dominance makes a short-term pullback upward.
On the other hand, we could also see another drop from the current level, moving toward the lower support area near the recent low.
The main target (4%) is already marked on the chart.
See you in the next analyses!
Stay tuned with the Satoshi Frame team...
THE LAST ALV CHART: Binance + Burning the Key — 2025 Will Be ...ALV/USDT Final Chart — The Golden Setup for 2025
After consistent daily updates, this could be the final and most powerful ALV chart leading into 2025.
There’s a strong probability that ALV will target $0.50 on its way toward a $1.70 high in 2025.
As long as the price remains well above the secure zone around $0.11, ALV stays technically bullish and positioned for another breakout — whether early or late in the next cycle. The setup is now confirmed for a solid swing trade into 2025.
There’s also growing speculation that Binance may list ALV, especially following the surge in Binance Alpha volume. Combined with the potential for the team to burn more token supply, the technicals and fundamentals align perfectly — making ALV one of the most promising breakout candidates for 2025.
🔥 ALV could truly be the golden chart of the year.

$SUSDT Breakout Alert: Bullish Reversal in Play.$S just broke out of a long falling wedge, signalling a possible bullish reversal.
MACD is turning positive, adding momentum to the move.
If price holds above the breakout zone, it could rally toward $0.8808, nearly 195% higher than current levels.
DYOR, NFA

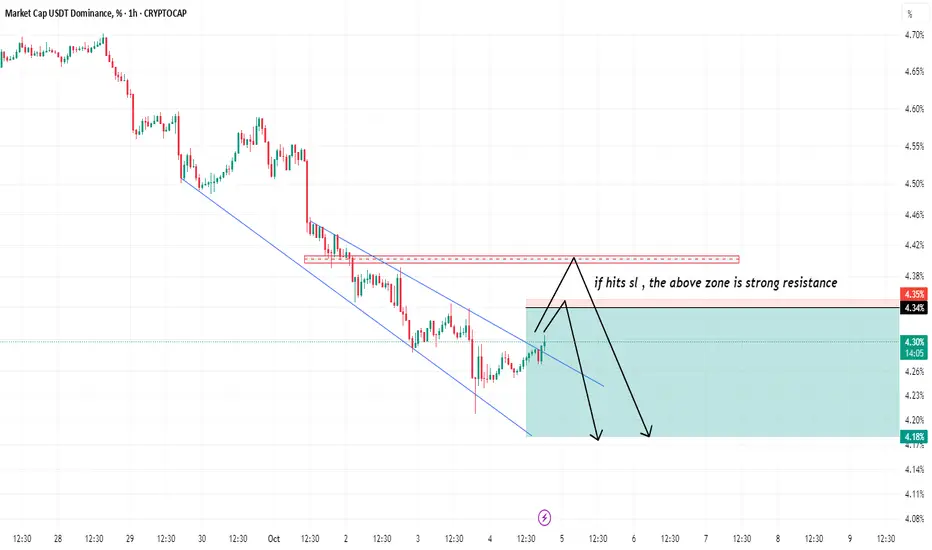
USDT.D 4H Analysis - Key Triggers Ahead☃️ Welcome to the cryptos winter , I hope you’ve started your day well.
⏰ We’re analyzing USDT Dominance on the 4-Hour timeframe .
👀 On the 4-hour timeframe, USDT Dominance has started to recover after its recent drop, bouncing from the support zone at 4.17% and now moving upward, forming a reaction to the previous bearish leg. The structure shows a steep descending trendline, and once broken and confirmed above, dominance could move toward its next resistance zones and enter a correction phase relative to its previous leg. The key resistance levels to watch are 4.33% and 4.38%.
🧮 The RSI oscillator currently faces a static resistance around 45. If volatility pushes above this level and holds, it would confirm bullish momentum and act as a signal for correction continuation.
🕯 The recent candles on Tether Dominance have shown range-bound behavior with weakening bearish pressure, while the 4.17% support has attracted buyers — causing an increase in bullish candles and momentum toward upper resistance zones. A breakout above the descending trendline could confirm a corrective move upward, which seems quite plausible given the current 4H candle structure.
🧠 For profit-taking strategies, you may consider securing partial profits from your open long positions, or moving your stop-losses into profit to protect gains. Meanwhile, start refreshing your watchlist and identifying new price triggers so that you can re-enter positions after reaction or breakout confirmations from upcoming setups.
❤️ Disclaimer : This analysis is purely based on my personal opinion and I only trade if the stated triggers are activated .

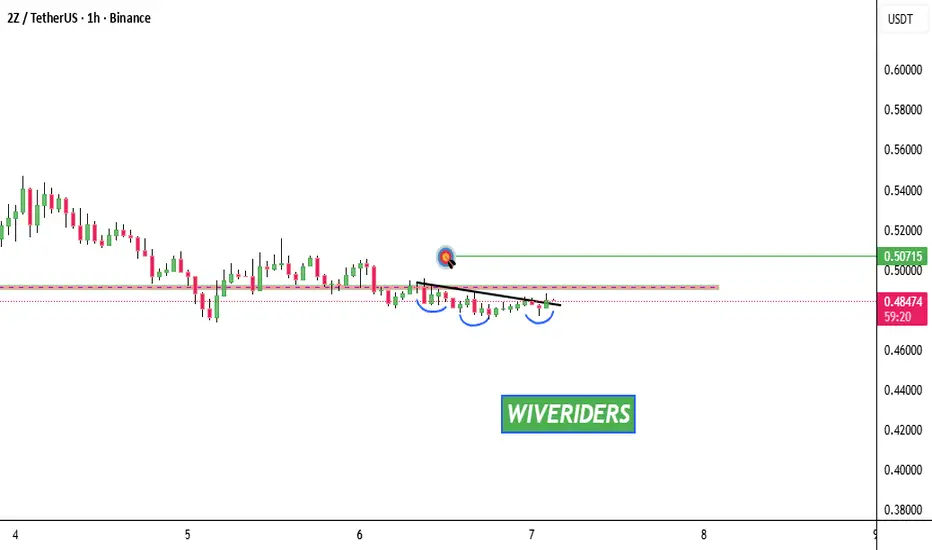
2Z Update📊 $2Z Update
$2Z is testing the red resistance zone 🔴
If it breaks out, the first target will be the green line level ✅
Bitcoin - Bitcoin Breaking Previous Highs!Bitcoin is above EMA50 and EMA200 on the four-hour timeframe and is in its medium-term ascending channel. In case of a downward correction towards the specified demand zones, it is possible to buy Bitcoin with a better risk-reward ratio.
It should be noted that there is a possibility of heavy fluctuations and shadows due to the movement of whales in the market and capital management in the cryptocurrency market will be more important. If the downward trend continues, we can buy within the demand range.
Bitcoin has surged to $125,000, marking the first time in history its market capitalization has exceeded $2.5 trillion.This new record reflects growing investor confidence and renewed capital inflows into the crypto sector—further solidifying Bitcoin’s dominance as the world’s leading digital asset.
Following the IRS’s clarification of the Corporate Alternative Minimum Tax (CAMT) rules, U.S. companies can now benefit from significant tax advantages, potentially saving billions of dollars in unrealized crypto gains.
The U.S. Treasury Department and the IRS issued temporary guidance on September 30 that substantially reduces the tax burden for corporations holding Bitcoin and other digital assets. The new rules explain how the CAMT applies to unrealized gains, a topic that had long concerned corporate treasurers.
The primary goal of these changes is to lower compliance costs and clarify how Adjusted Financial Statement Income (AFSI) should be calculated as the base for CAMT. Companies can immediately apply these temporary exemptions, and similar provisions are expected to appear in future permanent regulations.
The CAMT—introduced under the Inflation Reduction Act of 2022—imposes a minimum 15% tax rate on corporations reporting at least $1 billion in average annual AFSI. Without the new clarification, unrealized crypto gains could have been directly included in AFSI calculations, resulting in substantial paper tax liabilities for large firms.
The change has already affected Strategy Inc. (formerly MicroStrategy), a company that holds over 640,000 Bitcoin. Under the new accounting standards effective January 2025, Strategy will report its Bitcoin holdings at fair market value, with unrealized gains and losses recognized quarterly in its financial statements.
Previously, analysts expected Strategy to become subject to the CAMT in 2026, potentially facing billions in taxes on unrealized Bitcoin profits. However, the new guidelines allow the company to exclude those unrealized gains from AFSI calculations. As a result, Strategy no longer anticipates paying CAMT on its $16 billion Bitcoin reserve, easing the financial pressure on its long-term Bitcoin accumulation strategy.
Given that over 100 publicly traded companies collectively hold more than 1 million Bitcoin, this regulatory shift could further strengthen Bitcoin’s role as a corporate store of value.
Meanwhile, Morgan Stanley, the U.S. investment banking giant, announced that it will support its 16,000 financial advisors—who collectively manage over $2 trillion in assets—in offering clients access to Bitcoin and other cryptocurrencies if they choose to invest.
In a separate development, Andrew Bailey, the Governor of the Bank of England, emphasized that blanket opposition to stablecoins—without considering their real-world use cases or technical frameworks—is misguided.
Elsewhere, the crypto subsidiary of Japan’s SBI Group suffered a cyberattack last week, resulting in the theft of approximately $21 million in digital assets. According to blockchain researchers, including ZachXBT, suspicious withdrawals were detected across several assets such as Bitcoin, Ethereum, Litecoin, Dogecoin, and Bitcoin Cash.
Experts report that the stolen funds were laundered through several crypto exchanges and then funneled into Tornado Cash, a well-known mixing service designed to obscure transaction origins. The pattern of this attack closely resembles operations attributed to the Lazarus Group, a hacking organization believed to be backed by the North Korean government.
Analysts warn that continued use of tools like crypto mixers not only heightens direct market risks but is also likely to trigger tighter regulatory scrutiny worldwide, potentially restricting the free flow of digital assets across borders.

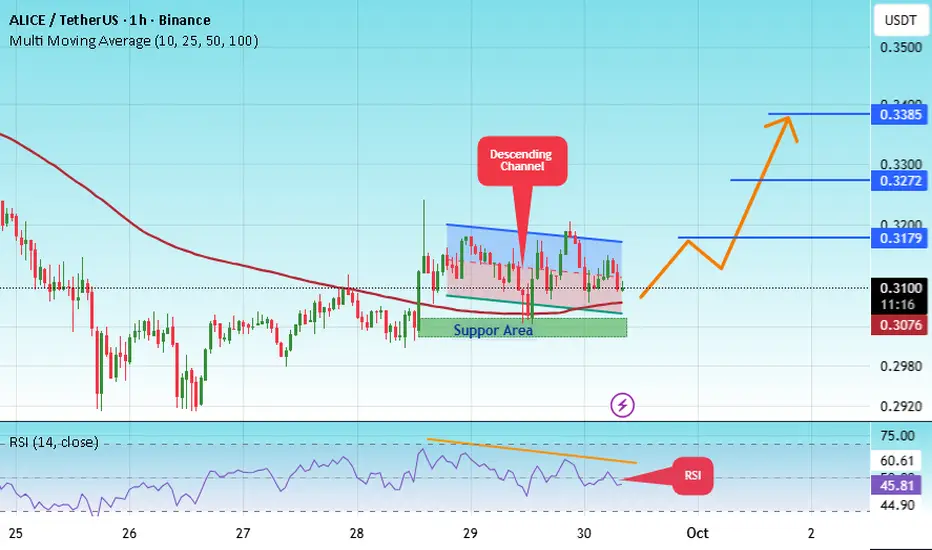
#ALICE /USDT — Descending Triangle at Demand Zone!
#ALICE
The price is moving within a descending channel on the 1-hour frame, adhering well to it, and is heading for a strong breakout and retest.
We have a bearish trend on the RSI indicator that is about to be broken and retested, which supports the upward breakout.
There is a major support area in green at 0.3040, which represents a strong support point.
We are heading for consolidation above the 100 moving average.
Entry price: 0.3070
First target: 0.3180
Second target: 0.3272
Third target: 0.3385
Don't forget a simple matter: capital management.
When you reach the first target, save some money and then change your stop-loss order to an entry order.
For inquiries, please leave a comment.
Thank you.
#BTCUSDT Let Bitcoin make a new ATH#BTC
The price is moving in a descending channel on the 1-hour frame and is expected to break and continue upward.
We have a trend to stabilize above the 100 moving average once again.
We have a downtrend on the RSI indicator that supports the upward move with a breakout.
We have a major support area in green that pushed the price higher at 121,500.
Entry price: 122,200.
First target: 122,800.
Second target: 123,400.
Third target: 124,200.
To manage risk, don't forget stop loss and capital management.
When you reach the first target, save some profits and then change your stop order to an entry order.
For inquiries, please comment.
Thank you.

usdt.dHello, I am Mehdi.
According to the previous analysis, the market has continued to the range we are waiting for. In this area, we should wait for the formation of a pattern to continue the path.
Therefore, it is recommended to keep an eye on the market with a 70% profit margin.

usdt.d 30minHello friends
I am Mehdi, according to the Tether Dominance chart and the full targeting of the previous analysis in the 4-hour timeframe
According to the new analysis, I think the price is expected to reach the range of 4.49
1 Because the 4.57 level was broken with a strong candle in the 4-hour timeframe and now the price is rejecting this level
2 We are at the 382 fibo level
3 RSI divergence
Thank you for supporting me by liking and commenting and sharing this analysis

usdt.d 4hHello friends
I am Mehdi and I wanted to say that if you are currently in profit compared to the position we announced
It is better to have a save profit and move the stop loss to the entry point
I would appreciate it if you support me with likes and comments

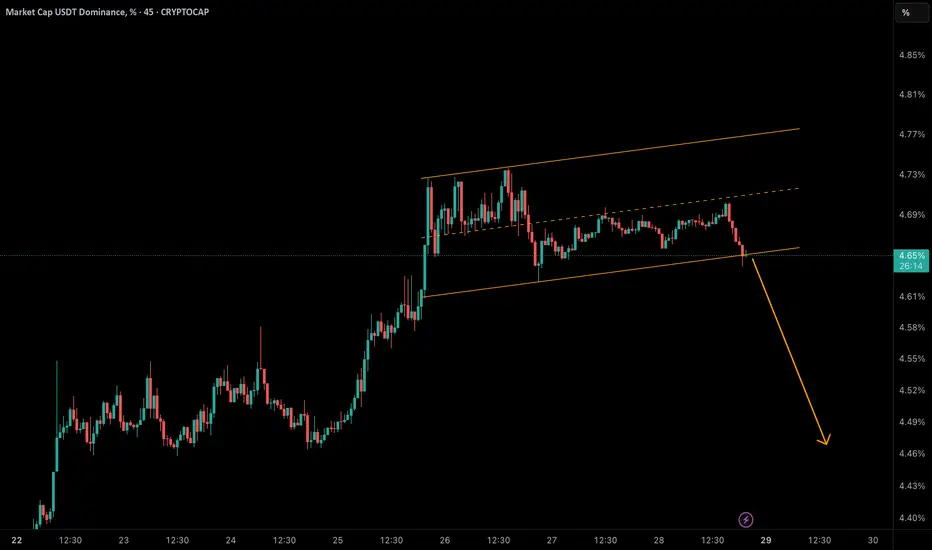
USDT Dominance at a Critical Breakout Point!USDT dominance has touched the bottom of its rising channel near 4.65%.
• 🔻 A breakdown below this support could trigger a correction toward 4.58% → 4.50% → 4.45%.
• 🟢 But if buyers defend this zone and reclaim 4.70%, we may see another push toward 4.75% – 4.77%.
📈 Why it matters: Falling USDT dominance often signals liquidity flowing back into crypto & altcoins, potentially sparking short-term rallies.
USDT Dominance Eyes Continuation After Double BottomUSDT dominance (USDT.B) on the daily timeframe has shown a strong shift in momentum. After breaking the trendline, price action confirmed a double bottom formation, pushing dominance steadily upward. Right now, there’s a small chance of a retracement around the 4.56% area, where order flow could reset before continuation.
Technically, the chart has already posted two lower highs, forming a bullish setup that favors another higher low before moving higher. If dominance keeps climbing, the crypto market may face strong selling pressure—Bitcoin and altcoins could bleed in the coming week.
However, the invalidation point sits below 4.2%. A breakdown from that level would signal weakness, potentially giving relief to Bitcoin and altcoins for an upward move.
👉 Keep an eye on 4.56% for a possible bounce and 4.2% as a key invalidation. The next few sessions may decide whether USDT dominance continues its bullish leg or offers crypto traders a breather.

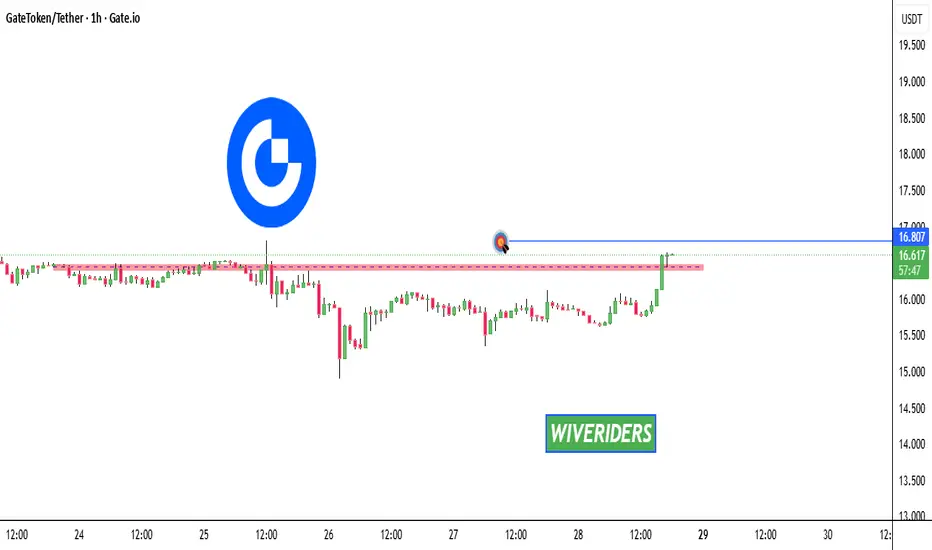
GT Market Update📊 GT Market Update
GT has broken out of the red resistance zone 🔴
The first target is now the green line level 🎯
#USDT.D (4H Chart)#USDT.D
(4H Chart)
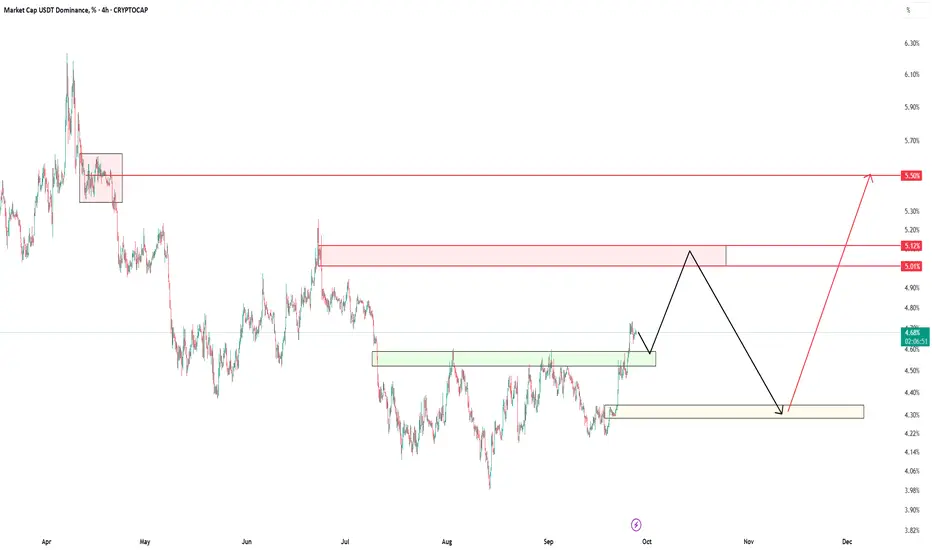
🔹️ USDT Dominance Analysis 🔹️
USDT dominance usually moves in the opposite direction of Bitcoin — when Bitcoin rises, this index tends to fall, and vice versa.
🟢 Green Box (Current Support)
The current support level for USDT dominance is in the green box: 4.60 – 4.50%.
We expect the price to move toward this level first, and after touching it, head toward the red box.
🟥 Red Box (Main Resistance)
The red box is at 5.00 – 5.12%.
This is the first and most important resistance level ahead.
After reaching this level, a correction is expected back toward the yellow box.
🟡 Yellow Box (Key Support)
The yellow box sits at 4.30%, which is a strong support area.
Once this level is tested, a major bullish move in USDT dominance is expected, targeting around 5.50%.
🎯 Final Target
When USDT dominance reaches 5.50%, the crypto market will likely be near its price bottoms.
💡 These bottoms could approximately align with Bitcoin around $85,000 and Ethereum around $3,000.
🆔 @RasoolAhmadi
usdt.d 4husdt.d 4h
🔎 A few notes from the chart:
The chart is located on the PRZ (Potential Reversal Zone) or the harmonic pattern completion zone.
The candles have reached an important resistance zone after rising.
At PRZ, we usually expect a reversal (return to the bottom), especially when it overlaps with Fibonacci levels and the trend line.
It is characteristic that a green rectangle (probably a sell position) has been drawn on the chart, which indicates that we expect a decline.
📌 Conclusion:
Due to the harmonic structure + PRZ support, the probability of a price reversal and a downward move is higher ✅

USDT Dominance at a Critical Turning Point–Will Correction BeginIn my previous analysis, I highlighted that USDT dominance had likely completed a 5-wave Elliott structure around 4.60%–4.65%, suggesting that a corrective ABC decline could follow.
That call played out accurately, with dominance stalling right at the projected resistance zone.
🔎 Current Update:
• Price has now hit the top of the larger descending channel as well as the upper boundary of the short-term rising channel → creating a confluence resistance near 4.70%.
• This level remains a high-probability reversal zone.
📊 Scenarios:
• 🔻 Bearish (More Likely):
Rejection from 4.65%–4.70% could confirm the corrective ABC pattern, targeting 4.30%–4.20% next.
👉 This would signal capital rotation back into crypto & altcoins.
• 🟢 Bullish (Alternative):
A confirmed breakout above 4.70% would open the door toward 4.90%, extending pressure on the crypto market.
⸻
📌 Conclusion:
Given the technical confluence, the odds still favor a pullback in USDT dominance, which could give altcoins some room to breathe in the coming sessions.