Critical USDT.D Test: Altcoin Relief or More Pain?USDT dominance is pushing into its long-term trendline resistance again. If this level rejects, it usually signals fresh money rotating back into altcoins.
But if USDT.D breaks out and holds above the trendline, it could put pressure on alts and slow down their momentum.
This is a key spot for the altcoin market.
DYOR, NFA
Please hit the like button if you like it, and share your views in the comments section.
Usdtdominance

USDT DOMINANCE ANALYSIS (2D)Hello.
I'd like to share my ideas about USDT Dominance today.
When I start to analyze a chart, the first thing I do is look at past events and patterns.
As I can see, around August 2025, USDT completed its double zig-zag corrective move.
Now we're seeing that the entire market is bleeding, and of course this parameter is also moving in the opposite direction of the market.
Due to its nature, it's easy to analyze the entire market by looking at this parameter alone.
We realize that after the first change of character around the market, this parameter began forming a five-wave impulsive movement. October 10th also confirms this idea in a way.
As anyone who knows about Elliott Theory understands, there are many possibilities when a sudden crash appears in the market. That's the reason why I waited patiently to update my thoughts on this chart.
At the moment, I'm almost sure that what we're seeing here is another five-wave impulsive upward pattern.
The good news is that we are about to see this bleeding in the market come to an end.
The reason is simple: volume.
As you can examine on the chart, volume has been decreasing for days now.
Even if it's not the end of wave 5 yet, we are going to see this parameter drop significantly in the coming weeks — possibly with an A-B-C zig-zag or a double zig-zag pattern.
The orange line on the chart represents an ascending channel. When it breaks, it will also confirm a change of character in the entire market. What I expect is that when this happens, we’ll most likely see a drop of around -20% in this parameter. This will allow the market to recover from its ashes once more.
Thanks for reading.

New update on Tether Dominance (4H)Based on the previous analysis, which you can see in that post (), the price did not move above the defined supply zone and headed downward. We have now analyzed Tether Dominance on the four-hour timeframe.
Now it seems it may have another drop ahead and move toward the green zone. The best area for a rejection is the red zone.
This would make Bitcoin and some altcoins more bullish.
As long as this index has not reached the green zone, look for buy/long positions.
For risk management, please don't forget stop loss and capital management
When we reach the first target, save some profit and then change the stop to entry
Comment if you have any questions
Thank You

USDT Dominance#USDT_dominance, after reacting to the 6.07% resistance zone, may continue its corrective move toward the static support near 5.5%. Such a decline would generally support a more bullish environment for the overall crypto market.
Once price reaches this key level, market conditions must be reassessed:
A break below the 5.5% support would signal further downside for USDT dominance and could lead to a stronger and broader market-wide rally across crypto assets.

ALTS HAVE ROOM TO THE DOWNSIDE.Alt's need retail participation to thrive.
If Global Liquidity tightens, #BTC rolls over into 4 year cycle lows (q4 2026)
BTC.d will rise along with Stablecoin dominance.
This inverted chart shows a well formed Head and Shoulders that is about to test again a key level of significance.
I DO NOT expect it to hold.

FireHoseReel | USDT.D : The Next Major Crypto Wave Is Starting🔥 Welcome to FireHoseReel!
Let’s dive into the USDT Dominance (USDT.D) market structure.
👀 USDT.D – 4H Overview
After a strong bullish rally, USDT Dominance has fully retraced its entire move and is now losing a key support zone. This is one of those levels you shouldn’t pass without a position — it’s a critical decision area.
🧮 RSI Analysis
The USDT Dominance RSI has formed an oversold zone around the 33 level. A breakdown and sustained move below this zone could trigger mass USDT selling and strong buying pressure in Bitcoin and altcoins.
✍️ Current Scenario for USDT Dominance (Simple Setup)
🟢 Long Scenario for the Crypto Market:
A clear break and candle close below 5.934%, ideally accompanied by RSI breaking below the 33 level, would confirm momentum. In that case, the move is expected to accelerate, and we’ll likely spend less time inside the position due to high volatility.
❤️ Risk Management & Emotional Discipline
Crypto trading is highly risky. Without proper risk management and emotional control, trading becomes no different from gambling.
Logic must always come before emotions. Learn to manage your trades and enjoy the process with control and discipline.

USDT dominance is back at a strong rejection zone!USDT dominance is back at a strong rejection zone.
If it drops from here, altcoins can start moving up again.
Watching for a fall toward 5.5% → 5.0%. 👀

FireHoseReel | USDT Dominance at a Critical Turning Point🔥 Welcome to FireHoseReel !
Let’s dive into the USDT Dominance (USDT.D) analysis.
👀 USDT.D 1H OverView
USDT dominance moved higher after breaking our key level and is now facing a rejection near 6.491%.
⚡️ Fibbo Retracement
We have applied Fibonacci retracement from the recent low to the high, which clearly highlights the critical levels.
Forming a higher low on these zones could confirm a renewed bullish continuation in dominance.
However, a break below the 0.618 Fibonacci level and the formation of a lower low could act as an early trend reversal signal, forcing us to shift our multi-timeframe market bias.
❤️ Risk Management & Emotional Discipline
Crypto trading is highly risky. Without proper risk management and emotional control, trading is no different from gambling.
Logic must always come before emotions. Learn to manage your trades—and enjoy the process of trading with control and discipline.

FireHoseReel | USDT Dominance Is Loading a Market Shakeout🔥 Welcome To FireHoseReel !
Let's dive into DominanceUSDT Structure .
🎯 After breaking its bullish curve, USDT Dominance formed a higher low on the 4H timeframe compared to the previous bottom.
A sharp drop alongside a strong Bitcoin rally was needed to break its supports — but that scenario did not happen.
🌪 USDT.D has now broken its descending trendline and is facing resistance at 6.073%.
A breakout above this zone could restart a broader market correction and trigger a retest of the 4H high.
🧮 On the 1H timeframe, RSI has formed an overbought level.
A momentum break above this zone could drive USDT dominance sharply higher.
💡 Summary: USDT dominance still has bullish strength.
If it continues to move upward, our short position triggers could become active.
🛞 Risk Management & Disclaimer
Please remember to always use proper risk management and position sizing. Nothing in this analysis is financial advice. The market can change quickly, so always trade based on your own strategy, research, and risk tolerance. You are fully responsible for your own trades.

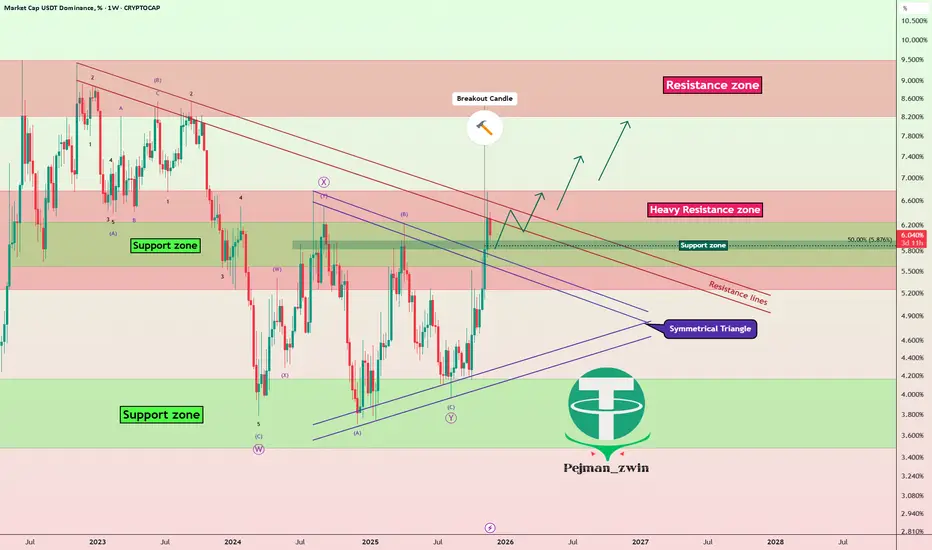
USDT Dominance% Breakout: Crypto Correction Not Over?Today, I’m going to analyze Market Cap USDT Dominance%( CRYPTOCAP:USDT.D ) on the weekly timeframe for you. The reason I want to analyze USDT.D% is that the crypto market conditions have become a bit complex lately, and many factors are influencing it. Therefore, it’s better to take a look at the weekly chart of USDT.D%.
Currently, it seems that USDT.D% is in the vicinity of a Heavy Resistance zone(6.78%-5.25%), but at the same time, there’s also a Support zone(6.24%-5.57%) that could potentially lead to an increase in USDT.D%.
From a classical technical analysis perspective, we can clearly see on the weekly chart that the upper lines of the symmetrical triangle have been broken, and it seems that USDT.D% is currently pulling back to those upper lines. As long as it doesn’t move below those lines again, we can still expect that the market correction is ongoing and hasn’t ended yet. This is a sign that helps us gauge whether the crypto market correction is complete or still ongoing.
From an Elliott Wave perspective, with the breakout of the symmetrical triangle, it seems that USDT.D% might be starting a new impulsive wave.
Since we’re not seeing Regular Divergence(RD-) at the highs, it indicates that the recent upward movement in the crypto market, especially Bitcoin’s( BINANCE:BTCUSDT ) recent gains, is still part of the correction phase.
In conclusion, based on the above analysis, I expect USDT.D% to rise again. If USDT.D% breaks through the resistance lines, we can hope that it will also break through the Heavy Resistance zone(6.78%-5.25%), and that would be a negative sign for the crypto market, potentially leading to deeper corrections in the coming weeks.
So, what do you think? Do you believe the crypto market correction is over, or do you think it will continue? That’s a nice question to leave our analysis with.
Stop Loss(SL): 5.49%
💡 Please respect each other's opinions and express agreement or disagreement politely.
📌Market Cap USDT Dominance% Analyze (USDT.D%), Weekly time frame.
🛑 Always set a Stop Loss(SL) for every position you open.
✅ This is just my idea; I’d love to see your thoughts too!
🔥 If you find it helpful, please BOOST this post and share it with your friends.
USDT.D: Smart Money Indicator for Bitcoin & Altcoin CyclesUSDT.D Dominance: The Hidden Cycle Behind Crypto Bull & Bear Markets (2021–2026)
The USDT.D dominance chart offers a clear window into the underlying market sentiment: when stablecoin dominance rises, the market tends to weaken, and when it falls, risk-on assets thrive.
From late 2021 , USDT.D saw a steady rise, signaling capital flowing out of risk assets . This climaxed in late 2022 , aligning with Bitcoin’s historic drop from $69k to $15k (~-74%).
Following this, USDT.D entered a downtrend and consolidated for over a year, a period that coincided with multiple altcoin bull runs , highlighting the inverse relationship between USDT.D and alt markets.
Recent months have shown breakout dynamics , as USDT.D reclaimed its long-term downtrend resistance. The market now faces a crucial retest around 5–5.1% , which could act as a springboard for the next major rally.
🔹 Market Implications:
Short-term: Bitcoin & Ethereum likely to see significant upward momentum during early 2026.
Mid-term: USDT.D may form a Bullish Cup & Handle , targeting 8–9% by late 2026 , signaling potential market corrections.
Key takeaway: Stablecoin dominance is a leading indicator —tracking its patterns can provide insight into market cycles, risk periods, and optimal entry/exit windows.
💡 Pro Tip: Always combine dominance analysis with price action and volume for better timing in crypto markets.

Golden Zone Test: Will USDT.D Extend Higher?USDT.D appears to be retesting the zone after breaking out, and it could push higher since this structure has repeated many times in the past.
The marked golden zone is crucial and will play a key role in determining the next major direction of the market.
DYOR, NFA
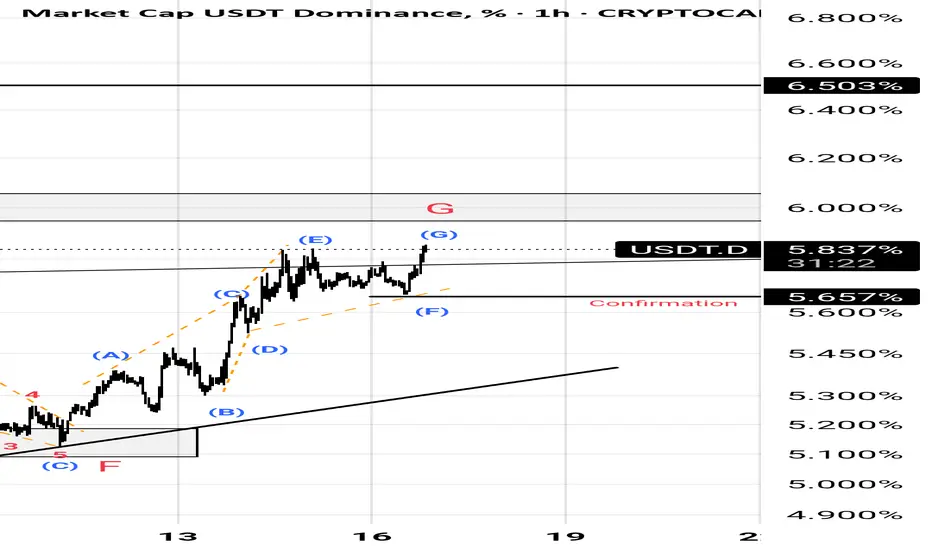
USDT DOMINANCE Analysis | Altseason Or New Bearish Cycle (3D)Before anything else, pay close attention to the timeframe. This analysis is based on the 3-hour timeframe, and it naturally takes time to unfold.
From the point where we placed the red arrow on the chart, it seems that the correction of USDT dominance has begun. This correction is forming a Diametric pattern, and we are currently at the end of wave F.
From the red zone, we expect a rejection to the downside, because wave F ends in this area and we will enter wave G, which is a bearish wave. During this bearish wave, Bitcoin and altcoins will experience some degree of recovery.
However, based on NeoWave wave-counting principles, in the green zone either:
* The correction of USDT dominance will be completed and it will enter a mid-term bullish phase, leading Bitcoin and altcoins into another bearish cycle,
or
* Wave G of this USDT dominance pattern will extend, and instead of a new bullish phase, an X wave will form. In this scenario, USDT dominance will enter another downward cycle, which could trigger an altseason.
We have to see which scenario plays out!
What do you think?
Comment if you have any questions
Thank You

FireHoseReel | USDT.D 4H Analysis🔥 Welcome FireHoseReel !
Let’s jump into the Tether Dominance Analysis , one of the most Popular Crypto Index .
👀 USDT Dominance – 4H Timeframe
USDT dominance has reached a major resistance level after a very strong upward rally. At this point, I personally have a bearish bias, expecting a rejection and the completion of a multi-timeframe secondary trend. This view is also supported by my mentor, Arshia Azizpour.
📉 RSI Analysis
Since volume isn’t very reliable on dominance charts, we use the RSI oscillator instead.
RSI has just rejected from the 81 zone, which is a strong static resistance inside the overbought area.
This rejection suggests potential cooldown, pullback, or loss of momentum.
📌 Key Levels to Watch
USDT dominance currently has three major levels:
🔺 6.623% – major top resistance
🔸 6.427% – multi-timeframe trend-shift zone
🔸 6.148% – secondary multi-timeframe trend-shift zone
A clean break and candle close below these levels can give us a bearish bias on dominance, which naturally creates a bullish bias for crypto assets.
⚠️ Important Note
USDT dominance still has strong trend momentum.
If it breaks above the current top, it could trigger another wave of downward pressure on Bitcoin and altcoins.
Historically, these dominance spikes hit BTC and ETH the hardest, while altcoins don’t always fall as aggressively.
🛞 Risk Management & Disclaimer
Please remember to always use proper risk management and position sizing. Nothing in this analysis is financial advice. The market can change quickly, so always trade based on your own strategy, research, and risk tolerance. You are fully responsible for your own trades.

USDT Dominance at 6%: Past Signals for Crypto UpswingsThis chart highlights the significance of the 6% level in USDT.D. During the last three times when USDT.D reached 6%, Bitcoin and especially altcoins have consistently shifted into notable uptrends. This level historically acts as a contrarian signal—when stablecoin dominance peaks, risk appetite tends to return, sending capital back into crypto assets.
The 3.77% zone represents a key structural support for USDT.D. When this level is approached, it can be a prudent moment to partially lock in profits on altcoins, as risk of reversal and increased capital rotation back to stablecoins may rise from this threshold.

FireHoseReel | USDT Dominance & BTC Dominance Overview😄 Hey! How’s everything? Hope you’re doing great!
🍾 Welcome to FireHoseReel — make sure to follow and enjoy the analysis along the way.
If you ever want a custom chart breakdown, just leave a comment and I’ve got you.
😎 Let’s dive into the analysis of two major crypto dominances: USDT and Bitcoin.
✔️ USDT Dominance Technical Analysis
• On the 4-hour timeframe of USDT dominance, we can see that after repeatedly breaking through multiple resistance levels on the chart, USDT.D has reached a point of heavy overbought conditions. It’s now sitting at a strong resistance zone.
If this resistance breaks, USDT dominance could push even higher, which would bring additional downward pressure on the market, especially on Bitcoin and altcoins, leading to another wave of selling.
• If USDT dominance rejects from this zone and starts moving downward, the nearest support to be tested is around 6.148%. Losing this support would signal the beginning of the first bullish wave in the market, giving us a potential opportunity to start opening long positions once this level breaks down.
• Another key level is the resistance at 6.623%.
If USDT dominance breaks above this level, it could trigger an even stronger bearish wave compared to the previous one, causing a deeper correction across the market.
✔️ BTC Dominance Technical Analysis
• On the 4-hour timeframe of Bitcoin dominance, we can see that after the recent market drop, BTC.D also moved downward and went through a relatively deep correction.
What’s important here is that despite the decline in Bitcoin dominance, altcoins did not experience a heavy correction, and most of them held their levels without major downside movement.
• If Bitcoin dominance loses the 58.80% level, it could extend its correction even further.
However, the key reversal zone for the 4-hour trend lies at 59.31%. A breakout above this level can trigger a solid bullish wave in BTC.D.
• Our confirmation for this bullish wave would be the formation of a higher low above this resistance zone, signaling a potential upward trend continuation.
🛞 Risk Management & Disclaimer
Please remember to always use proper risk management and position sizing. Nothing in this analysis is financial advice. The market can change quickly, so always trade based on your own strategy, research, and risk tolerance. You are fully responsible for your own trades.

USDT DOMINANCE Roadmap (1D)From the point where the green arrow is placed on the chart, it seems that a large-degree bullish pattern has started. Waves A and B of this pattern are complete, and we are now in wave C.
Wave A was a diametric, and wave B was a triangle. We are currently in wave a of C. After wave b of C completes, caution is needed because the movement of c of C will begin.
From the green zone, Tether dominance may turn bullish again toward the two red-line targets.
We will try to update this analysis periodically.
For risk management, please don't forget stop loss and capital management
When we reach the first target, save some profit and then change the stop to entry
Comment if you have any questions
Thank You

"Falling Knife" Stable Coins Dominance Analysis (1W)Hello everyone.
The entire crypto market is about to face a crucial decline.
There are many technical ways to show it.
I'm here today to show you one of them.
One of the best ways of examining the crypto market is checking the stablecoin dominance.
The most famous way to do it is simply looking at the USDT.D chart, which is extremely bullish right now.
The problem with that is, if stablecoin dominance is rising, it means the market is going down. Also vice versa.
We can also combine them to see more complex details to understand what is about to happen in the near future.
Right now, you're looking at the “USDT.D + USDC.D” chart, so they are combined.
The problem here is, this chart is extremely bullish on the weekly timeframe.
It means extremely bearish for the entire crypto market.
There is a very common pattern known as a “triple bottom,” which is about to break. Moreover, a broken trendline on the weekly timeframe simply means that the trend is not likely to end very soon.
We might be witnessing a very bearish market next year.
Be prepared.
Good luck.

USDT-DOM- As usual, the charts tell the story very simply, watch the USDT triple top and the RSI divergence for clues.
- At times, tracking USDT trends gives clearer signals than watching BTC price alone.
- It’s an odd moment in the market, no real FUD, constant talk about crypto, yet price movements are surprisingly muted.
- Some major players are trying to shake out weak hands and buy your crypto lower. Stay focused: HODL and accumulate.
Time your entries and DCA, be a trader, not a victim of the cycle.
Happy Tr4Ding !

USDT.d resistance areaUSDT dominance has reached a very important resistance area, which could trigger a correction in it and a rally in the crypto market.
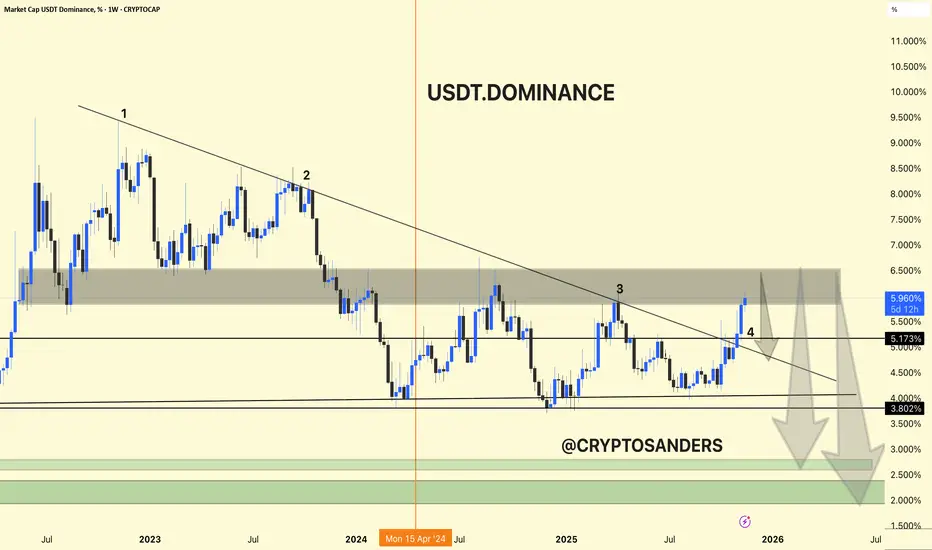
USDT Dominance Weekly Chart Analysis. USDT Dominance Weekly Chart Analysis
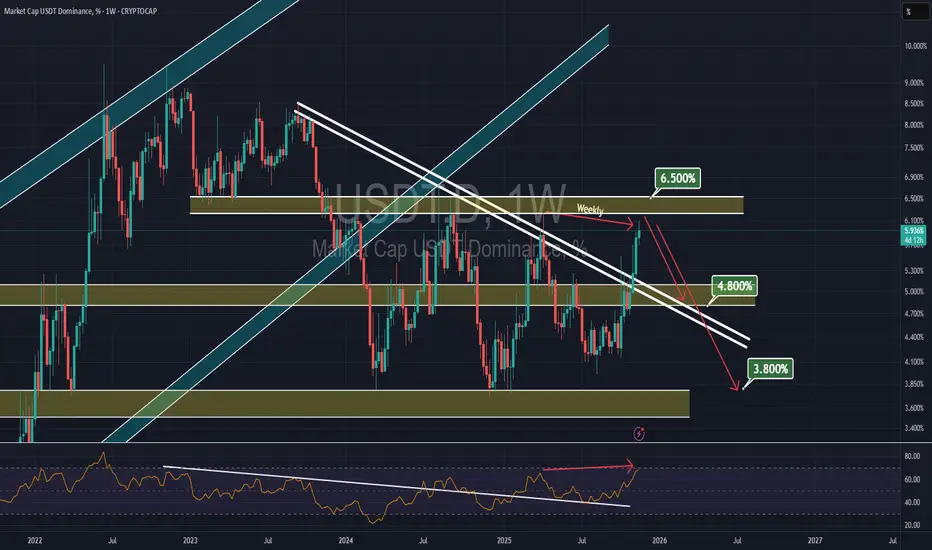
USDT dominance has been in a wide downtrend since mid-2022, repeatedly making lower highs along a major descending trendline.
Resistance Test: The dominance index is currently retesting the upper boundary of a key supply zone (5.5–6.2%), where it has previously faced sharp rejections (marked 1, 2, 3, 4).
Breakout Risk: Despite the latest rally, the price shows potential for another rejection at this supply zone, with the trendline acting as resistance.
Downside Projections: If rejected, USDT dominance may head for significant support near 4.0% and then 3.8%, with further targets at the green accumulation zone around 2.5–3.0%. This would suggest capital rotation out of stablecoins and back into crypto assets.
USDT dominance is at a major resistance, historically rejecting this trendline and zone. Another rejection here could mean reduced market fear and capital flowing back into riskier crypto assets. A sustained breakout above 6.2% would signal increased stablecoin preference and ongoing risk aversion.
DYOR | NFA
Usdt.d(based on NEo wave)Now 95% of wave G is recognizable and its a bow tie.
Waiting for post pattern confirmation.
Retest Confirmed - Bitcoin Analysis (2D)Hello everyone.
I must say that it's not very easy to say it loud but for a short period of time, the Bulls have lost the fight.
According to several factors, the next two months will be blood-colored in the entire market.
Get ready to bleed. Because your portfolio will. So will you.
Okay, but why?
Let's see;
Fundamental Factors:
-The USA is still creating more tension around the globe. Only last week, the USA has operated a huge campaign over the Caribbean Sea. And yes, if you ARE a trader, you'll follow these kinds of events because this market is not a playground for kids.
-The USA has finished its recession today but for the first time in history it took a lot of time for them to solve the problems. During the "solving" phase, the market has already calculated the fair prices for so-called "bullish news". By “bullish”, I mean reopening the USA, which is not actually bullish at all because it was never meant to be happening in the first place anyway.
-Today the USA senate has talked about another export restriction for China. This actually is the trigger for today’s red candles.
-The FED is still telling people the same story about inflation. Their utopian targets for inflation are not realistic and they know it as well. Powell has marked that there might be no rate cuts in December after all. Personal thoughts: There will be. In the short term? BEARISH.
-Another thing to consider is the ETFs. Remember what happened in the market when BTC and ETH ETFs were listed? This is what's happening at the moment. History just repeats itself again and again. Many altcoin ETFs will be approved during this month. This will trigger another event called "accumulation". Hedge funds and other customers will seek to buy the dip. Therefore, they will push the prices of ETF-listed altcoins to the bottom so they can buy at lower prices while your portfolio melts. CEXs will also help them do so by letting them manipulate the order book via fake resistance orders. Sorry, but this is how it works.
Now the fun part. Let's talk about the Technical Factors:
-For this time I'll start with USDT dominance.
There is not much to talk about but I'll leave a link so you can examine. The entire market will remain bearish as long as this parameter stays above 5.2%.
-Another thing to keep an eye on is the S&P index, which is looking very bearish due to uncertainty around the globe and for the most part the US.
-Let's get back to BTC.
In previous analysis, I already explained to you what might be coming soon and we might actually have been at the end of wave 5. Well, sadly that analysis worked. Yes, sadly because I want this market to grow.
At the moment we are going to see an A-B-C correction pattern and it will take a few weeks to complete. During this era, you need to be careful about two things:
Don’t even think that getting a swing long position to hold for 2 years will work.
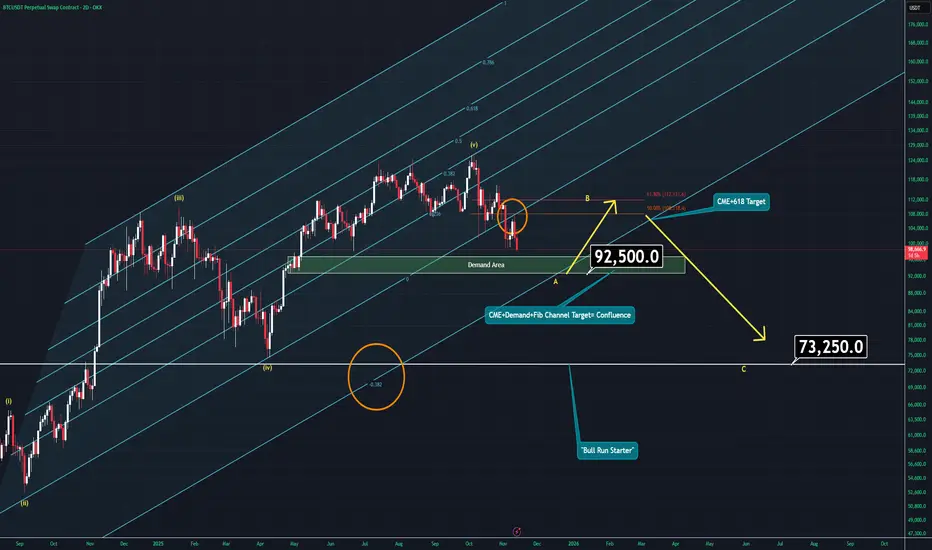
You will see a correction through 110K soon but it will only be wave B. So, if you're carrying long-term hedge positions, you'll need to watch for an ENGULFING daily candle in Bitcoin around 92K. That's where the CME gap was left — also a demand area and moreover, there is Fib channel confluence. Before that “engulf” happens, I'd not suggest lowering breakeven in losing positions.
The wave 5 also will be a perfect trap for newcomers and for people who don't know much about the market. Many will jump into altcoins when they're cheap, but most likely they will be cheaper around March 2026.
Bitcoin has already completed its retest after breaking the lower boundary of this Fib channel. No need to overthink it. As long as Bitcoin stays below 110K, don't look for any “BULL RUN.”
And if somehow Bitcoin reaches around 110K, wait for a weekly candle close. That will both confirm and trigger bullish momentum. Don't worry, you won't miss the move — you'll just confirm it.
Thanks for reading,
Get ready.