If USDT.D Breaks 6.2%, Say Goodbye to AltsUSDT.D is now heading toward a key resistance zone. Until it reaches that level, altcoins could continue to face selling pressure.
If USDT.D breaks and holds above the marked zone, it could signal the start of a broader bearish phase for the market. However, historically, this level has acted as a strong rejection zone, so a pullback from around 6.2% could once again bring relief for altcoins.
Keep a close eye on how dominance reacts here, the next move could decide the short-term trend for the entire market.
DYOR, NFA
Usdtdominance

#USDT This is the most Crucial Level for ALTCOINS!CRYPTOCAP:USDT is hitting a crucial level right now. How the price reacts here will decide the next market direction.
The blue trendline has been acting as resistance since January 2024, and this level is far more important than most realise.
For now, the best move is to wait and watch how the index behaves over the next few days.
A close above this level could make things ugly, but honestly, I think it’ll get rejected, and the market could go insane in the coming days or weeks.
We’ve already seen maximum pain and liquidation. This is that phase where people are bored and rekt, just before something big happens.
This is just my view; always do your own research.
Invalidation: Close above 5.70%
Let me know what you think in the comments, and don’t forget to hit that like 👍
Peace ✌️
#Altcoins

USDT.D(based on NEo wave)I think wave G is showing the pattern.
wave G might be a triangle or a diametric.
Im ready for both scenarios.

Is USDT.D About to Cool Off?USDT.D is moving within a rising wedge pattern. After bouncing from the lower boundary and retesting the zone.
It’s now approaching the upper boundary, where a potential rejection could take place.
DYOR, NFA

Market Sentiment Shifts: Fear & Greed, Liquidity & Next Cycle🌍 A truly global look at the market!
😱 The Fear & Greed Index has been sitting at 29 for the second day in a row, after recovering from 22–23 — even though the market has been trying to bounce for two days
That means all euphoria is dead — no more 10–15 random spikes a day.
📉 Short-term — not great.
📈 Long-term — that’s actually good.
⚠️ The index trying “get the bottom,” but historically major trend reversals happened around 10–15 points — keep that in mind.
💰 Meanwhile, index USDT.D looks ready for another big downward wave, which usually means stablecoins start flowing back into crypto 🐸
(Which ones? That’s the mystery for all, will see soon 😉)
🪙 A short bullish phase might last until spring 2026, or, if the cycle stretches, even until late 2026 – early 2027 😉
⁉️ But here’s the key question — where will the new money come from?
Because liquidating traders for $30–50B and then handing out “cashbacks” of $400–500M… that’s laughable 🐔
And expecting a March 2020-style buyback again? Unrealistic.
👉 Back then, people were locked at home, got freshly printed $, and instantly sent them to exchanges 💵
That was a real injection of fresh blood into the market — hundreds of billions.
Now? Nothing like that… or not yet 😉
🤔 What do you think — will a new wave of liquidity appear soon, or does the market still need more pain before the next leg up?
______________
◆ Follow us ❤️ for daily crypto insights & updates!
🚀 Don’t miss out on important market moves
🧠 DYOR | This is not financial advice, just thinking out loud

USDT Dominance at Key Resistance – Crypto Reversal Ahead?One of the key indices we can use to gauge the direction of the cryptocurrency market is USDT Dominance ( CRYPTOCAP:USDT.D ) .
In this analysis, let's look at USDT.D% on the weekly timeframe .
Currently, USDT.D% is moving in a Resistance zone(6.77%-5.25%) , Time Reversal Zone(TRZ) , and is near a Potential Reversal Zone (PRZ) .
From a classic technical analysis perspective, it seems that USDT.D% is inside a Symmetrical Triangle and is currently near the upper lines of this triangle.
In terms of Elliott Wave theory, USDT.D% looks like the corrective wave B of the main wave Y is completing.
So we might expect USDT.D% to move downwards again, at least towards the lower lines of the symmetrical triangle .
Note: This is purely a technical analysis. USDT.D% is at a sensitive area, and if it breaks above the upper lines of the triangle, we should anticipate a decline in Bitcoin and other tokens.
What do you think? Can USDT.D% break the upper lines of the symmetrical triangle and push the crypto market down again, or will the market bounce back? Let me know your thoughts!
Please respect each other's ideas and express them politely if you agree or disagree.
Market Cap USDT Dominance% Analyze (USDT.D%), Weekly frame.
Be sure to follow the updated ideas .
Do not forget to put a Stop loss for your positions (For every position you want to open).
Please follow your strategy and updates; this is just my Idea, and I will gladly see your ideas in this post.
Please do not forget the ✅' like '✅ button 🙏😊 & Share it with your friends; thanks, and Trade safe.

USDT Dominance - Wyckoff AccumulationCRYPTOCAP:USDT.D could be mirroring Tesla’s 2022–2024 Wyckoff structure. From 2022 to late 2024, NASDAQ:TSLA formed a clear Wyckoff Accumulation on the weekly chart: a Selling Climax set the range, an Automatic Rally confirmed resistance, and a brief Spring in early 2023 shook out bears before prices recovered on strong volume. The stock then established a Last Point of Support, followed by a Sign of Strength breakout in late 2024, signaling institutional accumulation and the start of a new uptrend.

$USDT.D Cycle Top Indicator HIT !A THIRD CYCLE TOP INDICATOR HAS FLASHED ⚠️
YES this chart is complete chicken scratch, and my mad scientist approach to viewing different trends in USDT Dominance.
I’ve had this November 3rd intersection mapped out for years now.
NO, I do not believe we are anywhere close to the top (see pinned tweet).
Bulls REALLY need to step up big this week with a rally.
We cannot afford two consecutive weeks above 5.5%

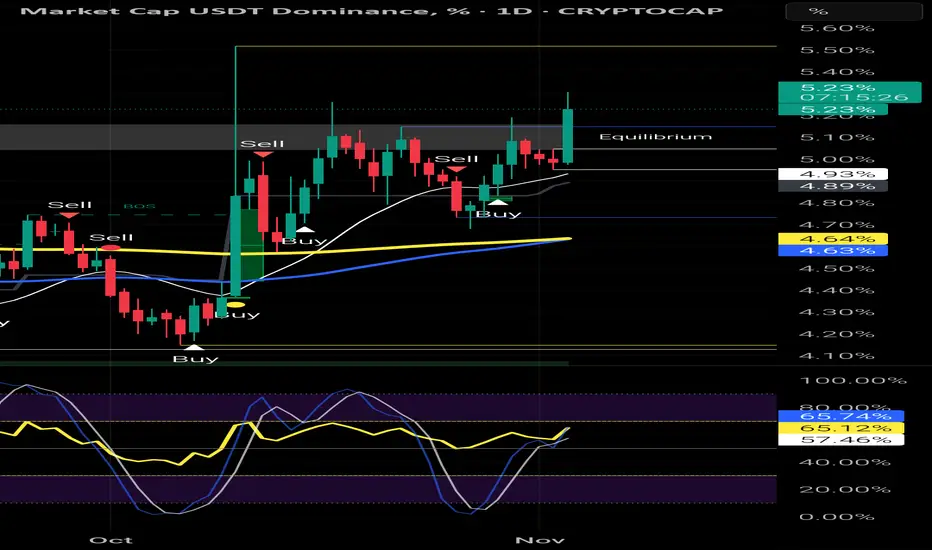
USDT Dominance (USDT.D) – Daily Timeframe AnalysisUSDT Dominance (USDT.D) – Daily Timeframe Analysis
Current Value: 5.23%
Trend: Bullish breakout – Risk-off sentiment increasing
Technical Overview
USDT dominance has broken above the equilibrium zone (~5.00%), signaling capital flow into stablecoins — typically a bearish signal for BTC and the broader crypto market.
The strong bullish candle closing above both the 50 EMA (white) and 200 EMA (yellow) confirms the risk aversion among traders.
This aligns with the recent BTC/USDT drop toward the 106,500 USDT area, showing that money is rotating out of volatile assets (like BTC) into USDT.
Key Levels
Resistance Zone: 5.30% – 5.40% (recent highs / potential supply area)
Support Zone: 4.90% – 5.00% (former resistance turned support)
Major Support: 4.60% (EMA confluence + structure base)
Indicators
The Stochastic RSI is rising but not yet overbought (≈65%), suggesting there’s room for further upside in dominance.
Momentum favors USDT, meaning cryptocurrency prices may continue facing pressure until dominance peaks.
Market Implications
Rising USDT dominance → Bearish for BTC, ETH, and alts.
If USDT.D reaches 5.40% or higher, expect BTC to test the 104,000 – 102,000 USDT zone.
A rejection near 5.40% with a return below 5.00% could signal a relief rally for BTC.
Summary
USDT dominance is showing strong bullish momentum, reinforcing the current risk-off sentiment in the crypto market.
As long as dominance holds above 5.00%, expect continued downward pressure on BTC and altcoins.
Watch closely for exhaustion signals around 5.35% – 5.40% — that could be the first clue of a potential BTC rebound
USDT.D Eyeing Resistance, Altcoin Holders Stay Alert!USDT.D is trading right at the edge of a breakout near the resistance zone. If it manages to break above, we could see another sharp drop in altcoins in the coming days.
However, a rejection here might give altcoins some much-needed breathing room.
DYOR, NFA
#PEACE

USDT.D – 4H Technical OutlookUSDT.D – 4H Technical Outlook (Nov 2, 2025)
📊 Market Structure:
USDT Dominance remains in a medium-term bearish structure, forming a clear Lower High (LH) around the 5.20–5.25% premium zone.
Recently, the market printed a bullish CHoCH after bouncing from the 4.75% swing low, but price is now facing strong resistance near 5.00–5.05%, aligned with the 89 EMA and a prior liquidity zone.
Overall, the structure remains bearish-biased, with the current move likely a corrective retracement within the broader downtrend.
📈 Key Levels:
Resistance Zone (Premium / Supply Zone): 5.20 – 5.25%
Current Reaction Zone: 5.00 – 5.05%
Support Zone (Discount / Demand Zone): 4.75 – 4.80%
⚙️ EMA Confluence:
The 89 EMA (blue) sits just above current price, acting as dynamic resistance.
The 200 EMA (yellow) lies below, around 4.75%, serving as major support.
➡️ Both EMAs confirm that the dominant trend remains bearish, with price currently in a technical pullback phase.
📉 Momentum (Stochastic RSI):
The Stochastic RSI is slightly turning upward from the mid-zone (40–60%), signaling weak bullish correction momentum.
No overbought signals yet, suggesting that price may still test 5.05% before resuming the downside move.
🎯 Trading Scenarios:
Scenario 1 – Sell (Trend Continuation)
Entry: 5.00 – 5.05% (EMA89 retest / resistance zone)
Stop Loss: 5.10%
Take Profit: 4.85% → 4.75%
Confluence: EMA rejection + bearish structure + weakening momentum
Scenario 2 – Buy (Reversal Confirmation Only)
Entry: 5.10 – 5.15% (after clear breakout & retest)
Stop Loss: 5.00%
Take Profit: 5.20 – 5.25%
Confluence: Break of structure + EMA breakout + strong bullish confirmation
💡 Summary Insight:
USDT Dominance is currently in a corrective phase within a broader downtrend.
A rejection from 5.05% could lead to continuation toward 4.85–4.75%, which would support a bullish move in BTC and altcoins.
Only a confirmed 4H candle close above 5.10% would shift short-term momentum to bullish and add downside pressure to crypto prices.

USDT.D(based on NEo wave)after this long trading range I think its time to change my counting and its not a triangle.
crypto market will see lower prices and it will continue for 1 month.
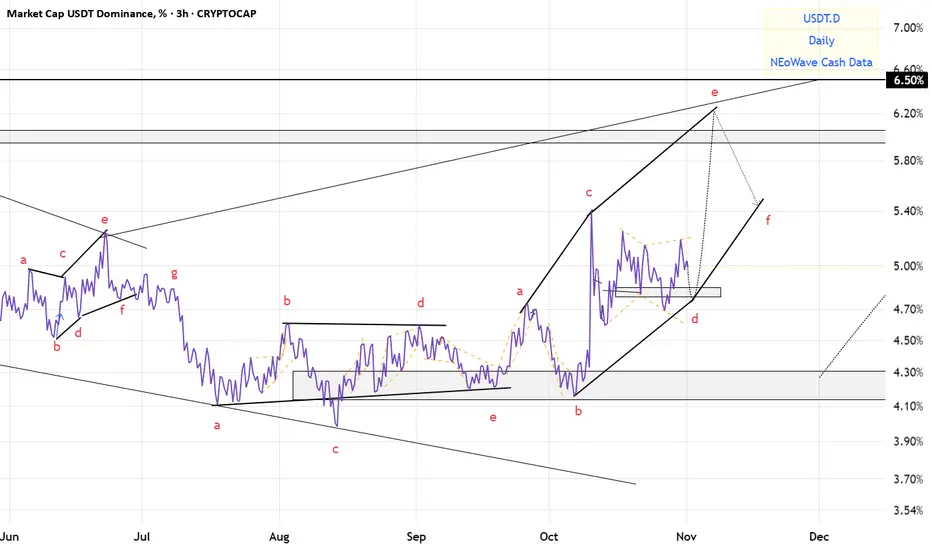
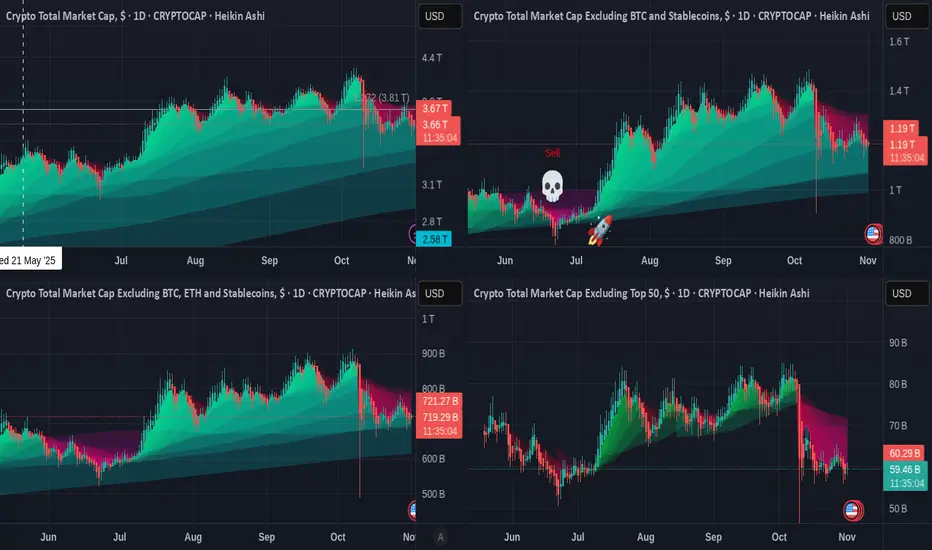
The 4 TOTAL Crypto Charts with Easy to see performance values
These charts use the " RK's 10 ∴ MA Types Ribbons (Fibonacci, Guppy and others) " indicator in TradingView.
It is simply SUPERB and is unparalleled.
So, to business. These are all DAILY charts from around mid MAY 2025
Top Left TOTAL chart - Top Right TOTAL2 (Excluding Bitcoin)
Bottom Left TOTAL3 ( Excluding BTC & Eth ) - OTHERS ( Top 125 coins minus top 10 by Market Cap )
First thing to notice is simply how the TOTAL chart is the Deepest, showing a Bigger Market trading volume. This shows us how it is BITCOIN that holds the market as all the other charts EXCLUDE Bitcoin and are more Shallow by comparison.
We can also see how the TOTAL2 chart ( exc BTC) is the only one with a SELL signal. This is the Fragility of ETH.
Looking to the RED zones on these Charts. This is where Moving Averages Fell, crossing each other as Price dropped.
The TOTAL chart has the smaller red zones, showing more resilience,
And we can see the progressively worsening situation in the ALT market, with OTHERS having a truly terrible time.
There are people out there Still Claiming an ALT Season like we used to know, is on its way.
I am sorry but while it is obviously possible, It seems obvious to me that Times HAVE changed.
The 4 DOMINANCE charts also tell us a story
These are WEEKLY charts :-
Top Left BTC.D - Top right ETH.D
Bottom Left OTHERS.D - bottom Right USDT.D
We all know about Bitcoins utter Dominance this cycle, the main cause of the lack of a sustained ALT season. TOTAL chart, or BITCOIN is the only one that remains above its 100 EMA (blue), 128 EMA ( green) and the 200 EMA ( Yellow)
None of the other charts involve Bitcoin and they are Not as strong.
We See how ETH.D was falling away until recently when it turned higher in late April 2025 but as we see from the main chart, this failed to really make any inroads into Bitcoins status, and is now once again falling away
What is VERY Telling os how the OTHERS.D has been falling away since March 2024.
ALTS have been loosing the battle for over a year now, a sustained growth never appeared.
Quick flash in the Pan rises followed by massive sell offs.
Apart from some coins that have sustained growth, like SOLANA and BNB but this is another story for another post.
What I do find very interesting is how USDT.D is in a diminishing pennant....the use of USDT getting smaller and smaller as "Cashing out" is reduced.
So, where are we in the Market ?
I feel that the ALT Traders will soon begin to loose Faith and may begin the flow of whats left into the ore established ALTS...like SOLANA, BNB and maybe XRP etc. Rotation will begin.
The USa Will continue to push ETH as an alternative for BTC
I think we have a Very strong possibility this "Bull run" will morph into the Normality of Crypto, we may not see the massive sell off we got used to previously.
This will curb the massive profit possibilities and no one wants to see this but Bitcoin has Matured away from the petulant teenager...and is now an Adult.
This is very much my opinion and YES, I do still Hold some ALTS.....
But BITCOIN has ABSOLUTELY CONTROLLED THIS and will continue to do so.
USDT Dominance Breakdown and Market Rally !!!👋🏻 Hey everyone! Hope you’re doing great! Welcome to SatoshiFrame channel.
✨ Today we’re diving into the 4-Hour USDT.D analysis. Stay tuned and follow along.
👀 On the 4-hour timeframe, USDT dominance was rejected downward as it approached its seller-taker zone. With heavy USDT selling, it lost its key support at 4.89%, giving us a confirmation signal for long positions. USDT dominance is now sitting on a key support at 4.74%, with another close support at 4.61%. If these two key levels are broken, the prices of coins can become significantly more expensive.
🔍 Which support zone currently acts as the key one? The 4.74% level can create a short-term pullback in the market, but if you look closely, it has not yet shown any sign of weakening the downtrend or stopping the heavy USDT sell-off. Sellers are not interested in holding USDT in their wallets, and over the past weeks, we have also seen large USDT minting from the issuing company.
Regarding the 4.61% level: breaking this zone will likely require a whale liquidation move, clearing many short positions and large sell orders, which could then trigger a price rally.
🧮 On the 4-hour timeframe, the RSI oscillator is currently in the OverSell zone. Since we cannot rely only on this, we look at the daily timeframe. On the daily chart, USDT dominance is pushing below the 50 level, indicating continued broad selling pressure of USDT — a behavior usually aligned with breakouts in the crypto market.
⁉️ So what information is USDT dominance giving us now? If we observe dominance behavior on the 4-hour chart and compare it with the daily structure, we can identify the beginning of a strong bullish leg in the market, where the prerequisites are the breakdown of the multi-timeframe support zones mentioned in the first paragraph.
❤️ Disclaimer : This analysis is purely based on my personal opinion and I only trade if the stated triggers are activated .

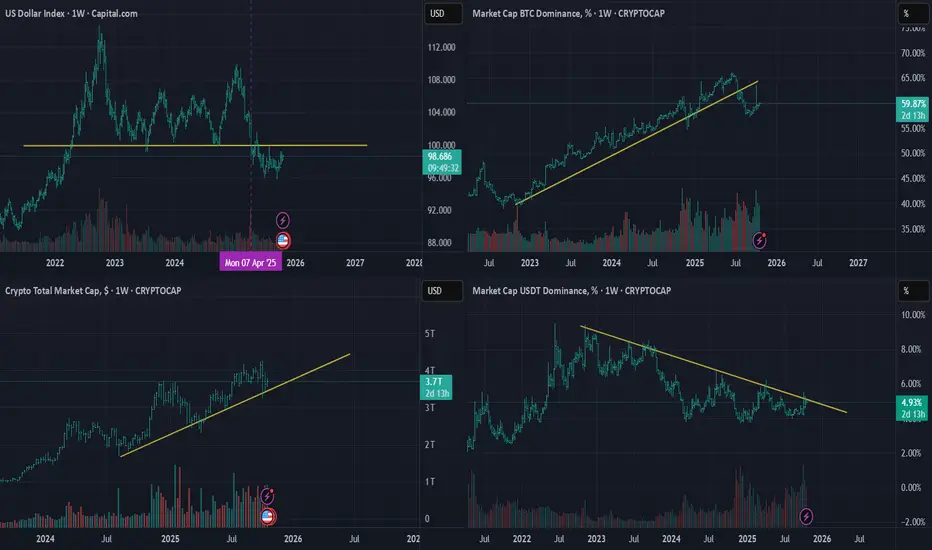
USD Index, BTC Domination, Crypto Total Market USDT Domination Hi everyone,
I just noticed a rare and exciting opportunity — the global market indexes are currently in sync in favor of altcoins.
All the charts are lining up perfectly, and to me, this looks like one of the best times to enter the market or add to your existing positions.
Wishing you all the best! :)
The Clearance Theory Dear Followers
As an analyst I always watch the market and take a notes
I would like to share one of my theorys today
I did notice this pattern did happen before throw the last few years
I call it the The clearance
it did happen before when the market was about to move strongly toward a new direction
and for making sure it will face a weak resistance the market will try to fulfill most of the pending orders before his final move
it takes the pending orders and dumb it till all the major orders fulfilled, Then >>>>>>>>
Good luck everyone

USDT.D Breaks Out, Altcoin Correction Ahead?USDT.D has broken above the resistance trendline and is now forming higher highs and higher lows, a clear sign of a bullish structure shift.
If the price breaks above the next resistance, we could see more correction across altcoins.
Keep an eye on USDT.D and stay tuned for further updates.
DYOR, NFA

USDT Dominance — Is the Market Ready for a Relief Rally?After several days of steady climb, USDT dominance has now broken below its ascending support line — a potential signal that risk appetite may return to the crypto market.
The chart shows a clear short-term shift in momentum:
• The dominance failed to sustain above 5.15%, forming a local top.
• A clean breakdown from the channel has opened the path toward key liquidity supports, highlighted by the yellow zones between 4.95% → 4.75%.
• These areas represent potential reversal zones, where stablecoin capital might start rotating back into altcoins.
If dominance continues to drop toward these supports, we could see altcoins begin a short-term recovery phase — especially those with strong structure and volume base.
⚠️ Invalidation:
A return and hold above 5.15% would invalidate this scenario and suggest further consolidation before any major move.
⸻
📊 Summary:
USDT.D heading toward key supports → Possible rotation into risk assets (alts).
Stay alert for bullish confirmation signals on ALTs as dominance approaches the yellow zones.

Can USDT.D break its high ? | USDT.D 4H Analysis🥳 Hey everyone! Hope you’re doing great! Welcome to SatoshiFrame channel .
✨ Today we’re diving into the 4-Hour Ethereum analysis. Stay tuned and follow along!
💵 Can USDT.D break its high & cause crypto drop again ? Tether Dominance is hovering near the 5% zone after the Trump tariff rumors — a key resistance that perfectly aligns with the crypto market’s bottom. A breakout here could trigger another leg down across altcoins.
👀 4-hour timeframe of Tether Dominance and we can see that after breaking the 4.6% area, it gave us a confirmation for an uptrend, and in this area, it also formed a higher low compared to its previous low. It easily broke through several resistance levels and reached its top at the 5.16% area, where it is now rejected. Since we are in the holiday period, we have faced weak downward momentum, and now several breakout triggers have formed on the Tether dominance chart which, with Tether volume passing through these areas, the market can start its next move. Note that this top that has currently formed is the same as the bottom of the altcoins that we see on various charts, so breaking this top will not be easy.
🧮 The RSI oscillator can be a great help to us in this analysis, as it allows us to better identify the tops and bottoms of Tether dominance. If the oscillation passes through those desired areas, we can take positions on coins contrary to the direct supply and demand of the chart itself. The 74 oscillation zone is slightly above the overbought boundary, and crossing this area can increase the oscillation volume of Tether buy trades and cause the crypto market to lose its bottom. The next important area is the 50 zone, where a reaction to this area or passing the oscillation limit from this area can form a lower top for Tether dominance and then give us confirmation to start a bullish leg in the market.
🕯 The size of the Tether dominance candles during the rise was significantly smaller but closed with more strength, while during reactions and pullbacks, the size and number of candles increased, which informs us of the weakness of the Tether sellers' trend. A noteworthy point for Tether dominance is the rejection it received from the top and then moved downward, facing weak upward momentum. If the market bottom is in this area and the Tether dominance top is also in this area and this top does not break, the market can soon tend toward a trend change and a drop in dominance may occur.
❤️ Disclaimer : This analysis is purely based on my personal opinion and I only trade if the stated triggers are activated .

USDT ; there is still hopeOne of the nastiest charts in the cycle that intends to destroy everything is usdt.d , it’s in a crucial point declining from a multi year channel, if it goes down from here it can also break the triangle downward, it will definitely be lovely to see this one breaks down , they will try to inject more to balance the chart so it would be difficult to say any target but let’s hope it goes as planned.
Have a blessed day

Can USDT.D break the Taker Seller Zone ? | USDT.D 1H Analysis👋 Hey everyone! Hope you’re doing great! - ❤️ Welcome to Satoshi Frame .
📅 Today we’re diving into the 1-hour Bitcoin analysis. Stay tuned and follow along!
👀 On the 1-hour timeframe of USDT.D, we can see that after the news of Trump imposing tariffs on China, USDT.D experienced an extremely sharp pump — rising from below 4.3% to near 5%. After that, it formed a trading-range box in this zone. The top of this box lies around 4.89%, overlapping with a “taker-seller” resistance zone where Tether’s market share is currently capped. There’s a key midline at 4.74% and a bottom at 4.59%, completing this trading-range pattern. Price has tested the top three times but failed to break it, meaning USDT.D remains trapped below resistance. A 15-minute multi-timeframe Low has also formed at 4.83%, creating a new structure that, if broken, could trigger Tether selling.
🧮 Looking at the RSI oscillator, since October 12 it has tried three times to enter its 1-hour OverBuy zone but failed each time. Each rejection from around the 70 level led to selling pressure and movement back toward its 50 support zone. This 50 level is a very important static resistance — a breakout above it could push USDT.D toward higher resistance levels. The 50 RSI zone also overlaps with the 4.83% price level, meaning if that area is lost, selling pressure and volume decline could begin.
🕯 The size and volume of recent USDT.D candles show weakness every time it reaches the 4.89% top. Breaking the taker-seller zone will require a large “whale” candle — a strong, high-volume bullish move that can fully absorb the sell orders placed there. In short, breaking this level needs a strong price surge and maximum buying pressure.
🧠 To manage or open new positions using USDT.D as a guide, we can consider these scenarios:
🟢 Breakout of the taker-seller zone: This breakout could be triggered by news or even a Trump tweet :) From a technical standpoint, this area needs a massive, high-volume “whale” candle so that all sell orders in this zone get filled instantly. Once price surges and holds above it, the next resistance would be around 5.1%.
🔴 Break of the 15-minute multi-timeframe Low: This Low sits at 4.83%. A confirmed close below it could signal the start of selling and volume decline. In this scenario, the next support for USDT.D would likely be the box midline — around 4.74%.
❤️ Disclaimer : This analysis is purely based on my personal opinion and I only trade if the stated triggers are activated .

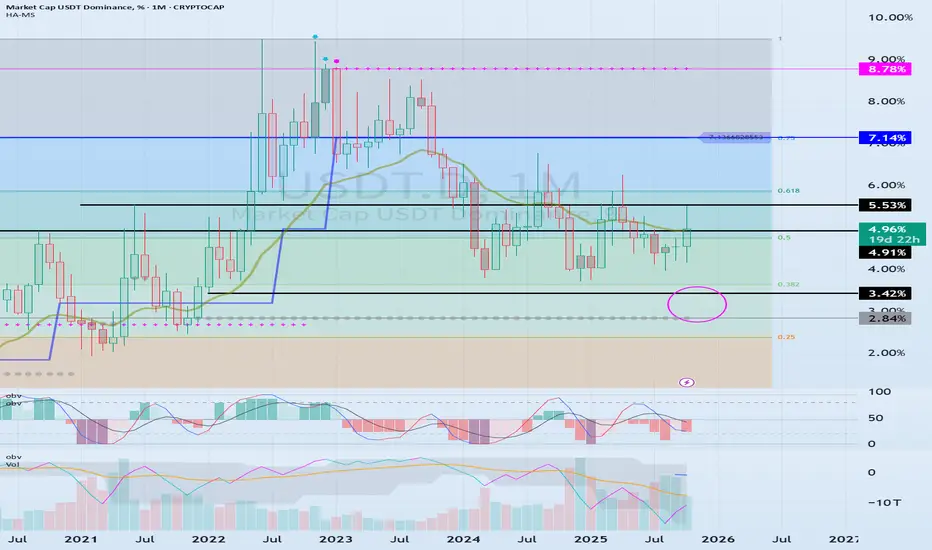
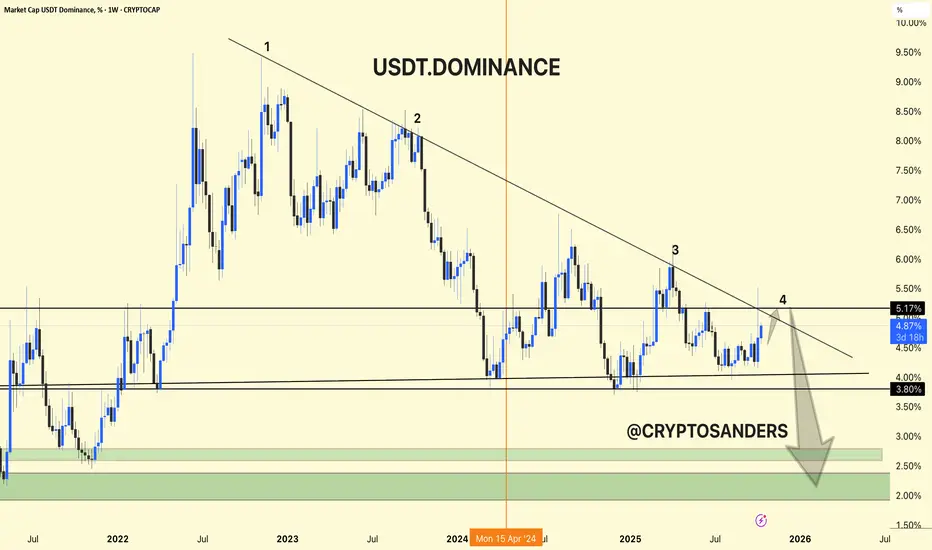
USDT Dominance - Weekly Chart Overview !!USDT Dominance - Weekly Chart Overview
Current Level: 4.88%
Trend Structure: The chart clearly forms an aspect ratio pattern, consisting of a series of lower highs and lower lows since mid-2022.
Ascending Telgero/Declining Channel - Continuous pressure is being displayed from the ascending Telgero.
1. Key Resistance Area (5.0%–5.2%)
USDT Dominant is currently undergoing a restart test of the ascending critical line, which has acted as strong resistance several times in the past.
Every time the price retests this trend line, it corrects – indicating a shift of funds from stablecoins to crypto assets.
If the price does not close above 5.2%, it could trigger the next bearish move to the downside.
2. Support Levels
First Support: Around 3.8% – a key chocolate demand area.
Key support zone: Between 2.0%-2.5% (green zone applied).
This level is typical of the Initial Petroleum Model and historically marks major crypto bull runs.
3. Uptrend Outlook
The large downward arrow on the chart indicates a continuation of the slope.
If dominance is below 3.8%, it could move towards the 2-2.5% zone, which indicates that traders are shifting investments from USDT to BTC and altcoins – a bullish trend for the crypto market.
This means that traders are selling crypto and holding stablecoins → risk-off, fear in the market.
When USDT dominance falls:
It means that money is flowing from stablecoins to BTC and altcoins → risk-off sentiment, confidence is returning.
DYOR | NFA
Understanding the Money Flow in the Coin Market
Hello, fellow traders!
Follow me to get the latest information quickly.
Have a great day!
-------------------------------------
(USDT 1D Chart)
(USDC 1D Chart)
I believe that USDT and USDC show a gap up trend when funds flow into the coin market, and a gap down trend when funds flow out.
Therefore, unless the gap turns into a downtrend, the coin market is expected to maintain its upward trend.
-
(USDT.D 1D Chart)
(1M Chart)
As funds flow into and out of the coin market through USDT and USDC, USDT dominance is likely to ultimately rise.
However, I believe that the funds (USDT, USDC) flowing into the coin market will change dominance through trading.
In other words, if USDT dominance declines, the coin market is likely to trend upward.
This is because coins (tokens) are being purchased with USDT.
If USDT dominance remains below 4.91 or declines, the coin market is likely to trend upward.
Therefore, if USDT dominance rises without any evidence of fund outflows through USDT or USDC, it can be interpreted as a temporary increase in selling pressure.
If USDT or USDC gaps downward in this situation, the price will fail to defend, leading to a downward trend in the coin market.
Therefore, it's best to look at the USDT and USDT.D charts to understand the general flow of funds.
-
(BTC.D 1D chart)
(1M chart)
I believe BTC dominance reflects the relationship with altcoins, rather than the rise or fall of the coin market or the rise and fall of BTC itself.
In other words, rising BTC dominance indicates a concentration of funds toward BTC, increasing the likelihood that altcoins will gradually move sideways or experience a downward trend.
Therefore, for an altcoin bull market to begin, it must remain below 55.01-62.47 or show a downward trend.
Therefore, it is recommended to check BTC dominance before trading altcoins and develop a trading strategy.
--------------------------------------------------
Summary of the above:
For the coin market to continue its bull market,
1. USDT and USDC must maintain a gaping upward trend.
2. USDT dominance should decline below 4.91.
3. BTC dominance should decline below 55.01.
-
Thank you for reading.
I wish you successful trading.
--------------------------------------------------