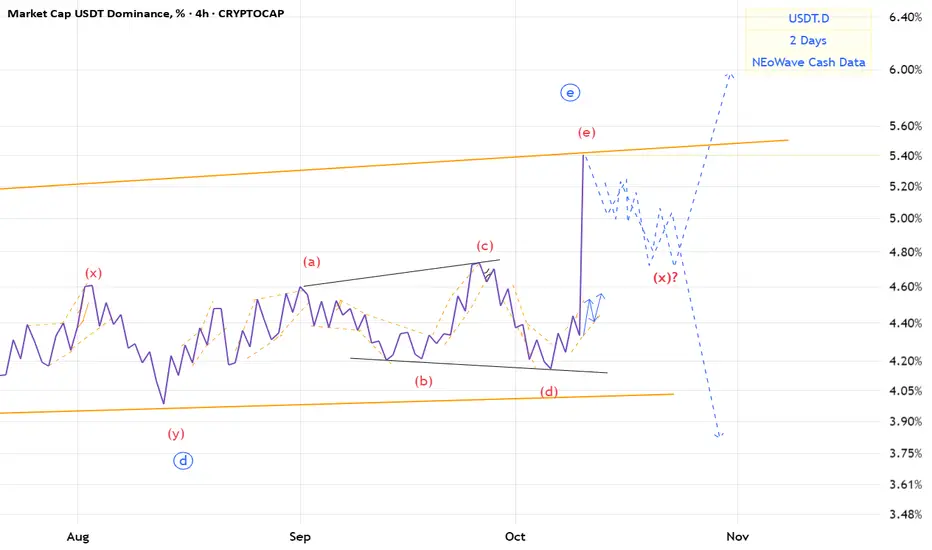
USDT.D(based on NEo wave)The e wave that I wanted made a descending triangle.
we should wait for it becouse it may make an x wave or a post pattern.
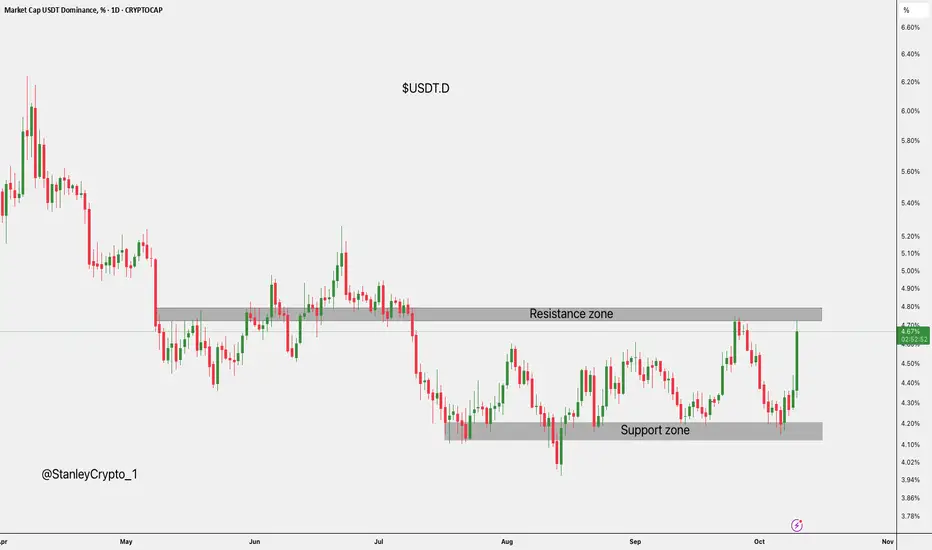
Usdtdominance
$USDT dominace.CRYPTOCAP:USDT dominance is rising from the 4.1% support zone toward 4.8% resistance, showing strong momentum and potential for further gains if it breaks higher.
DYOR, NFA
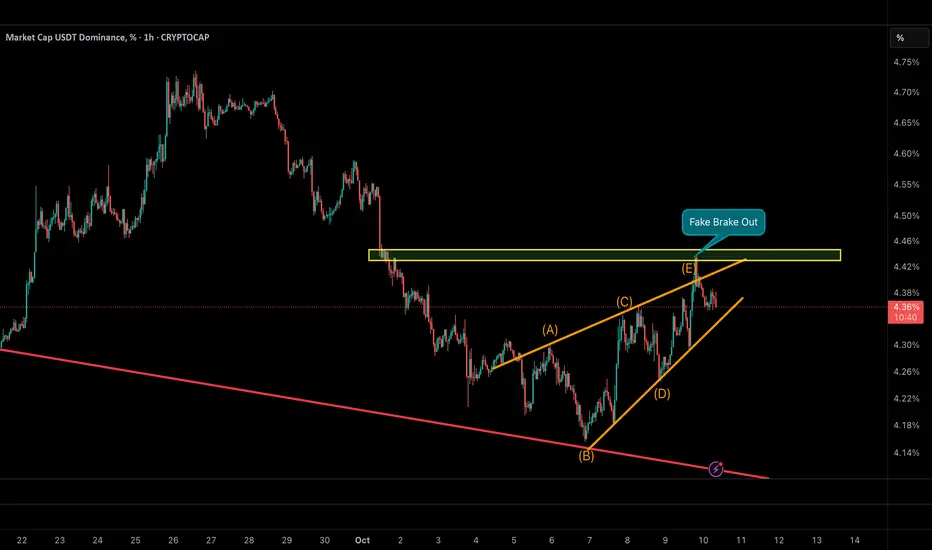
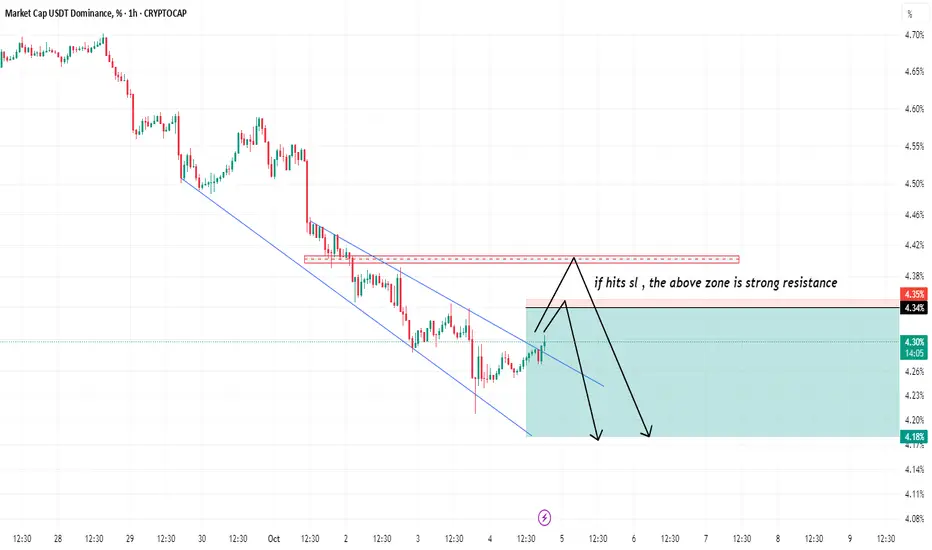
USDT Dominance – Fake Breakout Signals a Potential Altcoin ShiftUSDT Dominance has completed a contracting wedge pattern (A–B–C–D–E), followed by a fake breakout above the key resistance zone near 4.45%.
This move likely trapped late buyers of USDT at liquidity highs.
As long as dominance remains below 4.35%, the probability of a deeper decline toward 4.15–4.20% increases —
which could mark the beginning of capital rotation into altcoins.
In contrast, a confirmed breakout above 4.46% would invalidate this setup and suggest a new sideways phase.
📉 Base Scenario: Continuation of decline toward 4.15–4.20%
🚀 Implication: Growing probability of an upcoming Altseason
USDT.D(based on NEo wave)the bigger degree is a huge triangle and also wave E is a triangle with abcd waves which all are diametrics.
I hope wave e break the curse and change the pattern.
USDT.D 4H Analysis - Key Triggers Ahead☃️ Welcome to the cryptos winter , I hope you’ve started your day well.
⏰ We’re analyzing USDT Dominance on the 4-Hour timeframe .
👀 On the 4-hour timeframe, USDT Dominance has started to recover after its recent drop, bouncing from the support zone at 4.17% and now moving upward, forming a reaction to the previous bearish leg. The structure shows a steep descending trendline, and once broken and confirmed above, dominance could move toward its next resistance zones and enter a correction phase relative to its previous leg. The key resistance levels to watch are 4.33% and 4.38%.
🧮 The RSI oscillator currently faces a static resistance around 45. If volatility pushes above this level and holds, it would confirm bullish momentum and act as a signal for correction continuation.
🕯 The recent candles on Tether Dominance have shown range-bound behavior with weakening bearish pressure, while the 4.17% support has attracted buyers — causing an increase in bullish candles and momentum toward upper resistance zones. A breakout above the descending trendline could confirm a corrective move upward, which seems quite plausible given the current 4H candle structure.
🧠 For profit-taking strategies, you may consider securing partial profits from your open long positions, or moving your stop-losses into profit to protect gains. Meanwhile, start refreshing your watchlist and identifying new price triggers so that you can re-enter positions after reaction or breakout confirmations from upcoming setups.
❤️ Disclaimer : This analysis is purely based on my personal opinion and I only trade if the stated triggers are activated .

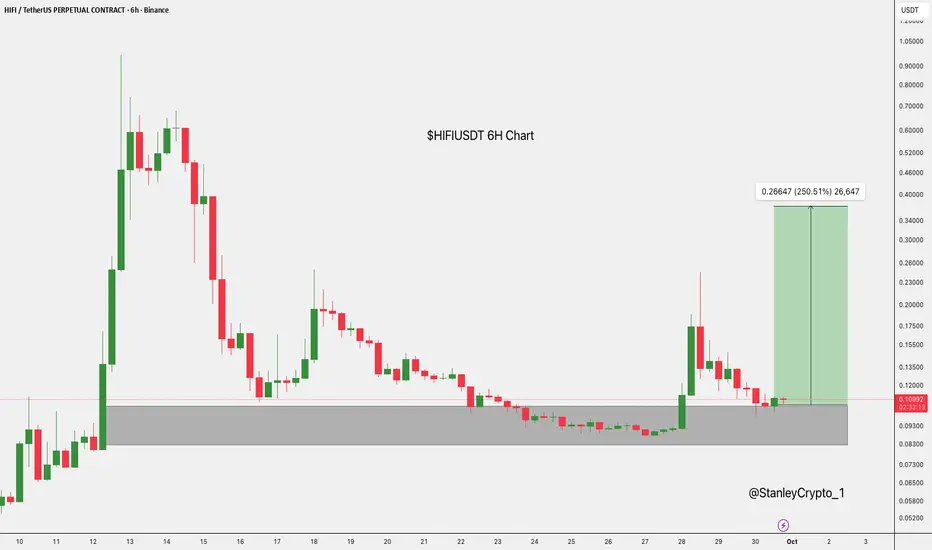
$HIFI showing strength at key support, potential upside ahead$HIFI is holding steady in a key demand zone.
This area has sparked strong reactions before, hinting at accumulation.
If it holds, the price could rally toward 0.37240, representing a roughly 250% move. But if the zone breaks, the setup turns bearish.
DYOR, NFA
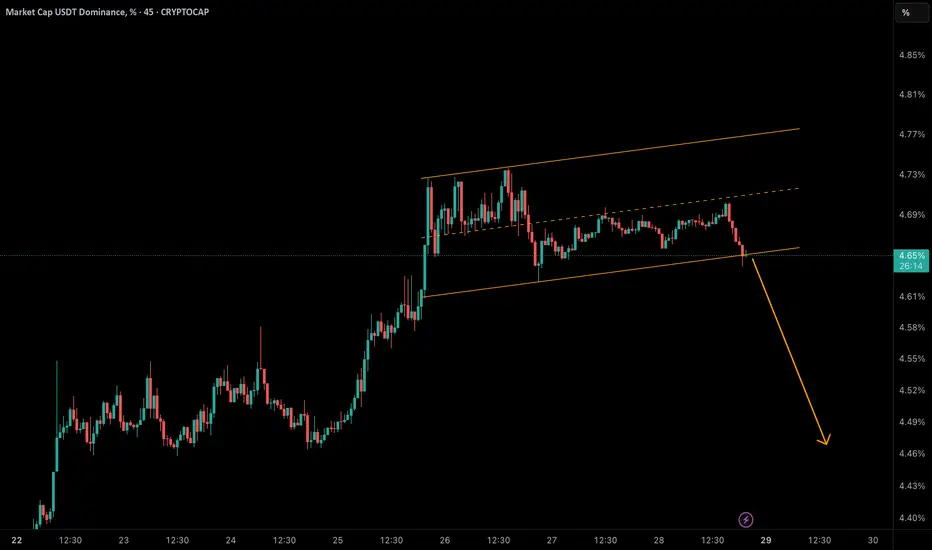
USDT Dominance at a Critical Breakout Point!USDT dominance has touched the bottom of its rising channel near 4.65%.
• 🔻 A breakdown below this support could trigger a correction toward 4.58% → 4.50% → 4.45%.
• 🟢 But if buyers defend this zone and reclaim 4.70%, we may see another push toward 4.75% – 4.77%.
📈 Why it matters: Falling USDT dominance often signals liquidity flowing back into crypto & altcoins, potentially sparking short-term rallies.
USDT Dominance Eyes Continuation After Double BottomUSDT dominance (USDT.B) on the daily timeframe has shown a strong shift in momentum. After breaking the trendline, price action confirmed a double bottom formation, pushing dominance steadily upward. Right now, there’s a small chance of a retracement around the 4.56% area, where order flow could reset before continuation.
Technically, the chart has already posted two lower highs, forming a bullish setup that favors another higher low before moving higher. If dominance keeps climbing, the crypto market may face strong selling pressure—Bitcoin and altcoins could bleed in the coming week.
However, the invalidation point sits below 4.2%. A breakdown from that level would signal weakness, potentially giving relief to Bitcoin and altcoins for an upward move.
👉 Keep an eye on 4.56% for a possible bounce and 4.2% as a key invalidation. The next few sessions may decide whether USDT dominance continues its bullish leg or offers crypto traders a breather.

BTC 1H Analysis - Key Triggers Ahead | Day 48❄️ Welcome to the cryptos winter , I hope you’ve started your day well.
⏰ We’re analyzing BINANCE:BTCUSDT on the 1-Hour timeframe .
👀 On the 1-hour timeframe, Bitcoin previously formed a consolidation box at a higher range. After breaking the bottom of that box, it moved down to its support area around $108,800. Since the start of the weekend, price has been ranging in this zone, forming a new consolidation structure. The bottom of this range overlaps with the Tether Dominance resistance, creating a key confluence level. Candle size has been shrinking, signaling an incoming decision point for the next move.
A break above the range high at $109,755 could trigger upward momentum. An important detail here is the fakeout at the top of the range, where buyers failed to push higher and sellers drove price back down.
🧮 The RSI oscillator shows two key levels:
52: Slightly above the 50 baseline, acting as momentum resistance.
30: At the oversold boundary, where a breakdown could start a stronger move.
The previous fakeout at the range high was aligned with a rejection from the RSI resistance around 52, which reinforces the validity of this level. A momentum breakout through this zone could support a long setup.
🕯 Candle size and volume have significantly decreased due to consolidation and the weekend lull. With increased volume at the start of the new week, we can expect stronger candles. It doesn't matter which direction initiates the move — the breakout from this range will likely occur through a whale candle that clears the orderbook in one direction.
💵 From earlier Tether Dominance analysis, a break below 4.46% could inject bullish volume into the market and allow Bitcoin to break its range high and begin a new upward leg. However, a break above 4.72% on Tether Dominance could trigger deeper correction in Bitcoin, pushing it toward lower supports.
🧠 Two main scenarios for Bitcoin positions are currently in play:
1️⃣ Long Setup :
Wait for multiple rejections to complete and for Tether Dominance to lose the 4.46% support. A small green indecision candle before the breakout on Bitcoin would offer a clean entry with a tight stop. As volume increases and confirmation appears, the long position can be held to a suitable reward target. This setup can be taken in inverse correlation to Tether Dominance, using bearish candles there as confirmation.
2️⃣ Short Setup :
If Tether Dominance breaks above resistance and Bitcoin loses its current range support — combined with RSI dropping below 30 and price stabilizing under current support, ideally with a red indecision candle — a short setup becomes valid. However, note that Bitcoin demand is currently rising, and upward movement could occur at any moment. Personally, you prefer not to take short positions here.
❤️ Disclaimer : This analysis is purely based on my personal opinion and I only trade if the stated triggers are activated .

USDT.D 1H Analysis - Key Triggers Ahead❄️ Welcome to the cryptos winter , I hope you’ve started your day well.
⏰ We’re analyzing CRYPTOCAP:USDT.D on the 1-Hour timeframe .
👀 On the 1-hour timeframe, Tether Dominance moved upward after breaking above the 4.46% level. However, buyers were unable to push through the 4.72% resistance, and the market reacted (rejected) at that zone. This reaction formed a multi-timeframe consolidation box. The top and bottom of this box now act as key levels to determine the next market direction:
Break above 4.72% ➝ Potential for deeper correction in the crypto market.
Break below 4.46% ➝ Possible trend reversal and confirmation of renewed upside momentum.
The market is currently in a low-volume weekend phase, and price action is range-bound. With the start of the new week, there’s a higher probability of breaking out of this consolidation.
🧮 The RSI oscillator shows that after reaching the overbuy zone, price couldn’t sustain time there and was quickly rejected, forming the current market floor. Another key RSI level is around 44, which aligns with the 4.46% support. If momentum crosses below this zone, volatility could increase and trigger the next leg of movement.
🕯 On the 1-hour chart, there have been numerous green candles, indicating a deeper market correction as earlier buyers take profit and sell. This move continued until the 4.72% resistance, and the current range structure shows:
Red candles slightly larger
Green candles more frequent but smaller
This signals weakening bullish momentum, increasing the likelihood of a break below the 4.46% support.
🧠 With the current sideways structure, two main scenarios are in play:
1️⃣ Breakdown of the lower boundary (4.46%)
Could trigger a strong bullish leg in crypto, pushing the market upward.
If this happens, it could be an ideal scenario, supporting a broader crypto rally.
2️⃣ Breakout above the upper boundary (4.72%)
Would likely lead to a deeper correction across the market.
This scenario could result in significant drops in Bitcoin and Ethereum.
Keep both the ceiling and floor of Tether Dominance in mind as the new week begins. The current range is relatively narrow, meaning a breakout could even occur as early as tomorrow during the New York session.
❤️ Disclaimer : This analysis is purely based on my personal opinion and I only trade if the stated triggers are activated .

USDT Dominance Hits Channel Top – Correction Ahead?USDT dominance has reached the top of its channel, completing a potential 5-wave Elliott structure. This suggests that a corrective ABC pattern may follow.
• 🟢 Key Resistance: 4.60% – 4.65%
• 🔻 Expected Correction: toward 4.20% – 4.30%
• 📈 Market Impact: A decline in USDT dominance often means capital flowing back into crypto & altcoins.
If this scenario plays out, we could see altcoins breathing again in the short term.

$NEAR/USDT: 177% Rally Potential!CRYPTOCAP:NEAR is breaking through key resistance at $3.136, with a potential target of $8.753, a 177% upside.
The price is showing strong momentum, signalling a possible rally ahead.
Keep an eye on this one!
DYOR, NFA

USDT.D 1H Analysis - Key Triggers Ahead👋🏻 Hey everyone! How’s it going? Hope you’re all doing well.
❄️ Welcome to Crypto Winter.
⏰ Today, we’ll be analyzing USDT.D and exploring its potential opportunities.
👀 On the 1H timeframe of USDT dominance, we noticed that after touching the support zone, we were expecting a breakdown. However, with a fake-out, it reversed and is now correcting upwards. The next resistance for USDT dominance could be around 4.34%.
🧮 The RSI oscillator is approaching the key level around 70 (overbuy zone). If USDT dominance enters this area, it could trigger a deeper correction in the market.
🕯 The green candles in USDT dominance (profit-taking and closing of long contracts) are gradually increasing. We should watch closely how these candles react as we approach the 4.34% resistance level.
🧠 Since we don’t want to open shorts here, the best strategy is to wait and see how USDT dominance reacts before entering any positions. This is very important. In the meantime, we can build a watchlist and focus on other setups.
❤️ Disclaimer : This analysis is purely based on my personal opinion and I only trade if the stated triggers are activated .

Others.d 4H Analysis - key Triggers Ahead👋🏻 Hey everyone! How’s it going? Hope you’re all doing well.
❄️ Welcome to Crypto Winter.
⏰ Today, we’ll be analyzing Others.d and exploring its potential opportunities.
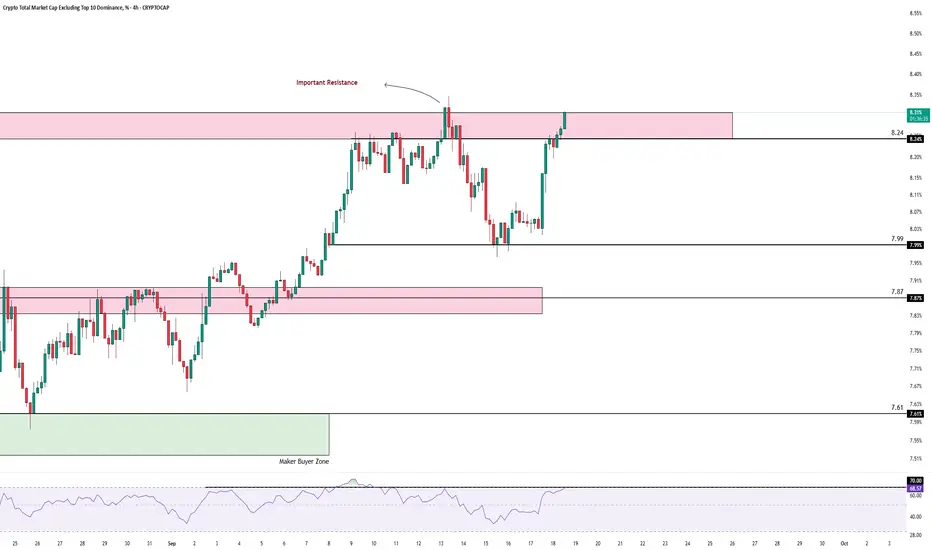
👀 On the 4H timeframe, looking at the Others.D index, we can see that this index moves inversely to Bitcoin dominance (BTC.D) and Tether dominance (USDT.D). It reflects the capital flow into altcoins (excluding BTC and ETH). Currently, it has been consolidating inside a tight box structure. After breaking above the seller’s trigger zone — the top of the box — at 7.87%, it moved upward but got rejected at the 8.3% resistance.
💡 After the rejection, it formed a higher low compared to the previous one, showing respect from buyers. Momentum then picked up quickly, pushing the price back toward the 8.3% resistance with fewer green candles but stronger momentum. We are now retesting this resistance, and a confirmed breakout here could serve as a first small confirmation for a potential altcoin bull run.
🧮 Looking at the RSI oscillator, one critical level stands out: the 70 overbought zone. Considering the recent positive economic data, which fueled capital inflows into equities, this level gains even more weight. It may provide further support for Others.D cap to push higher.
🕯 After breaking out of the box, candle size and volume looked normal, but at the formation of the higher low, buyers strongly respected that level — suddenly the candle size increased sharply, showing FOMO from buyers and fresh capital entering risk assets.
🧠 We now have multiple confirmations for a possible breakout and stabilization above this resistance. If it happens, several altcoins with strong setups should be on the watchlist for entries. A clean breakout could also provide the green light to open long-term futures positions on altcoins, as a stronger rally may follow.
❤️ Disclaimer : This analysis is purely based on my personal opinion and I only trade if the stated triggers are activated .
$USDT Dominance Bullish Divergence Signals RotationUSDT dominance is flashing a clean bullish divergence while MACD builds a tidy double-bottom structure. When the USDT share of the market starts climbing, it usually means traders are rotating into cash for safety. That often lines up with softer BTC momentum and underperformance across altcoins.
What I’m watching:
Momentum: bullish divergence suggests buyers are defending the recent higher low on dominance.
MACD: a double bottom with a fresh uptick strengthens the case for a push higher.
Market knock-on: a rising USDT dominance tends to pressure BTC first, then bleeds into ALT/BTC pairs.
How I’m planning it:
If dominance breaks above the recent swing high with expanding momentum, I’ll trim risk on alts, favor BTC over high-beta names, and wait for cleaner entries after a reset.
If dominance stalls at resistance and rolls over, that’s my cue for a short-term risk-on bounce, with attention on strong ALT/BTC setups.
Alerts: prior swing high on dominance, MACD signal cross, and any bearish divergence that hints at a rollover.
Invalidation:
A daily close back below the most recent higher low on dominance plus a MACD roll-down would weaken the thesis and point to a relief phase for alts.
TL;DR: USDT dominance looks ready to push higher on bullish divergence and a MACD double bottom. Historically, that leans risk-off for BTC and alts until dominance cools off again.

$WUSDT Breakout: 269% Potential Ahead!$W just broke past a major resistance level, setting its sights on 0.4075, which could mean a massive 269% Gain.
After a long downtrend, it's finally showing some serious bullish momentum.
If this continues, we could see some big moves heading into October.
DYOR, NFA

USDT DOMINANCE Looks Bearish (4H)We have a major downtrend on Tether dominance. When we see strong downtrends, every upward correction should be monitored carefully, because once the correction trendline breaks, it can be a signal for the continuation of the larger downtrend.
Right now, the corrective upward trendline has been broken, no higher highs have formed, and we see bearish CHs on the chart.
Price can pull back toward the flip zone and then drop again to lower levels, even toward the green area.
This means we must be cautious with our short sell positions, because Bitcoin and Ethereum may register new all-time highs!
For risk management, please don't forget stop loss and capital management
Comment if you have any questions
Thank You

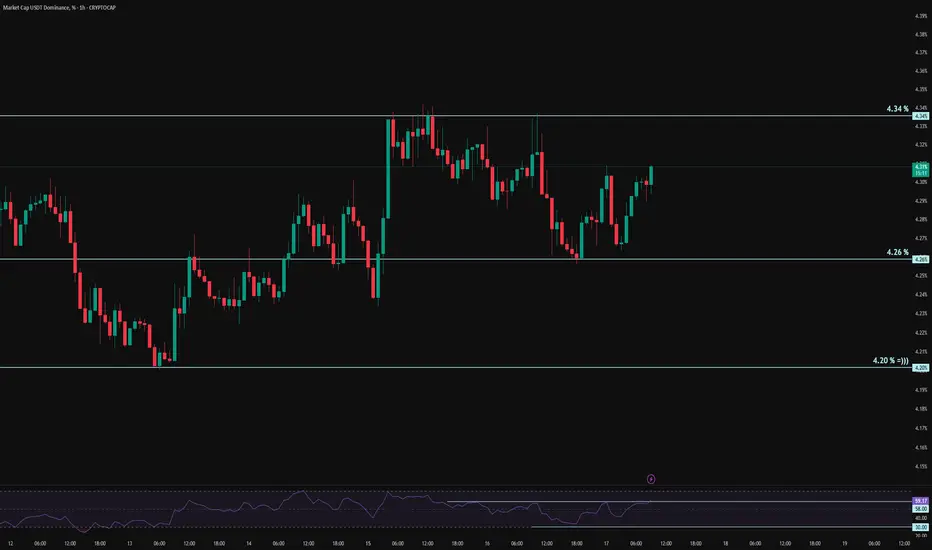
USDT.D Analysis 1H - Key Triggers Ahead👋🏻 Hey everyone! How’s it going? Hope you’re all doing well.
❄️ Welcome to Crypto Winter.
⏰ Today, we’ll be analyzing Coin X and exploring its potential opportunities.
👀 On the 1H Tether dominance chart we can see that after reacting to the 4.20% zone, dominance bounced upward and built a solid base that confirms bullish momentum for the market. Right now, it’s trapped between two key levels: resistance at 4.34% and support at 4.26%. A clean break of either side should give us the market direction. Keep in mind that today’s news brings multiple scenarios into play.
🧮 On RSI, the two critical zones are 58 and 30. If momentum breaks through either, Tether dominance could move with much more strength.
🕯 After the 4.20% bounce, the green candles have grown larger, but now the uptrend shows signs of weakness. Candles forming near these support and resistance zones will be crucial in reading the next move — for example, a red indecision candle on AVAX might line up with a small bullish indecision elsewhere, and the hidden meaning behind that is what matters.
🔴 As for today’s fundamentals, the outlook is mixed. Bullish scenarios depend on a step-by-step rate cut, and if cuts continue, more Tether will flow out into the market.
🧠 For futures trading, Tether dominance is very useful. If dominance breaks down through 4.26% or 4.20%, we can use a candle setup or stop-buy to enter. My personal take: if you didn’t open a position yesterday, you can still take a very low-risk entry here on an altcoin from your watchlist. Keep risk around 0.25% — that would be ideal.
❤️ Disclaimer : This analysis is purely based on my personal opinion and I only trade if the stated triggers are activated .
#USDT Dominance :- Altseason knocking the door?If you realised gains last week, consider booking partial profits while USDT remains above a 283-day support level.
The price structure resembles a head and shoulders formation, a typically bearish signal. A break of that support could trigger significant selling across the altcoin market.
If you need more updates, hit that like button and share your views in the comments section.
Thank you
#PEACE

$EPTUSDT Ready for the Next Leg Up$EPT finally broke out of its long accumulation zone.
If it can hold above that grey support area, buyers look set to drive the next big move upward.
DYOR, NFA


$ETH Breakout Signals 10% Upside PotentialCRYPTOCAP:ETH has broken out of its downtrend and reclaimed support around 4.5K.
If it holds, momentum could push toward 5K, nearly a 10% move.
DYOR, NFA
