USDT DOMINANCE Analysis (12H)This analysis is an update of the analysis you see in the "Related publications" section
First of all you should know that "USDT Dominance" is always moving inverse of BTCUSDT .
After hitting the green zone, it pumped more than 8%, which caused a correction in Bitcoin and altcoins. This bullish move in Tether dominance may continue for now.
For risk management, please don't forget stop loss and capital management
Comment if you have any questions
Thank You
Usdtdominance

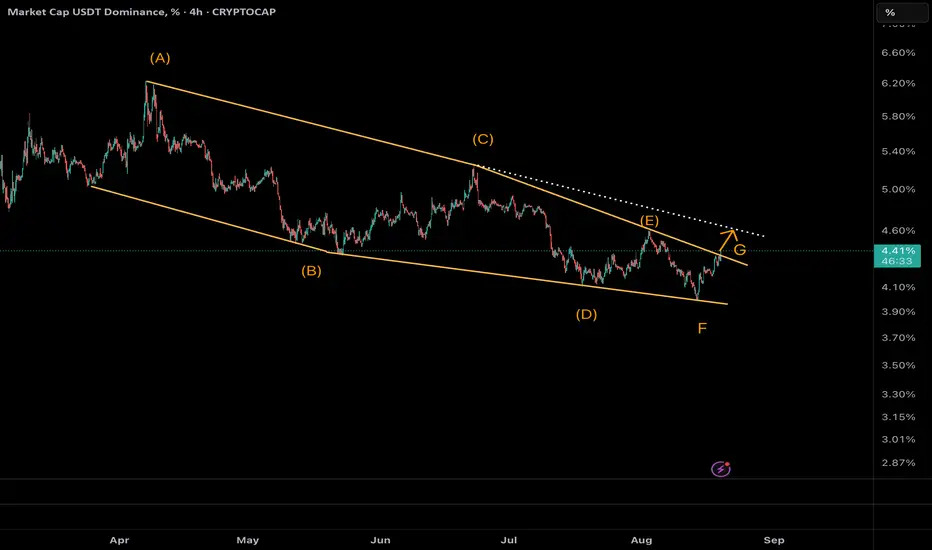
USDT.D Daily | Explosive Surge from 4% –Altcoins Bloodbath Ahead🔹 Overview
USDT Dominance (USDT.D) has completed a 7-wave Diametric correction inside the descending yellow channel. Now, Wave G is accelerating with strong momentum.
, dominance is at 4.33%, breaking the channel trendline. This confirms the end of the correction phase and signals the start of a dominance rally.
Our prior forecast from the 4% floor is playing out exactly—capital is flooding into stables as risk-off sentiment crushes Altcoins.
⸻
🔹 Wave Structure (NeoWave)
• Diametric unfolded as A-B-C-D-E-F-G.
• Symmetry holds: large A/C/E/G vs. small B/D/F.
• Trendline break = pattern completion.
Monowave count (~55–70) confirms the structure’s legitimacy.
⸻
🔹 Technical Setup
• Current support: 4.28% (brown line).
• Target 1: 4.6% (Fib 1.618 extension + trendline).
• Target 2: 5% (channel midline).
• RSI bullish divergence + rising volume confirm strength.
⸻
🔹 Market Implications
This breakout means:
⚠️ Altcoin Bloodbath incoming.
USDT dominance rally = liquidity moving away from alts. BTC/ETH may stabilize, but alts risk heavy drawdowns.
⸻
🔹 Trade Idea (Bullish USDT.D)
• Entry: Long USDT.D (or short alts) above 4.33% on BOS confirmation (daily).
• Targets: TP1 = 4.6%, TP2 = 5%.
• Stop Loss: Below 4.28%.
• Risk: 1–2% per trade. Trail stops if midline breaks.
⸻
🔥 Get ready for a stablecoin takeover & brutal altcoin flush.
BTC 1H Analysis – Key Triggers Ahead | Day 16💀 Hey , how's it going ? Come over here — Satoshi got something for you !
⏰ We’re analyzing BTC on the 1-hour timeframe timeframe .
👀 On the 1-hour timeframe for Bitcoin, we can see that after losing the $115,000 support zone, Bitcoin is moving toward lower price levels. With increasing selling pressure, a deeper correction is likely.
⚙️ Our key RSI level is 33. If this level breaks down, short positions will gain more momentum, and the probability of entering the oversold zone will increase.
🕯 Candlestick behavior shows that bearish/red candles are larger in size and volume, initiating each corrective wave strongly. In contrast, bullish candles are smaller in size, higher in number, and have less volume, which reflects the strong dominance of sellers.
💵 USDT dominance (1-hour timeframe) has successfully broken above 4.37%. The next resistance lies at 4.50%. If this level is also broken, it will likely trigger even more selling pressure on Bitcoin.
🔔 Alarm Zone : There is no specific alarm zone right now, but by watching for pullbacks and breakouts in either direction, we can determine when to open new positions.
❤️ Disclaimer : This analysis is purely based on my personal opinion and I only trade if the stated triggers are activated .

BTC 1H Analysis – Key Triggers Ahead | Day 15💀 Hey , how's it going ? Come over here — Satoshi got something for you !
⏰ We’re analyzing BTC on the 4-hour timeframe timeframe .
👀 On the 4H timeframe of Bitcoin, we can see that after breaking the $117,000 zone, Bitcoin faced strong selling pressure, which aligned with the Tokyo session open.
⚙️ The key RSI level is at 26. If this level is lost, Bitcoin could face even stronger selling pressure. The current RSI is around 30, which is marking a boundary for short-trade volatility.
🕯 Both trading volume and sell orders are increasing. With stronger selling pressure, Bitcoin could see a deeper correction.
💵 USDT dominance is getting heavier and forming green candles. However, the dominance is showing weakness in its upward trend. With strong support from USDT buyers, it could trigger a deeper correction across the broader market.
🔔 It’s better not to set alert zones yet, as Bitcoin is currently in a decision-making area, building a new structure. Once this new structure forms, our alert zones will become clearer.
❤️ Disclaimer : This analysis is purely based on my personal opinion and I only trade if the stated triggers are activated .

USDT.D :Dominance Surge Confirmed–More Altcoin Pain IncommingBuilding on my previous analysis ("USDT.D (2H): Dominance Rebound to Trigger Altcoin Bloodbath?"), where I called the bounce from the channel floor at ~4% spot-on—dominance rallied as predicted, pressuring alts into further dumps—we're now seeing sustained upward momentum. As of August 17, 2025 (09:12 CEST), USDT.D at 4.23% is testing resistance, signaling continued capital flight to stables.
NeoWave Update:
The ABC correction is evolving, with Wave B/X pushing toward the yellow trendline at 4.35%-4.4% (38.2%-50% Fib retrace). Channel support held, and the rebound aligns with time symmetry (~61.8% of prior drop). Monowaves (~50-65) confirm no exhaustion yet.
Altcoin Impact:
Expect dominance to hit 4.4%, accelerating altcoin bleeds (ETH to 3800-4000, 38.2%-50% retrace). Invalidation below 4.18%.

BTC 1H Analysis – Key Triggers Ahead | Day 13💀 Hey , how's it going ? Come over here — Satoshi got something for you !
⏰ We’re analyzing BTC on the 1-hour timeframe timeframe, we’re observing price action.
👀 After the recent drop, Bitcoin has moved into a 1H range box. A breakout on either side of this box can give us a potential long or short setup.
🕯 Trading volume is lower due to the holidays, and Bitcoin usually carves out a decision zone toward the end of each week.
⚙️ Our RSI oscillator shows an important swing area around the 50 level. Holding above 50 increases the odds that the $117,000 floor will act as stronger support.
🔔 Two alert zones based on the chosen breakout: price behavior around $119,000 and $117,000 can help determine which position to take.
💵 We’re monitoring Tether (USDT) dominance. It’s also sitting in a 1-hour range box; a breakout in either direction could feed trading volume into Bitcoin .
🖥 Summary: Bitcoin is in a 1-hour multi-timeframe range box, and the $117,000 support looks firmer than before.
❤️ Disclaimer : This analysis is purely based on my personal opinion and I only trade if the stated triggers are activated .

USDT DOMINANCE Analysis (8H)The structure of Tether dominance in higher timeframes is genuinely bearish, but in lower timeframes, it is approaching a key support level.
It is expected that the dominance will have a few reactions to this support before dumping.
During the next dump in Tether dominance, altcoins are expected to pump. Let’s see what happens.
For risk management, please don't forget stop loss and capital management
When we reach the first target, save some profit and then change the stop to entry
Comment if you have any questions
Thank You

BTC 1H Analysis – Key Triggers Ahead | Day 12💀 Hey , how's it going ? Come over here — Satoshi got something for you !
BINANCE:BTCUSDT
⌛ On the 1-hour Bitcoin timeframe, we can see that the trend has shifted from bullish to a deep correction. The reason for this move was the release of higher-than-expected Producer Price Inflation, influenced in part by Trump’s tariff policies. As a result, the likelihood of an interest rate ( CPI) cut has decreased — which is not particularly favorable news for the market.
👀 After forming a new all-time high, Bitcoin faced heavy selling pressure and a sharp rejection, pushing it towards support levels. The current key support for Bitcoin is at $117,200, which could attract market makers (buyer entries). The next support is likely around $115,000.
🎮 Fibonacci levels have been drawn from a higher low to Bitcoin’s all-time high. The most important levels are $117,200 and $119,800. A breakout above or below these levels could provide potential long or short trading opportunities.
⚙️ On the RSI, the key resistance zone is at 35.88. Historically, each time the RSI has reached this level, Bitcoin has reacted strongly. A rejection here could lead to a deeper correction, while a breakout above it could trigger upward momentum.
🕯 Both trading volume and the number of transactions are increasing, but selling pressure is leaving increasingly “red” candles. This rise in volume could be a useful signal for planning entries.
🔔 There’s no specific alarm zone today since Bitcoin is in a phase of uncertainty, and the exact reason for the market’s drop has not yet been fully absorbed.
CRYPTOCAP:USDT.D 📈USDT.D has broken a strong resistance level and is now moving toward its next resistance .
🖥 Summary: Trump’s tariffs have fueled higher producer inflation, reducing the chances of a rate cut. Bitcoin’s critical support is at $117,200; if this breaks, the price could move towards lower levels.
❤️ Disclaimer : This analysis is purely based on my personal opinion and I only trade if the stated triggers are activated .

USDT Dominance at crucial 3.8 percent support level !USDT dominance is hanging around the 4% mark, and history shows it doesn’t spend much time below here. The 3.8% zone has been a strong bounce point—think March 11, 2024, and again late December / late January, both forming a clean double-bottom.
Right now, we could be setting up for the same pattern. If 3.8% holds, a bounce is likely, and we could see dominance climb back toward the 6–6.5% zone before rolling over.
But if it breaks decisively below 3.8%, that would be a first in years and could trigger a larger market shift—possibly a super cycle where BTC runs toward 150–200K.
Historically, late August into September often brings corrections or dumps, so I’m watching closely over the next few weeks.
Bottom line:
3.8% holds → bounce likely.
3.8% breaks → game changes completely.
What’s your take—bounce or break?

USDT.D (Tether Dominance) Chart Study - More Clues RevealedJust a quick update on this study, as boring as it may seem to some...
This continues to reveal clues, and while it's not a leading indicator necessarily -- But it's very interesting that this trendline has held since 2018 and last night when Bitcoin and the Total Market Cap was rallying -- USDT.D was breaking down below the trendline for the 1st time...
I made a comment in a video, that if this breaks below on a closing basis -- We'd see a massive rally in Bitcoin.. BUT that maybe it was a signal that Bitcoin was overbought and would revert.
And that's what happened. Interesting.
So the trendline held.
For those new to this study, this shows the inverse relationship between stabledoins and crypto.
Obviously, money flowing into one comes out of the other.
So when markets rally and bull markets are peaking, USDT.D flows are at their lowest.
When USDT.D (as a surrogate for stablecoins) rallies, money is flowing out of Bitcoin and crypto as a whole, so Total Market Cap and crypto as a whole is selling off.
That's why I'm watching this chart carefully.
And while USDT.D can stay just above this lower rising trendline for weeks, ultimately it breaks to the upside and signals corrective phases, as well as crashes above certain levels.
TLDR: We have limited time to push to new ATH's and hit $150k as we're expecting, before a correction and HOPEFULLY we get one more cycle push to $200k.
The Blue fractal from 2021 would suggest otherwise, so we should keep that in mind.
Let me know what you think in the comments below.
- Brett

BTC 1H Analysis – Key Triggers Ahead | Day 11💀 Hey , how's it going ? Come over here — Satoshi got something for you !
⏰ We’re analyzing BTC on the 1-hour timeframe , we observe it approaching the 99 moving average .
👀 Bitcoin moved upwards after breaking the $117,500 level, creating a new historical high at $124,474, then was rejected by sellers at this level and is now correcting this upward leg. Today is a news day, so keep an eye on the market.
🎮 A Fibonacci retracement has been drawn from the channel breakout to the new high, showing support at the 0.61 level, which coincides with our 99 moving average, making it a relatively good support zone. The key level for an upward movement is breaking 0.37, which would end our correction trend.
👑 We observe the moving averages where the 7-period moving average has crossed over the 25-period moving average from above, and the price is approaching the 99 moving average.
⚙️ The key RSI zone for us is at 37.84, which has shown an upward reversal, serving as our RSI support. Breaking this zone could lead to further oscillation towards 30. The next key zones are 50 and 70, where Bitcoin could move towards with increased volume and number of trades.
🕯 We see that Bitcoin has experienced increased volume at breakout zones, and there's a strong seller zone above this area where buy orders are triggered each time the price reaches this zone. Breaking this zone would require a significant volume increase from major buyers.
🔔 An alert zone for Bitcoin has been set at 0.37, where upon reaching this price, you can check market behavior for a long position and make the most logical trading decision.
📊 We observe Tether's dominance, which has moved upward after breaking the 4.10 resistance level. The next resistance for Tether's dominance is the 4.20 zone. If this level is broken, Bitcoin could undergo a deeper correction. 💸 Conversely, if it breaks below the 4% level, it could move toward forming a new high.
🖥 Summary : Today is a news day, and Bitcoin could experience unusual fluctuations. Make sure to manage your capital and risk properly. Also, remember that the news released can have several scenarios: initial impact, secondary impact, long-term effects, ... .
❤️ Disclaimer : This analysis is purely based on my personal opinion and I only trade if the stated triggers are activated .
BTC 1H Analysis – Key Triggers Ahead | Day 8💀 Hey , how's it going ? Come over here — Satoshi got something for you !
⏰ We’re analyzing BTC on the 4-hour timeframe , Bitcoin is pushing toward its all-time high with a massive, high-volume whale candle .
👀 After breaking through its resistance zones, Bitcoin surged toward its ATH but faced rejection and selling pressure near that level. Key potential support areas are the 25 and 99 moving averages, marked in yellow and sky blue on the chart. The 25 MA is close to the 0.61 Fibonacci level, around $118,000, and is moving toward the average of the last 25 candles. A reaction to this moving average could indicate whether Bitcoin will rebound or drop further .
⚙️ Bitcoin’s key RSI zone is at 55.25, which corresponds to the $118,000 range. Breaking below this could push RSI under 50 .
🎮 Fibonacci retracement drawn from the breakout and pullback of the V-pattern shows that the 0.13 and 0.23 levels failed under selling pressure, sending BTC toward lower support levels. The current support based on Fibonacci is at 0.37. If this is lost, BTC could range on the 4-hour chart between 0.37 and 0.61 .
✉️ Tomorrow at 8:30 AM New York time, the official CPI (Consumer Price Index) report will be released by the U.S. Bureau of Labor Statistics. This news can significantly impact the crypto market — if inflation decreases, purchasing power rises , and Bitcoin could set a new all-time high .
🕯 BTC trading volume and activity are strong in both directions. Each price surge is followed by a quicker consolidation, and corrections occur under selling pressure .
🔔 An alert zone is set at the 0.13 Fibonacci level to observe price behavior when it reaches that point, then decide on the best course of action .
📊 A break below Tether dominance at 4.10% would signal a long position on BTC, while a break above 4.20% could lead BTC into a deeper correction .
🖥 Summary : Tomorrow’s CPI news could spark large, powerful candles and potentially a new ATH for Bitcoin. If U.S. inflation increases, stronger selling pressure is possible. There’s no specific trigger for this current level, but breaking 0.13 will prompt me to open a position — or at least take trades on altcoins with a bullish correlation to Bitcoin .

Others.d sign the falling of AltCoins this is a classic set up of price action analysis. As it shown in Fig, Others.d reach to fresh order block at 7.9%, after that a Choch and BOS and Retest of it happend.
Now Market is ready to Dump Badly.
get ready of it

BTC 1H Analysis – Key Triggers Ahead | Day 7💀 Hey , how's it going ? Come over here — Satoshi got something for you !
⏰ We’re analyzing BTC on the 1-hour timeframe .
👀 After breaking out of its descending channel, Bitcoin is moving upward with a high-volume whale candle.
🕯 The trading volume and number of trades are rising sharply, and this volume increase during the New York session could lead to Bitcoin forming a new high.
⚙️ Our key RSI level is 74.05. If this level breaks, the volatility of Bitcoin’s long positions could increase significantly, potentially triggering a price surge.
🎮 After breaking the 0 Fibonacci level and pulling back to it, we can open our positions in line with the market structure change and move with the market.
🔒 An upward-sloping trendline has been drawn from the channel’s bottom to the top, and on the fourth reaction to it, Bitcoin bounced and beautifully broke through the channel’s top.
🔔 There’s no specific alert zone unless the current market structure changes, in which case an alert zone will be provided.
🖥 Summary: Bitcoin is moving upward, our long position trigger has been activated, and if the current structure is maintained, it could continue toward higher price levels.
📊 If USDT.D drops below 4.20% BTC might push toward higher targets .
❤️ Disclaimer : This analysis is purely based on my personal opinion and I only trade if the stated triggers are activated .
USDT DOMINANCE New Update (4H)First of all you should know that "USDT Dominance" is always moving inverse of BTCUSDT .
Important zones have been lost; it is expected that when the price returns to the identified supply area, it will be rejected downward again.
For risk management, please don't forget stop loss and capital management
Comment if you have any questions
Thank You

BTC 1H Analysis – Key Triggers Ahead | Day 5💀 Hey , how's it going ? Come over here — Satoshi got something for you !
⏰ We’re analyzing BTC on the 1-hour timeframe .
👀 After triggering its long signals, Bitcoin moved upward and hit the seller zone at 117,500, then reversed from that level.
🎮 A Fibonacci retracement has been drawn from $ 114,200 to $ 117,560. The price entered the zone between the 0.37 and 0.61 levels, and we need to see whether it reacts to 0.61 with selling pressure or pulls back to 0.37. Understanding market behavior in this area can guide us.
✏️ A curve line has been drawn from the first touch of the maker-buyer zone to the first touch of the maker-seller zone. This line intersects well with the 0.37 Fibonacci level, which has now been broken in current conditions.
🔽 With the increase in short positions and selling volume for Bitcoin, the price experienced a decline and correction. If selling pressure continues, Bitcoin could start a short-term correction.
⚙️ Our RSI oscillator is below the 50 level, with a support zone at 41.22. If this zone is lost, market momentum will lean more towards selling and further correction.
💸 BTC.D , if it breaks 60.72 %, could drop to lower levels, making Bitcoin lighter relative to the market.
💵 USDT.D , if it breaks 4.28 %, could also drop to lower levels, reducing Tether’s share in the market and shifting more capital into Bitcoin and altcoins.
🖥 Summary: Bitcoin was rejected from the 117,560 level and, along with selling pressure, dropped below the 0.37 Fibonacci zone. There is a support level at $ 115,530 — as long as the price stays above this zone, Bitcoin can maintain its upward trend with short-term multi-timeframe corrections.
❤️ Disclaimer : This analysis is purely based on my personal opinion and I only trade if the stated triggers are activated .

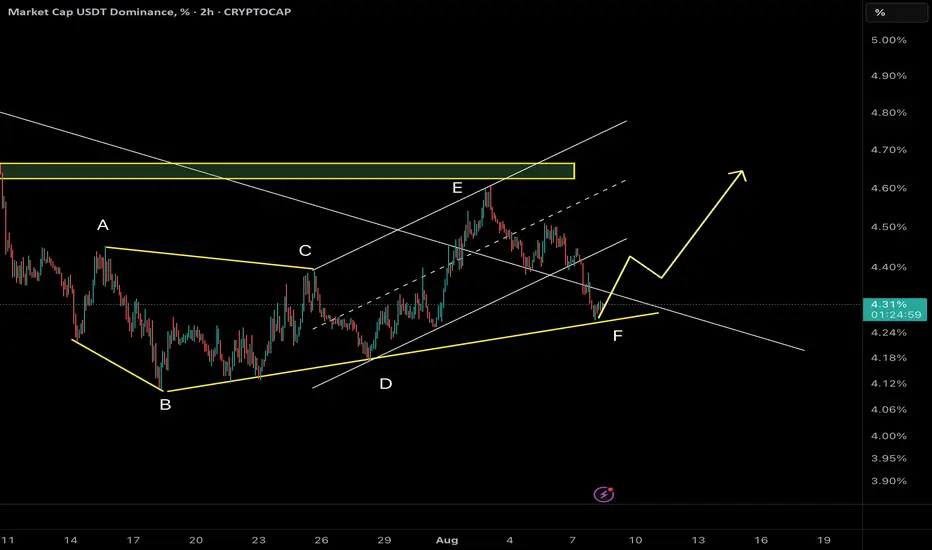
USDT Dominance – Precision Repeats: Final Wave F or Wave G Awake🔸 Market Structure:
Following the previous analysis, which precisely reached both projected targets, Tether Dominance continues unfolding its Diametric formation. After completing Wave E, price action has decisively shifted into Wave F, progressing toward the final stages of this structure.
⸻
🔸 Key Observations:
• The prior scenario anticipated a corrective decline, and price perfectly respected both the 4.40% and 4.28% targets before stabilizing.
• Currently, price is testing the ascending trendline and mid-range of the Diametric.
• Momentum remains corrective but has yet to show clear exhaustion.
⸻
🔹 Scenario 1 (Sc1) – Shallow Wave F Completion (~4.22%):
• Support around the minor ascending trendline.
• May trigger an early bounce if buyers step in.
• Less balanced geometrically for a clean Diametric conclusion.
🔹 Scenario 2 (Sc2) – Extended Wave F Completion (~4.12%):
• Aligns with the lower boundary of the Diametric.
• Provides better proportion and symmetry to finalize Wave F.
• Coincides with prior demand zone and the last reaction pivot.
• Statistically, this remains the higher probability path.
⸻
🎯 Expected Path:
Wave F is approaching maturity, and a deeper test near 4.12% remains likely before any sustainable reversal. Upon confirmation, this could trigger the start of Wave G upward, historically associated with altcoin weakness.
⸻
📌 Summary:
After executing the prior analysis with precision, USDT Dominance has advanced into the final legs of Wave F within the Diametric. Monitoring price behavior near 4.12% will be critical. A bounce here could catalyze Wave G and renewed pressure on altcoins. Should short-term support at 4.22% fail convincingly, deeper retracement becomes even more probable.
⸻
✅ Action Plan:
Closely track the reaction zones at 4.22% and 4.12%. A strong reversal signal (e.g., bullish divergence) could confirm the transition to Wave G.
USDT DOMINANCE New Update (4H)First of all you should know that "USDT Dominance" is always moving inverse of BTCUSDT
We have a key level on the chart that This key level has been lost, and there hasn't been a pullback to it yet. It seems that the candles intend to make a pullback to this level. Upon this pullback, we expect a rejection to the downside.
Let's see what happens.
For risk management, please don't forget stop loss and capital management
Comment if you have any questions
Thank You

Usdt dom next leg down loadingWe are a nice bear flag forming on the usdt dom chart.meaning we should get the next leg down soon. I'm looking for Bitcoin to let alts catch up during this move and for Bitcoin to retest 119k. Bitcoin Dom should drop to 58%.
Will a Drop Below 4.12 Push BTC to New Highs ?👋 Hello, and welcome to Satoshi Frame .
📊 USDT Dominance , after a sharp move toward 6% , got rejected strongly from that level with a powerful candle .
🔻 Following that , it lost its key support and entered a deep corrective phase .
🚀 During this period, Bitcoin and altcoins experienced a strong upward trend , and 🟠 Bitcoin even recorded a new all-time high .
📉 The key support level for USDT Dominance is at 4.12% .
⚠️ If this level is broken, Bitcoin could potentially reach a new all-time high again .
📐 I’ve drawn my Fibonacci from the point where the support was lost , the structure broke , and the previous uptrend turned into a corrective or bearish trend .
🔽 The breakdown of that key support pushed USDT Dominance down to 4.12% , where we saw strong buying pressure in Bitcoin and altcoins, leading to a sharp upward movement.
🔄 Price then retraced to the 0.382 Fibonacci level (4.61%) , acting as a corrective pullback within the ongoing downtrend.
❌ However , this area triggered a rejection , and now we are witnessing another decline in USDT Dominance.
💡 Disclaimer : This analysis is for educational purposes only and should not be considered financial advice . Always do your own research and manage your risk before making any trading decisions .
$ICNT/USDT 3x BreakoutGETTEX:ICNT just broke out of a falling wedge on the 6H chart, a bullish pattern we’ve been watching closely.
The breakout happened right from a strong support zone, which adds confidence.
If momentum holds, we could be looking at a move toward $1 that’s over 3x from here.
Worth keeping an eye on for sure.
DYOR, NFA

Tether Rakes in $4.9B Q2 Profit, Cementing Its Reign as Crypto’sTether Q2 Net Profit Hits $4.9 Billion, Pushing Total Earnings to $5.7 Billion: What It Means for the Crypto Industry
Tether Holdings Ltd., the issuer of the world’s largest stablecoin USDT, has once again made headlines with its Q2 2025 earnings report, revealing a staggering net profit of $4.96 billion. This brings the company’s total profits for the first half of the year to $5.7 billion—a record-breaking milestone for both the company and the broader stablecoin ecosystem.
This article explores the implications of Tether’s Q2 performance, the sources of its revenue, its impact on the crypto markets, and the growing significance of stablecoins in the evolving financial landscape.
________________________________________
A Record-Setting Quarter for Tether
Tether’s Q2 2025 results have astonished even seasoned analysts. The company’s reported $4.96 billion in net profit in a single quarter represents one of the most profitable periods in the history of any fintech or crypto-native company. What’s even more remarkable is that this profit was not driven by speculative trading or token sales, but by conservative, yield-generating strategies rooted in traditional finance.
The company’s Q1 earnings were already impressive at $0.76 billion, but Q2’s results eclipse those numbers entirely. Tether’s cumulative profit year-to-date now stands at $5.72 billion, putting it on track to potentially exceed $10 billion in earnings for the full year if current trends continue.
________________________________________
What’s Driving Tether’s Massive Profit?
Tether’s incredible profitability is primarily fueled by one key factor: the interest earned on its reserves. As the issuer of USDT, Tether is responsible for maintaining a 1:1 backing of every token in circulation. These reserves are primarily held in short-term U.S. Treasury Bills (T-Bills), reverse repos, and cash equivalents.
Here’s a breakdown of the main profit drivers:
1. High Interest Rates on U.S. Treasuries
With the U.S. Federal Reserve maintaining elevated interest rates to combat inflation, short-term T-Bills have become highly lucrative. Tether holds tens of billions of dollars in these instruments, generating billions in annual interest income.
For example, the yield on a 3-month Treasury bill in Q2 2025 averaged around 5.2%, and Tether’s reserve base has hovered near $90 billion to $100 billion. Even a conservative allocation can earn several billion dollars in annual yield.
2. Reverse Repurchase Agreements (Reverse Repos)
Tether has also expanded its use of reverse repos, which allow it to lend cash to counterparties in exchange for securities, earning a premium on the transaction. This has contributed significantly to its earnings, especially in a high-yield environment.
3. Gold Holdings and Bitcoin Exposure
Tether has acknowledged that a small portion of its reserves includes gold and Bitcoin holdings. These assets appreciated in Q2, contributing to the overall profit. While not the primary revenue source, their performance added notable value during the quarter.
4. Equity Investments
The company has begun investing in infrastructure and technology firms related to blockchain and AI. While these investments are not liquid, mark-to-market gains may have also contributed to the net profit figure.
________________________________________
A Closer Look at Tether’s Reserve Report
Tether’s Q2 attestation report, published alongside its earnings update, provides transparency into how its assets are allocated. Here are some highlights:
• Over 85% of reserves are held in U.S. Treasury instruments
• $5.4 billion in excess reserves—a buffer above the value of circulating USDT
• $3.3 billion in gold and Bitcoin holdings
• Minimal exposure to unsecured commercial paper or riskier debt instruments
Tether has continuously emphasized its commitment to transparency and risk management. Unlike in its early years, when it faced criticism over opaque reserve practices, the company now releases quarterly attestations audited by third-party firms such as BDO Italia.
________________________________________
USDT’s Growing Dominance
Tether’s profits are closely tied to the growth of its flagship product: USDT, the world’s largest stablecoin by market cap. As of August 2025, USDT has a circulating supply exceeding $110 billion, giving it a dominant share of the stablecoin market.
This growth can be attributed to several factors:
1. Increased Adoption in Emerging Markets
USDT is widely used in countries with unstable fiat currencies, such as Argentina, Nigeria, and Turkey. For many users, USDT represents a dollar-denominated safe haven in environments plagued by inflation and capital controls.
2. DeFi and Cross-border Payments
USDT continues to be a core asset in decentralized finance (DeFi) protocols, serving as a stable medium of exchange and collateral. It's also a preferred tool for cross-border remittances, given its speed and low transaction costs compared to traditional banking systems.
3. Institutional Integration
Major crypto exchanges, custodians, and payment processors have incorporated USDT into their platforms, driving further liquidity and utility. In many cases, USDT is preferred over fiat due to its 24/7 availability and blockchain-native nature.
________________________________________
What Does This Mean for the Crypto Industry?
Tether’s Q2 performance is more than just a corporate milestone—it’s a bellwether moment for the crypto industry. It signifies the maturation and institutionalization of digital assets and stablecoins. Here’s what it means for the broader ecosystem:
1. Stablecoins as Profitable Financial Products
Tether’s profitability proves that stablecoins are no longer just “crypto plumbing.” They are now financial products generating billions in yield, much like money market funds. This is reshaping how investors and regulators think about stablecoins—not as speculative tools, but as interest-bearing assets backed by real-world securities.
2. Regulatory Scrutiny Will Intensify
With Tether generating profits that rival traditional banks, expect regulators to increase oversight. Stablecoins have long been in the crosshairs of the U.S. Treasury, SEC, and global central banks, and Tether’s dominant market share will likely place it under further examination.
However, Tether’s transparency efforts, including quarterly attestations and reserve disclosures, may help it navigate these regulatory waters more effectively than in the past.
3. Competition Will Escalate
Tether’s extraordinary profits will likely attract new entrants and existing competitors to the stablecoin arena. Circle’s USDC, PayPal’s PYUSD, and even central bank digital currencies (CBDCs) are all vying for market share.
Tether’s early-mover advantage, global reach, and deep liquidity make it hard to displace, but increased competition could pressure margins in the long term.
4. Decentralized Alternatives Will Seek Market Share
Decentralized stablecoins like DAI, FRAX, and USDD aim to offer alternatives to centralized issuers like Tether. While they remain relatively small, the ethos of decentralization might gain appeal, especially in regulatory-heavy environments.
Still, decentralized stablecoins have struggled to maintain pegs during market stress, giving Tether an edge in terms of trust and resilience.
________________________________________
The Road Ahead for Tether
As Tether moves into the second half of 2025, several strategic themes will define its trajectory:
Continued Profitability
If interest rates remain elevated and USDT circulation continues to grow, Tether’s annual profit could reach or exceed $10 billion—putting it in league with the most profitable fintech firms globally. This surplus could be reinvested in:
• Infrastructure expansion
• Strategic acquisitions
• Reserve diversification
• R&D for stablecoin innovation
Expansion into Emerging Markets
Tether has hinted at expanding its presence in Latin America, Africa, and Southeast Asia, where demand for dollar-denominated assets is high and banking infrastructure is limited. Expect to see more localized partnerships and on-ramp/off-ramp solutions.
Embracing Blockchain Innovation
Tether is already deployed on multiple blockchains—Ethereum, Tron, Solana, and more. The company is likely to support new Layer 1s and Layer 2s to enhance speed, reduce costs, and maintain competitiveness in the DeFi space.
There are also rumors that Tether may be exploring tokenized asset offerings and programmable money features, allowing USDT to integrate more deeply with smart contracts and enterprise use cases.
________________________________________
Criticisms and Controversies: Still Lingering?
Despite its success, Tether continues to face criticism from parts of the crypto community and regulatory world. Concerns include:
• Lack of full audits (attestations are not the same as full financial audits)
• Opaque ownership structure
• Past legal issues, including settlements with the New York Attorney General and the U.S. CFTC
However, it’s worth noting that Tether has addressed many of these concerns over the past two years. Its transparency has improved, and its operations have become more conservative and professional.
Still, its scale and impact on the crypto market mean that any misstep could have systemic consequences. Investors and regulators alike will continue to scrutinize its activities.
________________________________________
Final Thoughts: Tether’s Moment of Ascendance
Tether’s Q2 2025 net profit of $4.96 billion doesn’t just reflect a successful quarter—it marks a paradigm shift in crypto finance. What began as a controversial stablecoin project has evolved into a global financial powerhouse, rivaling traditional banks and asset managers in profitability.
More than just a win for Tether, this moment signals the growing legitimacy of stablecoins in the global financial system. It shows that crypto-native firms can not only survive but thrive in traditional financial environments, leveraging yield, transparency, and blockchain infrastructure to create sustainable business models.
As the world watches, Tether’s next chapters will likely be shaped by innovation, regulation, and global expansion. But for now, with $5.7 billion in profits in just six months, one thing is clear:
Tether is no longer just a stablecoin issuer—it’s one of the most powerful financial entities
in the digital age.
________________________________________
Disclaimer: This article is for informational purposes only. It does not constitute financial advice. Always conduct your own research before making investment decisions.
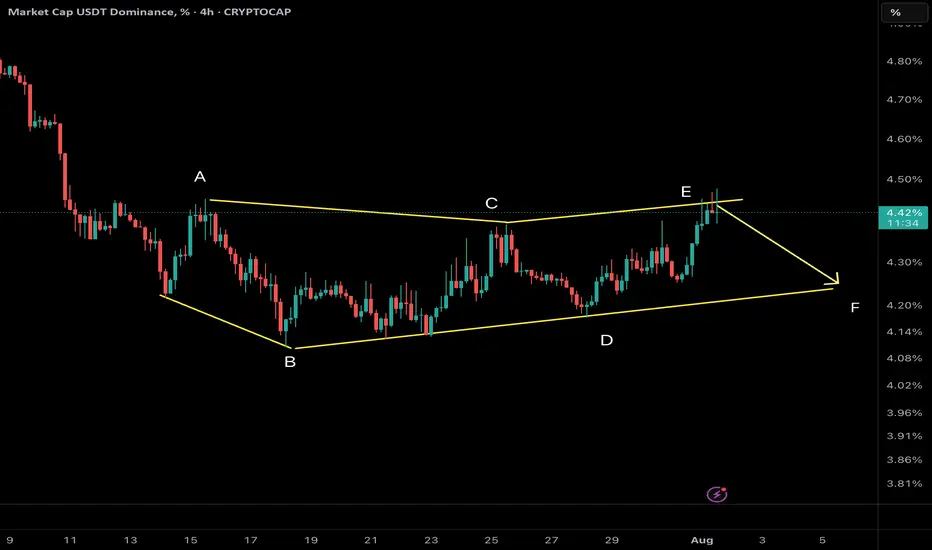
USDT Dominance – Potential Wave F Reversal?
We are tracking a NeoWave Diametric formation (7-leg corrective structure: A–B–C–D–E–F–G) on the USDT Dominance chart. Recently, price reached the projected resistance zone of wave E, and early signs of reversal are emerging.
⸻
🧠 Structural Analysis:
• The structure has developed with alternating legs in price and time, consistent with the symmetrical diametric rules.
• Wave E has likely completed, reacting from prior supply and resistance.
• A pullback from here can mark the beginning of Wave F, which in diametrics tends to retrace significantly toward the internal balance of the structure.
⸻
🔍 What to Watch:
• Confirmation of bearish intent via a break of internal supports or lower-timeframe BOS.
• Possible retracement targets: 4.2% → 3.95%, depending on momentum.
• A decisive break below 4.00% would reinforce the wave F scenario.
⸻
⚠️ Implications for the Crypto Market:
A drop in USDT Dominance typically indicates rotation into risk assets (alts/BTC/ETH). However, context matters — if the drop happens during a general market sell-off, it may reflect risk-off unwinding into fiat, not risk-on rotation.
⸻
🔄 Strategy Note:
• Avoid premature shorts or longs; wait for structure to confirm.
• Watch for smart money traps (e.g., false breakouts or liquidity grabs) around the recent highs.
⸻
📌 This is a high-risk zone for entering long USDT.D — be cautious with stablecoin bias.
📊 Analysis by CryptoPilot – Precision through structure.