USOIL UPDATE📊 USOIL UPDATE — Key Levels in Focus! 🔥
Price is testing an important zone, and traders are closely watching for the next move. Momentum around these levels could indicate short-term strength or weakness in the market.
🔓 Entry Level: 57.48
❌ Stop Loss: 56.91
🎯 Target: 58.03
Keep an eye on how price reacts here — structured levels like these help spot potential opportunities while managing risk effectively.
💬 What’s your outlook on USOIL?
Bullish or bearish? Share your thoughts below and join the discussion! ⬇️
Your engagement helps this post reach more traders and boosts visibility on feeds 👍
Disclaimer: This post is for educational and informational purposes only. It reflects personal chart observation and is not financial advice. Please do your own research before trading.
Crude Oil WTI

CRUDE OIL Free Signal! Buy!
Hello,Traders!
CRUDE OIL has delivered a clean sell-side liquidity sweep into a well-defined horizontal demand area, followed by a strong bullish reaction. This displacement suggests smart money mitigation and absorption, favoring a corrective push higher toward the next liquidity pool.Time Frame 5H.
--------------------
Stop Loss: 56.98$
Take Profit: 58.07$
Entry: 57.47$
Time Frame: 3H
--------------------
Buy!
Comment and subscribe to help us grow!
Check out other forecasts below too!
Disclosure: I am part of Trade Nation's Influencer program and receive a monthly fee for using their TradingView charts in my analysis.

Brent Oil Under Pressure – Key Resistance Zone Holding Strong!🔥 UKOIL / BRENT Energies Market Opportunity Blueprint (Day & Swing Plan) ⚡️
📉 Plan Overview:
Thief is spotting a Bearish Blueprint on UKOIL / Brent — price confirming rejection around the Triangular Moving Average (TMA) zone 📊. A clean pullback and retest structure are forming — time for a layered sell approach to capitalize on energy market volatility ⚙️
🎯 Entry Idea:
Thief enters with multiple limit layers (Layering Strategy) — scaling in smartly with precision entries:
🔹 Sell Limits @ 64.500 / 64.000 / 63.500
(You can increase or adjust the layers based on your own conviction & market timing 🕰️)
🛑 Stop-Loss Guidance:
This is Thief’s SL @ 65.000 💣
Dear Ladies & Gentlemen (Thief OG’s), adjust your stop loss based on your risk appetite and confirmation setups. Risk management is the crown 👑 of consistency.
💰 Target Zone:
Watch out for the Police Barricade Zone @ 60.500 — this level aligns with strong support, potential oversold condition, and a trap + correction scenario 🔦
Escape with profits before liquidity hunts you — take money when you see money 💵
📘 Note to Thief OG’s:
I’m not recommending my SL or TP as mandatory levels — it’s your chart, your strategy, your risk, your reward. Trade smart, not emotional 🧠
🧩 Related Market Pairs to Watch:
🔸 WTI Crude (USOIL/USD) – Highly correlated with UKOIL. A bearish structure here often confirms momentum for Brent.
🔸 USD/CAD 💵 – Inverse correlation! A rising USD/CAD often strengthens the bearish sentiment in crude markets.
🔸 XLE (Energy ETF) – Keeps track of energy sector performance; confirmation of trend strength adds confluence to your trade.
📊 Key Market Correlations:
Oil reacts strongly to USD strength, global demand outlook, and OPEC sentiment. Keep an eye on DXY (US Dollar Index) — stronger dollar usually pressures Brent prices lower 💹
🚀 Thief Quote of the Day:
"Patience pays more than panic — layer in silence, exit in profit." 🕶️
#UKOIL #Brent #EnergyMarket #ThiefTrader #BearishSetup #LayeringStrategy #SwingTrade #OilMarket #WTI #USD #Commodities #TechnicalAnalysis

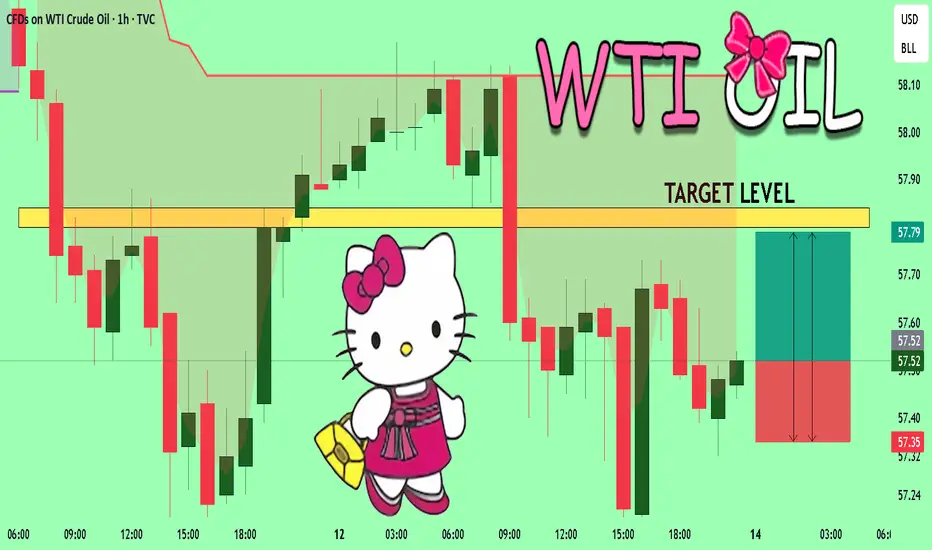
USOIL The Target Is UP! BUY!
My dear subscribers,
This is my opinion on the USOIL next move:
The instrument tests an important psychological level 57.52
Bias - Bullish
Technical Indicators: Supper Trend gives a precise Bullish signal, while Pivot Point HL predicts price changes and potential reversals in the market.
Target - 57.80
My Stop Loss - 57.35
About Used Indicators:
On the subsequent day, trading above the pivot point is thought to indicate ongoing bullish sentiment, while trading below the pivot point indicates bearish sentiment.
Disclosure: I am part of Trade Nation's Influencer program and receive a monthly fee for using their TradingView charts in my analysis.
———————————
WISH YOU ALL LUCK
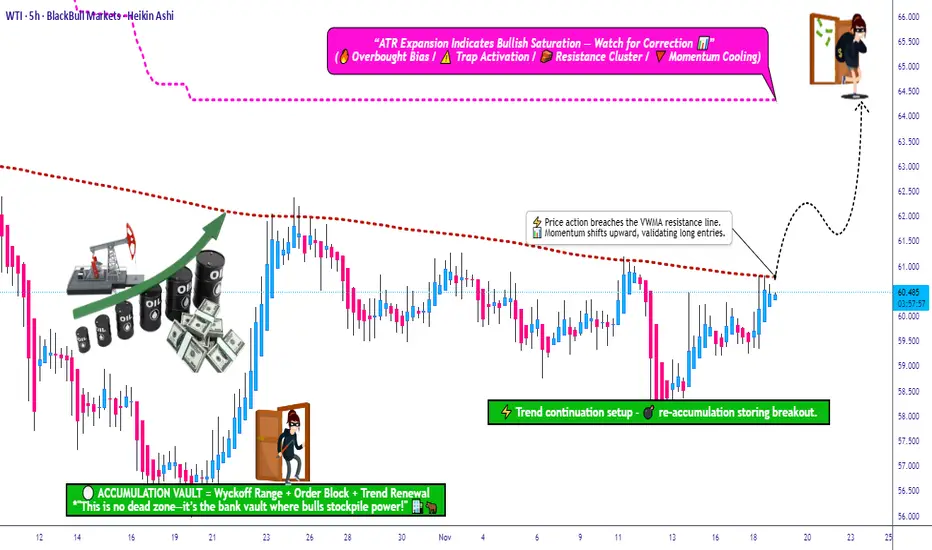
USOIL Breakout Confirmed—Is the Uptrend Ready to Extend?📈 WTI CRUDE OIL (USOIL) – SWING TRADE SETUP | VWMA BREAKOUT CONFIRMED 🛢️⚡
🎯 TRADE OVERVIEW
Asset: WTI Crude Oil (USOIL) – Energies Market
Trade Type: Swing Trade (Multi-Day Position)
Bias: 🟢 BULLISH – Volume Weighted Moving Average (VWMA) breakout confirmed near $61.00
📊 TRADE PLAN
🔹 Entry Strategy: "Thief Layering Method"
Primary Entry Zone: Post-VWMA breakout above $61.00
Layered Limit Orders (Multiple Entry Points):
🟦 Layer 1: $59.00
🟦 Layer 2: $59.50
🟦 Layer 3: $60.00
🟦 Layer 4: $60.50
Note: You can add more layers based on your capital allocation and risk tolerance. This strategy allows averaging into the position as price pulls back.
🛑 Stop Loss Management
Thief's SL: $58.00
⚠️ IMPORTANT: Dear Ladies & Gentlemen (Thief OG's),
This is MY stop loss level. Adjust YOUR stop loss based on YOUR strategy and risk management plan. I do not recommend blindly following my SL – manage your own risk and capital accordingly.
🎯 Take Profit Target
Primary Target: $64.00
Technical Reasoning:
SuperTrend ATR line acts as strong dynamic resistance
Potential overbought zone + bull trap risk
Escape with profits before reversal pressure
⚠️ IMPORTANT: Dear Ladies & Gentlemen (Thief OG's),
This is MY take profit target. Take YOUR money at YOUR own risk. You are responsible for your profit-taking strategy – trail stops, scale out, or exit fully based on YOUR trading plan.
🔗 CORRELATED PAIRS TO WATCH (USD-Denominated)
Monitor these related assets for confirmation and risk assessment:
🛢️ Energy Sector:
Brent Crude Oil (UKOIL) – Typically trades $2-5 above WTI; if Brent is bullish, WTI usually follows
Natural Gas (NATGAS) – Energy sector sentiment indicator
💵 Currency Pairs:
USD/CAD – Inverse correlation to oil (CAD = petro-currency). If oil rises, USD/CAD typically falls
DXY (US Dollar Index) – Strong dollar = bearish pressure on oil. Watch for weakness in DXY to support oil rally
📈 Equity Markets:
Energy Sector ETFs (XLE) – Tracks US energy stocks; bullish XLE confirms oil sector strength
S&P 500 (SPX) – Risk-on sentiment supports commodity prices
⚡ Key Correlation Points:
Oil ↑ + USD/CAD ↓ = Strong bullish confirmation
Oil ↑ + DXY ↓ = Supportive macro environment
Oil ↑ + XLE ↑ = Energy sector momentum aligned
💬 Engagement Call-to-Action
👍 If you found this analysis helpful, smash that LIKE button!
💬 Drop your thoughts in the comments – are you bullish or bearish on oil?
🔔 FOLLOW for more professional trade setups and market insights!
XTI/USD Short Bias – Can Sellers Maintain Control?🛢️ WTI/USOIL BEARISH SWING TRADE - ENERGIES MARKET OPPORTUNITY 📊
⚡ TRADE SETUP: SHORT OPPORTUNITY
━━━━━━━━━━━━━━━━━━━━━━━━━━━━━━━
📍 ASSET: XTI/USD (WTI Crude Oil) | ENERGIES
⏰ TIMEFRAME: Swing Trade (4H - Daily)
📈 BIAS: BEARISH ⬇️
💼 ENTRY STRATEGY - "LAYERING METHOD" 🎯
━━━━━━━━━━━━━━━━━━━━━━━━━━━━━━
Use Multiple Limit Order Layers for optimal entry execution:
✅ Layer 1: $60.00
✅ Layer 2: $59.00
✅ Layer 3: $58.00
💡 Why This Works:
Averages down your entry price
Reduces slippage risk
Allows gradual position building
Maximizes fill probability
🔧 CUSTOMIZABLE: Adjust layers based on YOUR risk management & capital allocation
🛑 STOP LOSS ⛔
━━━━━━━━━━━━━━━━━━━━━━━━━━━━━━
📌 Recommended SL Level: $61.00 (above supply zone)
⚠️ DISCLAIMER: This is a reference point only. Adjust YOUR stop loss based on:
Your risk tolerance
Account size
Trading strategy
Technical support/resistance
🚨 Risk Management First: Never risk more than 2-3% per trade
🎯 TAKE PROFIT TARGETS 💰
━━━━━━━━━━━━━━━━━━━━━━━━━━━━━━
Primary Target: $53.00 ⬇️
📊 Technical Confluence at $53.00:
✓ Strong support zone (oversold recovery area)
✓ Reversal trap potential
✓ High probability profit zone
💡 Profit-Taking Strategy:
Scale out 1/3 at $56.00 (quick gains lock)
Scale out 1/3 at $54.50 (momentum confirmed)
Scale out 1/3 at $53.00 (final target)
⚠️ DISCLAIMER: This is guidance only. Your profit targets should align with YOUR strategy, market conditions, and risk/reward ratio. Take profits at YOUR comfort level.
═══════════════════════════════════════════════════════════════
🔗 CORRELATED PAIRS TO WATCH 📡
━━━━━━━━━━━━━━━━━━━━━━━━━━━━━━
1. USD/CAD (USDCAD) 📈 POSITIVE CORRELATION
• Current: ~1.4320
• Why: Canada is oil-exporting nation. Oil ⬇️ = CAD weakens
• Action: Watch USD strength - if USD rises, more pressure on oil
• Impact: ⭐⭐⭐⭐⭐ (5/5 Relevance)
2. S&P 500 (US500) 📊 INVERSE CORRELATION
• Current Level: ~6,800+
• Why: Rising energy costs = lower corporate margins = stock weakness
• Action: If stocks fall, risk-off → oil likely continues lower
• Impact: ⭐⭐⭐⭐ (4/5 Relevance)
3. US Dollar Index (USDZZ) 💵 STRONG NEGATIVE CORRELATION
• Why: Oil priced in USD. Strong dollar = cheaper oil for foreigners = lower demand
• Action: Monitor DXY strength - bullish USD = bearish oil
• Impact: ⭐⭐⭐⭐⭐ (5/5 Relevance)
4. Natural Gas (NATGAS/TradingView equivalent) ⚡ SECTOR CORRELATION
• Why: Both energy commodities, affected by demand
• Action: Watch as confirmation signal for energy sector weakness
• Impact: ⭐⭐⭐ (3/5 Relevance)
5. Russian Ruble (USDRUB) 🇷🇺 COMMODITY-LINKED CORRELATION
• Why: Russia major oil producer. Oil prices directly impact RUB
• Action: Weak ruble often signals oil pressure from supply concerns
• Impact: ⭐⭐⭐ (3/5 Relevance)
📋 TRADE CHECKLIST ✓
━━━━━━━━━━━━━━━━━━━━━━━━━━━━━━
✅ Check USD strength confirmation
✅ Verify oversold condition on daily chart
✅ Confirm supply zone rejection above $61
✅ Monitor correlated pairs for confirmation
✅ Set alerts on each layer ($60, $59, $58)
✅ Define your max loss amount (2-3% rule)
✅ Plan exit strategy BEFORE entering
⚡ KEY POINTS SUMMARY 🔑
━━━━━━━━━━━━━━━━━━━━━━━━━━━━━━
🎯 Entry: Layered approach ($60→$59→$58)
🛑 Stop Loss: $61.00 (adjust to YOUR strategy)
💎 Target: $53.00 strong support
📊 Risk/Reward: Define YOUR ratio before entry
🔔 Confirmation: Watch USD, stocks, CAD correlation

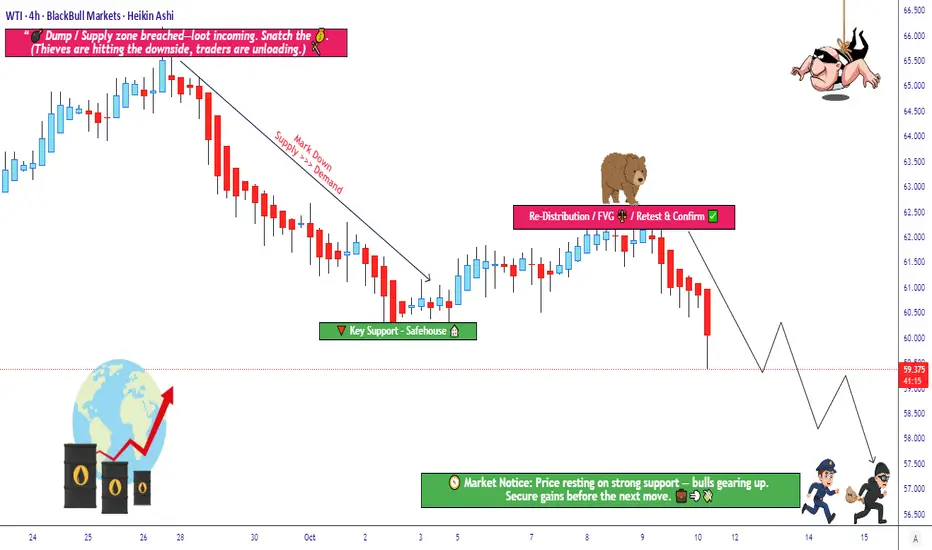
Is Crude Oil Setting Up for a Major Bearish Reversal?🛢️ XTI/USD “WTI” – Bearish Redistribution Zone Incoming (Thief Strategy Inside)
📉 Setup Overview
Market: XTI/USD (WTI crude oil)
Bias: Bearish confirmed — we’re looking for re-distribution / supply pressure to take control
Trade Type: Swing / Day Trade hybrid
🎯 Entry Plan (Thief-Layer Strategy)
I use a layering / multiple limit order approach (aka “Thief Strategy”). You may use any price level as entry, but here’s my preferred ladder:
Sell Limit @ 61.500
Sell Limit @ 61.000
Sell Limit @ 60.500
Sell Limit @ 60.000
Sell Limit @ 59.500
(You may extend more layers if you like)
You don’t need to hit all layers — just get partial fills, ride the move downward.
🚫 Stop Loss
Thief’s SL: 62.500
⚠️ Note to Thief OG’s: I’m not forcing you to follow my SL. You choose what works. Make money, take money — at your own risk.
🎯 Target
We see police barricade as a strong support zone + oversold trap possibility.
So primary target: 57.000
⚠️ Note to Thief OG’s: Don’t blindly hold to my TP. If price gives you your gains early, escape with your money — don’t wait for perfection.
🔍 Related Pairs & Correlations
AMEX:USO or USOIL (oil ETFs / indices) – real-world crude correlation
$BRENT/USD – watch for strength or weakness divergence
AMEX:XOP / AMEX:OIH (oil & gas sector indices) – sentiment in energy names
Key point: if Brent weakens while WTI breaks down, it reinforces the bias.
📌 Key Technical Notes
We’re waiting for ** redistribution / supply zone** to hold — a retest or failure bounce is ideal setup.
Oversold conditions + a “trap” candle (fake breakout) strengthen the move.
Use layering to average in, not “all-in” at once.
Be ready for whipsaws around support zones; partial exits can help.
✨ “If you find value in my analysis, a 👍 and 🚀 boost is much appreciated — it helps me share more setups with the community!”
Disclaimer: This is Thief-style trading strategy just for fun. I am not giving financial advice. Trade at your own decision and risk.
#WTI #CrudeOil #XTIUSD #EnergyTrading #OilStrategy #Layering #SwingTrade #DayTrade #BearishBias #ThiefStrategy
BRIEFING Week #50 : Post FOMC updateHere's your weekly update ! Brought to you each weekend with years of track-record history..
Don't forget to hit the like/follow button if you feel like this post deserves it ;)
That's the best way to support me and help pushing this content to other users.
Kindly,
Phil

USOIL BULLISH BIAS RIGHT NOW| LONG
USOIL SIGNAL
Trade Direction: long
Entry Level: 57.53
Target Level: 59.96
Stop Loss: 55.93
RISK PROFILE
Risk level: medium
Suggested risk: 1%
Timeframe: 1D
Disclosure: I am part of Trade Nation's Influencer program and receive a monthly fee for using their TradingView charts in my analysis.
✅LIKE AND COMMENT MY IDEAS✅

USOIL H1 | Bullish Bounce Off Pullback SupportMomentum: Bullish
The price is falling towards the buy entry which is slightly below the 61.8% Fibonacci retracement which adds a significant strength to this level.
Buy entry: 58.22
Pullback support
Slightly below the 61.8% Fibonacci retracement
Stop loss: 57.75
Pullback support
Aligns with the 78.6% Fibonacci retracement
Take profit: 59.48
Overlap resistance
High Risk Investment Warning
Stratos Markets Limited (tradu.com ), Stratos Europe Ltd (tradu.com ):
CFDs are complex instruments and come with a high risk of losing money rapidly due to leverage. 70% of retail investor accounts lose money when trading CFDs with this provider. You should consider whether you understand how CFDs work and whether you can afford to take the high risk of losing your money.
Stratos Global LLC (tradu.com ): Losses can exceed deposits.
Please be advised that the information presented on TradingView is provided to Tradu (‘Company’, ‘we’) by a third-party provider (‘TFA Global Pte Ltd’). Please be reminded that you are solely responsible for the trading decisions on your account. Any information and/or content is intended entirely for research, educational and informational purposes only and does not constitute investment or consultation advice or investment strategy. The information is not tailored to the investment needs of any specific person and therefore does not involve a consideration of any of the investment objectives, financial situation or needs of any viewer that may receive it. Past performance is not a reliable indicator of future results. Actual results may differ materially from those anticipated in forward-looking or past performance statements. We assume no liability as to the accuracy or completeness of any of the information and/or content provided herein and the Company cannot be held responsible for any omission, mistake nor for any loss or damage including without limitation to any loss of profit which may arise from reliance on any information supplied by TFA Global Pte Ltd.

USOIL Price Analysis & Bearish Trade Execution🛢️ Asset: WTI “USOIL” – Energies Market Trade Opportunity Guide (Day/Swing Trade)
📉 Plan: Bearish Plan Confirmed
Momentum is weakening, liquidity pockets are exposed at the lower ranges, and the structure favors downside continuation. Price remains vulnerable to deeper drawdowns as volatility compresses.
🎯 Entry:
ANY PRICE LEVEL ENTRY
(Execute based on your personal confirmation rules, premium/discount zones, or volatility triggers.)
🛡️ Stop Loss (Risk Guide):
This is the Thief SL @ 58.500 🛑
Dear Ladies & Gentlemen (Thief OG’s), kindly adjust your SL based on your own strategy, volatility preference, and personal risk model.
Note: I am not recommending that you use only my SL. You can make money and take money at your own risk.
💰 Target:
Strong support + oversold conditions + liquidity trap identified below, so kindly aim to escape with profits.
🎯 Our Target: 55.500
Note: Dear Ladies & Gentlemen (Thief OG’s), I am not recommending using only my TP. It is your own choice—you can make money and take money at your own risk.
🌍 Related Pairs to Watch (Correlation Insights)
1️⃣ Brent Crude – “UKOIL”
Often moves in the same direction as WTI due to shared global demand/supply themes.
If UKOIL breaks structure first, USOIL usually follows shortly after.
2️⃣ Natural Gas – “NATGAS”
Not directly correlated but reacts to energy-sector sentiment.
A sharp move in NATGAS can shift commodity-flow risk appetite.
3️⃣ Canadian Dollar – “USD/CAD”
CAD strengthens when oil prices rise and weakens when oil drops.
For a bearish USOIL plan, watch for USD/CAD upward pressure.
4️⃣ S&P 500 Energy Sector – “XLE”
Tracks major oil companies.
Weakness in XLE often signals upcoming pressure on crude.
5️⃣ OPEC Headlines + API/EIA Reports
Sudden supply changes or inventory spikes can trigger fast volatility.
Keep monitoring these events closely during active trades.
✅ LIKE if you find this useful!
✅ FOLLOW for daily trade plans & market insights.
✅ COMMENT your entry or adjustments below!
#TradingView #USOIL #CrudeOil #SwingTrading #DayTrading #TradingIdeas #Forex #Commodities #Bearish #RiskManagement
Let’s grow together – trade smart, stay disciplined, and engage! 💼🔥

USOIL Is Very Bullish! Buy!
Here is our detailed technical review for USOIL.
Time Frame: 1h
Current Trend: Bullish
Sentiment: Oversold (based on 7-period RSI)
Forecast: Bullish
The market is approaching a significant support area 57.360.
The underlined horizontal cluster clearly indicates a highly probable bullish movement with target 58.090 level.
P.S
Overbought describes a period of time where there has been a significant and consistent upward move in price over a period of time without much pullback.
Like and subscribe and comment my ideas if you enjoy them!

CRUDE OIL Bearish Bias! Sell!
Hello,Traders!
CRUDE OIL taps into a fresh SMC supply pocket after a clean liquidity grab and shifts order flow bearish. The current pullback simply mitigates the breaker before another leg down unfolds toward discounted pricing. Time Frame 4H.
Sell!
Comment and subscribe to help us grow!
Check out other forecasts below too!
Disclosure: I am part of Trade Nation's Influencer program and receive a monthly fee for using their TradingView charts in my analysis.

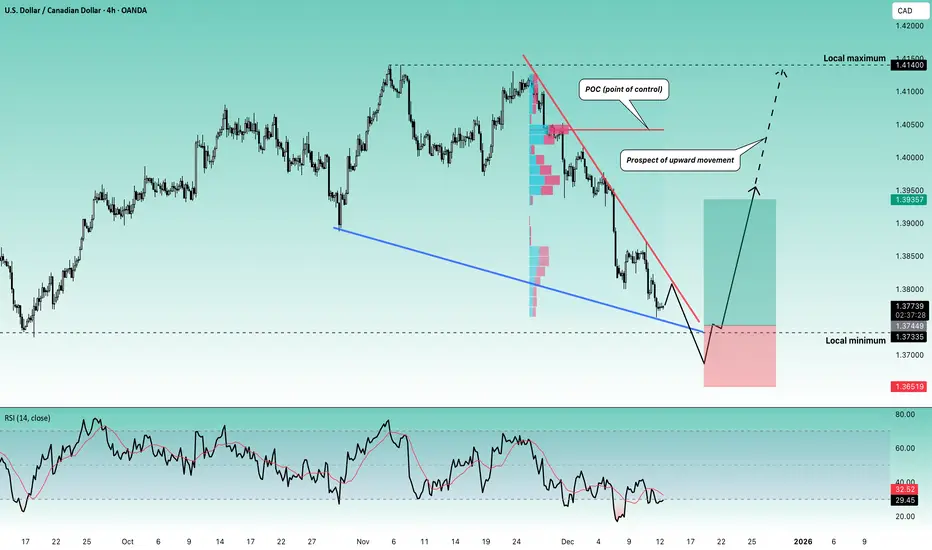
Stop!Loss|Market View: USDCAD🙌 Stop!Loss team welcomes you❗️
In this post, we're going to talk about the near-term outlook for the USDCAD currency pair☝️
Potential trade setup:
🔔Entry level: 1.37449
💰TP: 1.39357
⛔️SL: 1.36519
"Market View" - a brief analysis of trading instruments, covering the most important aspects of the FOREX market.
👇 In the comments 👇 you can type the trading instrument you'd like to analyze, and we'll talk about it in our next posts.
💬 Description: Further weakening of the US dollar is likely to be expected in the near future. Against this backdrop, USDCAD is approaching support at 1.37335 (short-term selling could be looked for). At the same time, a promising upward reversal is expected from this area, with a preliminary target of 1.39000. A longer-term move could continue toward 1.40000 and 1.41000.
Thanks for your support 🚀
Profits for all ✅
USOil Long RollerMain idea is based on RSI on 75m TF peaking (technically) {Green Arrow} and trend levels are marked (observationally) for trade executables.
$57.25 is average entry, to be rolled on expiry.
Thank you.
Any comments are welcome :)

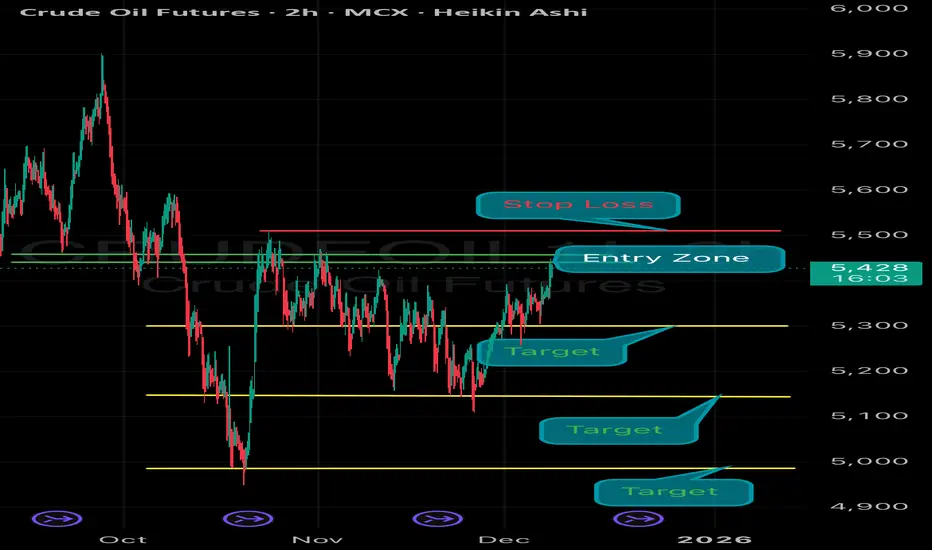
Crude Oil MCX (4H) – Detailed Technical Analysis Trend
Short-term trend is bearish, with consistent lower highs under the falling supply trendline.
Key Zones
🔴 Strong Supply Areas
Ultra Strong Supply: 5400–5550
Immediate Selling Zone: 5280–5340 → Strong resistance. Price must close above this for a clear bullish reversal.
🟢 Demand Areas
Minor Demand: 5080–5150 → Expected short-term bounce zone.
Strong Demand: 4950–5050 → High-probability reversal zone if price drops deeper.
3️⃣ Price Scenarios
🟢 Bullish Scenario
If price holds 5080–5150 and breaks 5280–5340,
Upside Targets: 5350 → 5450
🔴 Bearish Scenario
If price rejects from 5280–5340 OR breaks below 5150,
Downside Targets: 5050 → 4950
4️⃣ Final Outlook
Market currently weak but near demand.
Sustain above 5340 = bullish reversal.
Sustain below 5150 = continuation downside.
⚠️ Disclaimer
This analysis is purely for educational purposes.
Not investment or trading advice.
Always use stop-loss and proper risk management.

Hellena | Oil (4H): LONG to the area of the maximum of wave “1”.Colleagues, I believe it is necessary to update the forecast slightly. Overall, it remains unchanged, with an upward movement expected.
At the moment, I believe that the higher-order wave “B” has formed, and now in wave ‘C’ I see a five-wave movement “12345”.
I expect wave “3” to begin its movement soon, and I consider the first target to be the maximum area of wave “1” at 60.576.
Manage your capital correctly and competently! Only enter trades based on reliable patterns!

Crude Oil Showing Lower Rejection For NowCrude Oil Futures (January 2026 Contract) Analysis—4h Chart
Crude oil futures (NYMEX: CLF2026) are trading at $58.92 as of the latest 4-hour bar, showing a positive move of +$0.57 (+0.98%) for the day. Today’s session marks a modest recovery for oil, with prices ranging between a low of $58.31 and a high of $59.05.
Key observations:
After hitting our sell take profit zone this morning, the level was rejected. After dipping to the session low, prices rebounded to close just under the high, suggesting renewed buying interest.
Trend outlook:
With gains near 1%, short-term technicals suggest further upside if momentum continues. Watch closely for a break above $59.05 for confirmation.
Volatility: Intra-session swings remain moderate, but a move above or below today’s range could set the tone for the next direction.
Quick Take:
Crude oil remains sensitive to global supply cues and economic sentiment. Traders should monitor key resistance near $59.05 and support at $58.31 for breakout signals. Cautious optimism is warranted as oil seeks direction near these pivotal levels.
This is not trade advice.
#CrudeOil #Futures #TradingView #OilMarkets #TechnicalAnalysis

Crude Oil Fails to Pull Away From This Year’s LowsBroad-based weakness in WTI crude has persisted in the short term, and the price has lost more than 3.5% over the past three trading sessions, bringing it increasingly closer to the 2025 lows around 57 dollars per barrel. For now, selling pressure remains firmly in place, partly because OPEC+, the world’s most influential oil-producing group, continues moving toward higher production levels heading into 2026. Additionally, the possibility of a peace agreement between Russia and Ukraine raises the chance that certain economic sanctions on Russia could be lifted, further increasing the outlook for global supply. As long as expectations of a potential oversupply in 2026 persist, this scenario may continue to exert downward pressure on WTI and act as a key catalyst for sustained selling pressure in the sessions ahead.
Downtrend Remains Firm
For several months, crude oil has been following a consistent downward path, and the current trendline remains strong despite occasional upward corrections that have been insufficient to break it. As a result, this bearish formation remains the most important technical factor to watch. If selling pressure continues to push prices into new lows or keeps them below 60 dollars per barrel, the bearish bias will likely continue to dominate short-term price action.
RSI
At the moment, the RSI line is fluctuating near the neutral 50 level, suggesting a balance between buying and selling impulses in the short term. If this behavior holds, it may give way to a period of price indecision.
MACD
A similar scenario is observed in the MACD, whose histogram remains near the zero line, indicating an equilibrium in short-term moving-average strength. If this pattern continues, it may lead to a period of sustained indecision in WTI over the coming sessions.
Key Levels to Watch:
61 dollars: The most relevant resistance level, aligned with the 23.6% Fibonacci retracement. A bullish breakout above this area could threaten the broader downtrend and open the door to a stronger bullish bias in WTI.
58 dollars: An intermediate barrier aligned with the downtrend line and the 50-period moving average. Price action that remains near this zone may trigger a short-term sideways range, increasing uncertainty in WTI.
57 dollars: This level corresponds to the 2025 lows and currently acts as the most important support. A break below it could confirm a dominant bearish bias and extend the downtrend into the coming sessions.
Written by Julian Pineda, CFA, CMT – Market Analyst

USOIL BEARS WILL DOMINATE THE MARKET|SHORT
USOIL SIGNAL
Trade Direction: short
Entry Level: 58.39
Target Level: 57.94
Stop Loss: 58.69
RISK PROFILE
Risk level: medium
Suggested risk: 1%
Timeframe: 1h
Disclosure: I am part of Trade Nation's Influencer program and receive a monthly fee for using their TradingView charts in my analysis.
✅LIKE AND COMMENT MY IDEAS✅

Will Crude Oil Rise or Fall?Crude Oil Futures (Jan 2026) - Market Analysis
Crude oil is trading at $58.39 per barrel, down 0.19%. Recent data show prices ranging from $58.12 to $58.62, indicating a period of consolidation. Key support is forming around $58.12, while resistance is at $58.62.
The overall momentum suggests limited near-term volatility, with the price hovering near its recent lows. Traders should watch for a breakout above resistance or a drop below support for the next directional move.
Stay tuned for further updates as market conditions evolve, and always manage risk
appropriately when trading futures.
#crudeoil #oilprices #trading #commodities #marketanalysis

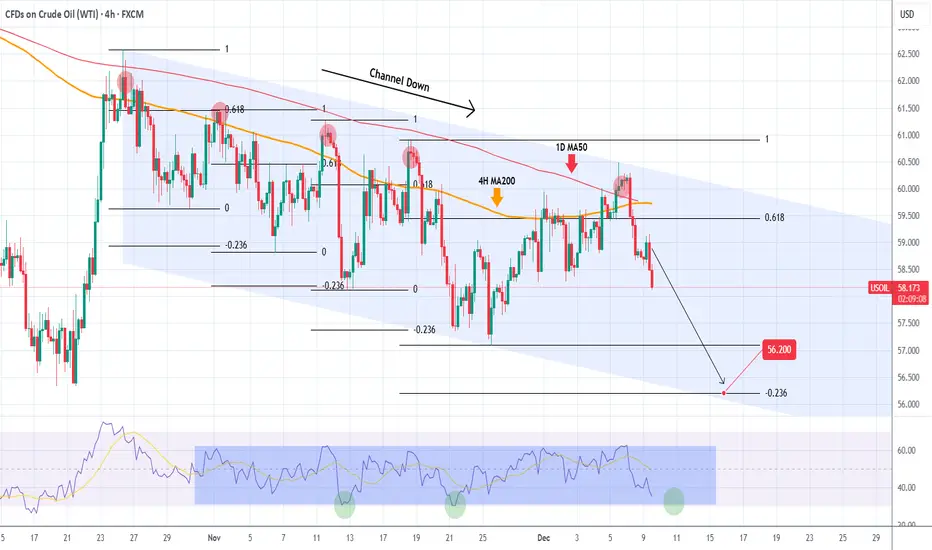
WTI OIL 1.5 month Channel Down started new Bearish Leg.WTI Oil (USOIL) has been trading within a 1.5-month Channel Down (since the October 4 High), that priced last Friday its latest Lower High, this time above the 1D MA50 (red trend-line).
That initiated the new Bearish Leg (also confirmed by the 4H RSI rejection at the top of its range). All 4 previous Bearish Legs bottomed just when the hit the -0.236 Fibonacci extension.
Based on that, we are expecting WTI to make a new Lower Low at 56.200.
---
** Please LIKE 👍, FOLLOW ✅, SHARE 🙌 and COMMENT ✍ if you enjoy this idea! Also share your ideas and charts in the comments section below! This is best way to keep it relevant, support us, keep the content here free and allow the idea to reach as many people as possible. **
---
💸💸💸💸💸💸
👇 👇 👇 👇 👇 👇
MCX Crude Oil Dec -Bearish Setup The chart has identified a Bearish Opportunity with a well-defined trade structure:
✅ Entry Zone: 5430 – 5440
🔒 Stop Loss: 5510 (Strict SL — no relaxation)
🎯 Target Zone: 5330 - 5200– 5100
⚠️ Risk Management Rule:
Once the trade achieves 1:1 Reward:Risk, immediately shift Stop Loss to Cost-to-Cost to secure the position and reduce downside exposure.
Stay disciplined. Follow levels precisely. 📊🔥