US OIL MAY CRUSH IN THE NEXT WEEKS ( TIME WILL TELL ) Please share with me your thoughts about it
Regards
Usoilsignal

USOIL Long PlayUSOIL looking perfect for a long
Huge rejection of the 78.6 as well as a higher low on the 1H timeframe.
The prior wick indidcates some strong buying pressure from the region below and a long makes a lot of sense.
Stops just below the prior hourly wick, take profit at $44.
Hope this helps.

Crude Oil Buy SetupDISCLAIMER:
My analysis is just a trading idea! As a trader you should consider your own risk:reward ratio and do proper lot sizing according to your margin and leverage level.
Good Luck!


USOIL SHORT IDEALooking at a nice litte short this afternoon, waiting for confirmation before pulling the trigger

USOIL - SELLExpecting OIL to take a drop this week to its previous level of support, once this current level has been broken
USOIL CRUDE OIL FUTURES LONG SET UP TO $44US OIL LONG DROP
P 39.54
S3 35.4 S2 37.47 S1 38.49 R1 40.56 R2 41.61 R3 43.68
CRUDE OIL FUTURES
TITLE : BUY USOIL
ASSETS : COMMODITIE
SYMBOL : USOIL
ORDER TYPE : (EP1) market
(EP2) LIMIT ORDER
TF : 1W
ENTRY PRICE 1: $37.98
ENTRY PRICE 2: $37.08
STOP LOSS : $36.20
TAKE PROFIT 1- $38.98
TAKE PROFIT 2- $40.08
TAKE PROFIT 3 -$41.98
TAKE PROFIT 4 -$43.08
STATUS: ACTIVE

USOIL Buy OIL from around 34Hi traders,
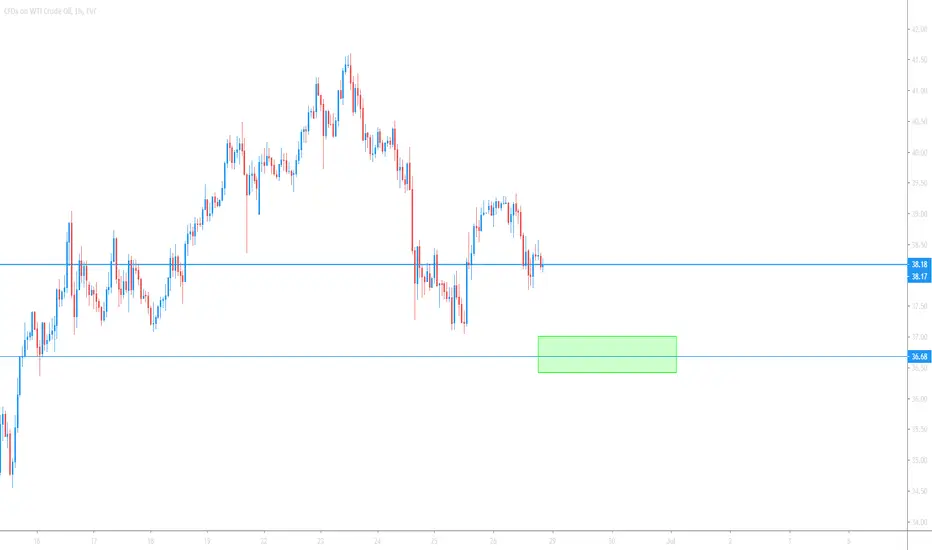
If you want you can start watching for SHORT TERM Sell setups back to the previous bottom around 34.
For buyers, let the price come down to 34 then we will start watching for buy setups.
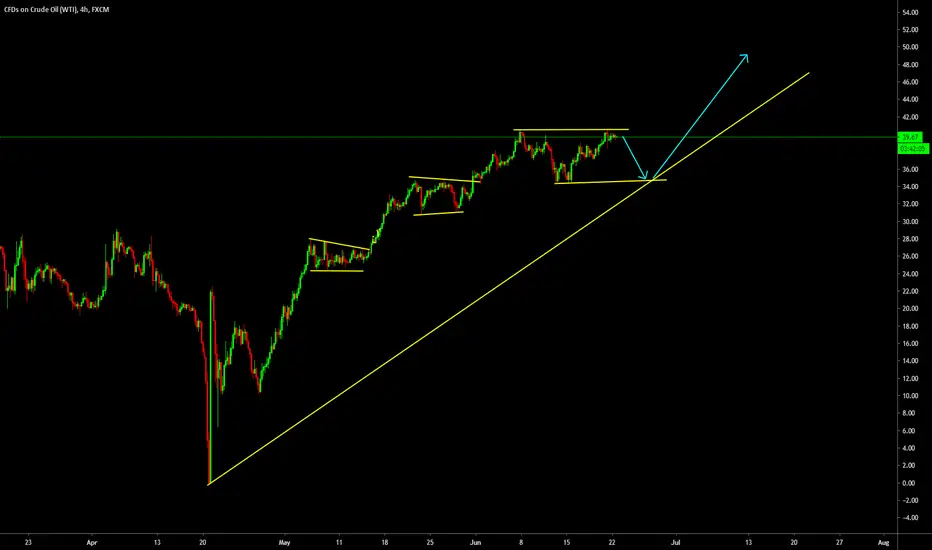
USOIL (XTIUSD) CRUDE OIL GOING TO 50$+USOIL START MOVING TO 50$+ all is matter of time as
worldwide lock down is opening
Keep buying we had changed our trend
after long time period on oil ..
NOW WE ARE BUYING
WE APPRECIATE YOUR LIKES AN COMMENTS
DO YOUR OWN ANALYSIS BEFORE ENTERING TO A TRADE

US OIL TRADE PLAN !! WTI Crude Oil is ready to Drop !!US oil has a big potential to go down in the short period . Atleast thats what the chart is telling me. I predict Russia will not agree to extending the oil output cut, and that will start the crude oil falling . Just kidding Guys when I saw the market I knew that Crude oil will go down .
In my analysis you should take 40 to 50 pips or wait more to make more .

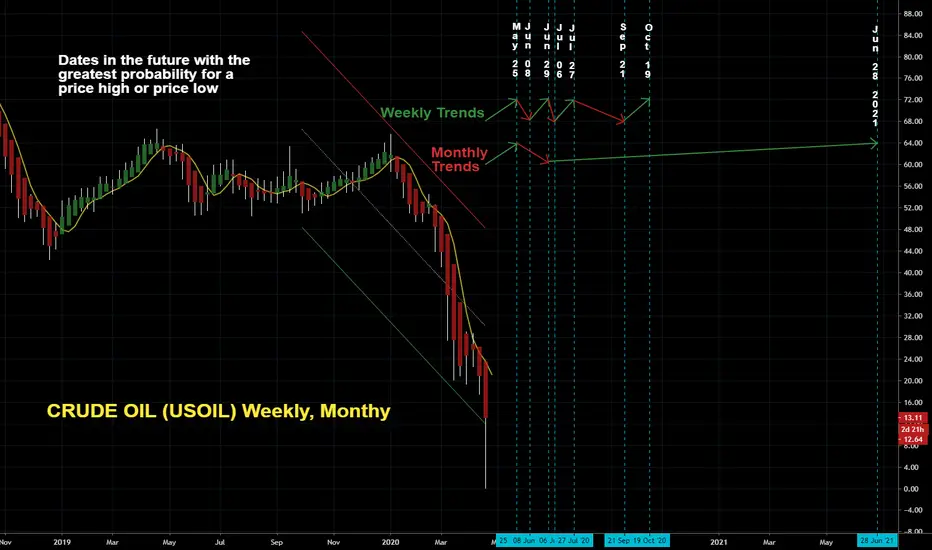
CRUDE OIL (USOIL) Weekly, MonthyDates in the future with the greatest probability for a price high or price low.
The Djinn Predictive Indicators are simple mathematical equations. Once an equation is given to Siri the algorithm provides the future price swing date. Djinn Indicators work on all charts, for any asset category and in all time frames. Occasionally a Djinn Predictive Indicator will miss its prediction date by one candlestick. If multiple Djinn prediction dates are missed and are plowed through by same color Henikin Ashi candles the asset is being "reset". The "reset" is complete when Henikin Ashi candles are back in sync with Djinn price high or low prediction dates.
One way the Djinn Indicator is used to enter and exit trades:
For best results trade in the direction of the trend.
The Linear Regression channel is used to determine trend direction. The Linear Regression is set at 2 -2 30.
When a green Henikin Ashi candle intersects with the linear regression upper deviation line (green line) and both indicators intersect with a Djinn prediction date a sell is triggered.
When a red Henikin Ashi candle intersects with the linear regression lower deviation line (red line) and both indicators intersect with a Djinn prediction date a buy is triggered.
This trading strategy works on daily, weekly and Monthly Djinn Predictive charts.
Trades made when the weekly and monthly arrows are pointing in the same direction are the most profitable.
This is not trading advice. Trade at your own risk.
USOIL, Best Place to open Long EntryCrash of USOIL Market is only temporary and this price cannot be rejected by any trader. The highlighted place of 10 dollars per barrel is the best historical price you can get to open a buy position for long-term. The Scalp can be targeted for 100% profit to place around 20.00 and swing trade to 300% if not even more. This trade is only AWESOME!

CFDS ON CRUDE OIL (WTI) USOIL LONG SET UPTITLE : BUY USOIL
ASSETS : COMMODITIE
SYMBOL : USOIL
ORDER TYPE : (EP1) LIMIT ORDER
(EP2) LIMIT ORDER
TF : 8hr
ENTRY PRICE 1: $20.28
ENTRY PRICE 2: $19.68
STOP LOSS : $16.71
TAKE PROFIT 1- $23.86
TAKE PROFIT 2- $26.68
TAKE PROFIT 3 -$30.86
STATUS: ACTIVE


CRUDE OIL (WTI):HITS KEY HISTORICAL LEVELS (GO LONG)TITLE : BUY USOIL
ASSETS : COMMODITIE
SYMBOL : USOIL
ORDER TYPE : (EP1) MARKET ORDER
(EP2) LIMIT ORDER
TF : 6 MONTH
ENTRY PRICE 1: $20.86
ENTRY PRICE 2: $18.68
STOP LOSS : $16.71
TAKE PROFIT 1- $23.86
TAKE PROFIT 2- $28.68
TAKE PROFIT 3- $30.86
TAKE PROFIT 4- $34.68
TAKE PROFIT 5- $40.86
STATUS : ENTRY 1 active

USOIL Sell Update (+263 pips)See attached trade entry from yesterday below,
18:02:18 (UTC)
Tue Apr 7, 2020

Cl! Light Crude Futures Short Update (+200 pips) 18:00:12 (UTC) See attached trades from yesterday linked below
18:00:12 (UTC)
Tue Apr 7, 2020

USOIL Daily Risk Range - 13:19:54 (UTC) Tue Apr 7, 2020Previous Close: 28.34
Higher Bound: 30.40
Lower Bound: 17.81
13:19:36 ( UTC )
Tue Apr 7, 2020
