Could Oil (WTI) Be Breaking Out of its Range?Oil (WTI) has moved back to the forefront of traders thinking this week after OPEC+’s weekend decision to raise September production by circa 550k barrels per day. They also put traders on notice that all options remain open regarding further production increases to replace another output layer, amounting to 1.66 million barrels per day that has been offline since 2023. A decision on what comes next is due to take place at a meeting scheduled for September 7th.
Perhaps unsurprisingly, this potential for extra production (supply) being unleashed into the market later in the year has led to some downside pressure for Oil this week. This is because it comes at a time of uncertainty surrounding Oil demand due to possible weaknesses in the global economy, created by President Trump’s tariff policies. Oil (WTI) prices have fallen 4.8% from opening levels on Monday to post a new 1 month low at 64.20 yesterday, a level that it currently holding (more on this in technical update below).
Looking forward, one of the challenges traders are facing for where Oil moves next is President Trump’s August 8th deadline for Russia to end the war with Ukraine or face fresh sanctions on its energy exports. President Trump has also suggested he would increase tariffs on countries buying Oil from Russia, including China, although right now India is his initial focal point in this regard and yesterday, he doubled tariffs on Indian goods (25% to 50%) due to the country’s purchases of Russian Oil. These new tariffs are due to start in 3 weeks’ time.
With so much uncertainty surrounding Oil prices, including reports of a possible meeting between President Trump and President Putin being scheduled at some stage next week, it could be useful to be prepared for a potential increase in Oil (WTI) price volatility.
Technical Update: New Correction Lows Posted
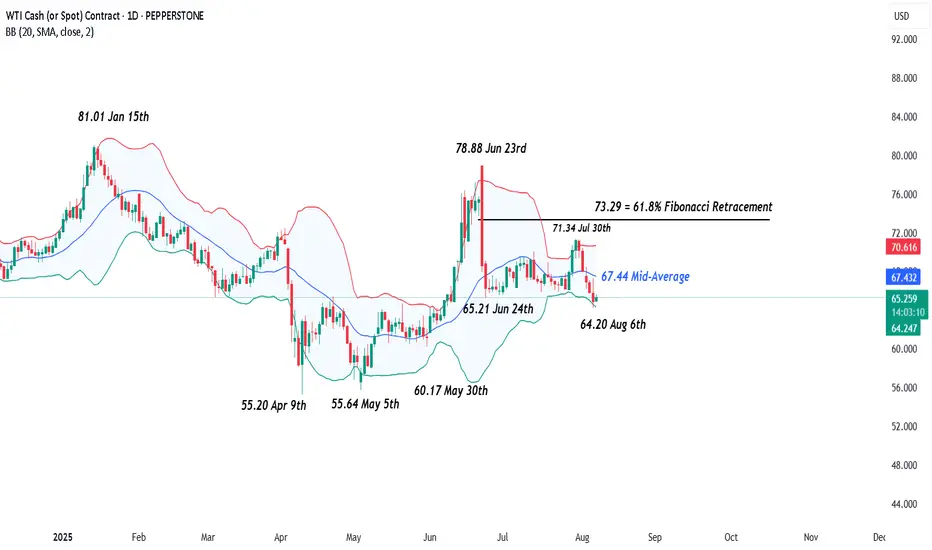
Having seen the sharp sell-off in Oil between June 23rd and 24th 2025, a period of more balanced activity developed, as a reaction to over-extended downside conditions in price.
As the chart above shows, this resulted in a phase of sideways price activity between support marked by the 65.21 June 24th low, up to 71.34, which is equal to the July 30th failure high. However, price declines on Wednesday this week, have produced closes below 65.21, in the process of posting a new correction low at 64.20.
While communications between the US and Russia regarding the war in Ukraine are on-going, this type of break lower in the Oil price is no guarantee of future declines, so it could be helpful to assess what could be the potential support and resistance levels to focus on, just in case the outcome of these events lead to an increase in Oil price volatility.
Possible Next Support Levels:
As we have said above, the August 6th price weakness has seen a new correction low posted at 64.20, and this may now be viewed as the first support focus. Closes below 64.20 might then lead to a more extended decline in price.
Such moves would indicate the potential of further price weakness, with the next support possibly marked by the May 30th session low at 60.17, perhaps further towards 55.64 (May 5th low), if this level in turn gives way.
Potential Resistance Levels:
On the topside, within a period of price weakness, it can be the declining Bollinger mid-average that reflects the first possible resistance, and for Oil this currently stands at 67.44. Closing breaks above 67.44, if seen, could prompt further attempts to develop price strength to test higher resistance levels.
The first possible level would appear to be marked by 71.34, which is the July 30th session high. If this level was broken on a closing basis, it might then lead to tests of 73.29, which is equal to the 61.8% Fibonacci retracement of the June 23rd to June 24th sell-off.
The material provided here has not been prepared accordance with legal requirements designed to promote the independence of investment research and as such is considered to be a marketing communication. Whilst it is not subject to any prohibition on dealing ahead of the dissemination of investment research, we will not seek to take any advantage before providing it to our clients.
Pepperstone doesn’t represent that the material provided here is accurate, current or complete, and therefore shouldn’t be relied upon as such. The information, whether from a third party or not, isn’t to be considered as a recommendation; or an offer to buy or sell; or the solicitation of an offer to buy or sell any security, financial product or instrument; or to participate in any particular trading strategy. It does not take into account readers’ financial situation or investment objectives. We advise any readers of this content to seek their own advice. Without the approval of Pepperstone, reproduction or redistribution of this information isn’t permitted.
Volatility
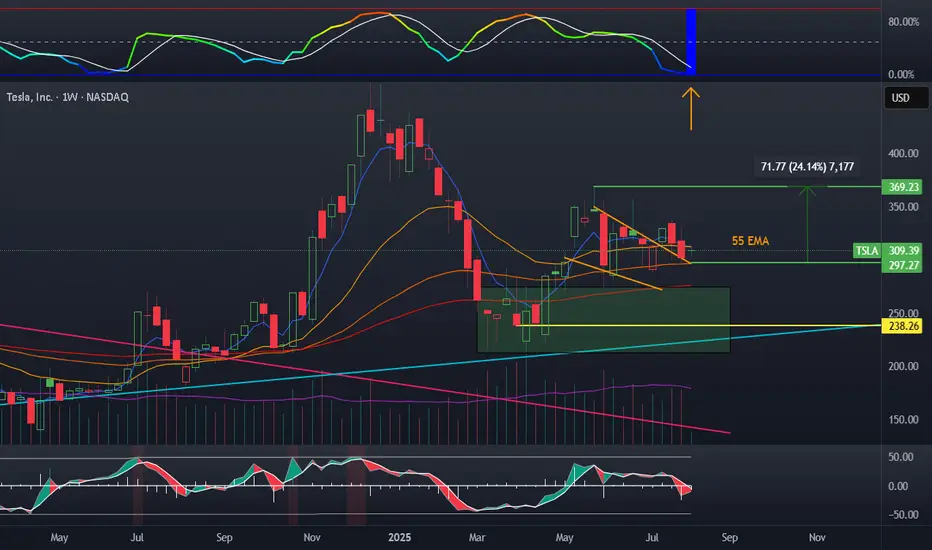
Tesla wedge and volatilityTesla has been riding this wedge downward after a false breakout on terrible earnings. BBWP has flashed blue, which has not happened since 2017, which is a signal for me. Stochastic has reset, and a stall candle is forming. Volume is generally up.
My plan:
TSLL shares, possible cash secured puts
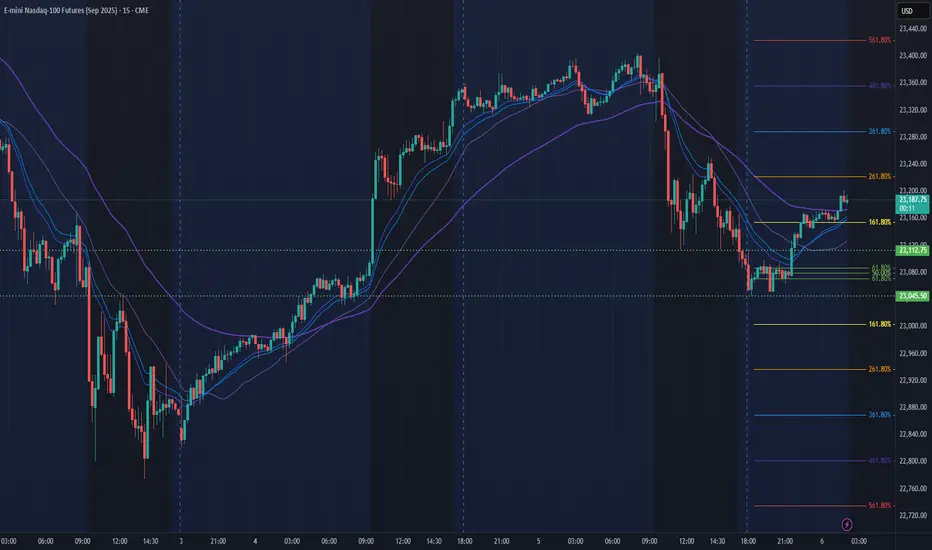
NQ Power Range Report with FIB Ext - 8/6/2025 SessionCME_MINI:NQU2025
- PR High: 23112.75
- PR Low: 23045.50
- NZ Spread: 150.25
Key scheduled economic events:
10:30 | Crude Oil Inventories
13:00 | 10-Year Note Auction
Look above & fail Friday-Monday highs
Session Open Stats (As of 12:35 AM 8/6)
- Session Open ATR: 299.58
- Volume: 32K
- Open Int: 277K
- Trend Grade: Long
- From BA ATH: -2.8% (Rounded)
Key Levels (Rounded - Think of these as ranges)
- Long: 23811
- Mid: 22096
- Short: 20383
Keep in mind this is not speculation or a prediction. Only a report of the Power Range with Fib extensions for target hunting. Do your DD! You determine your risk tolerance. You are fully capable of making your own decisions.
BA: Back Adjusted
BuZ/BeZ: Bull Zone / Bear Zone
NZ: Neutral Zone
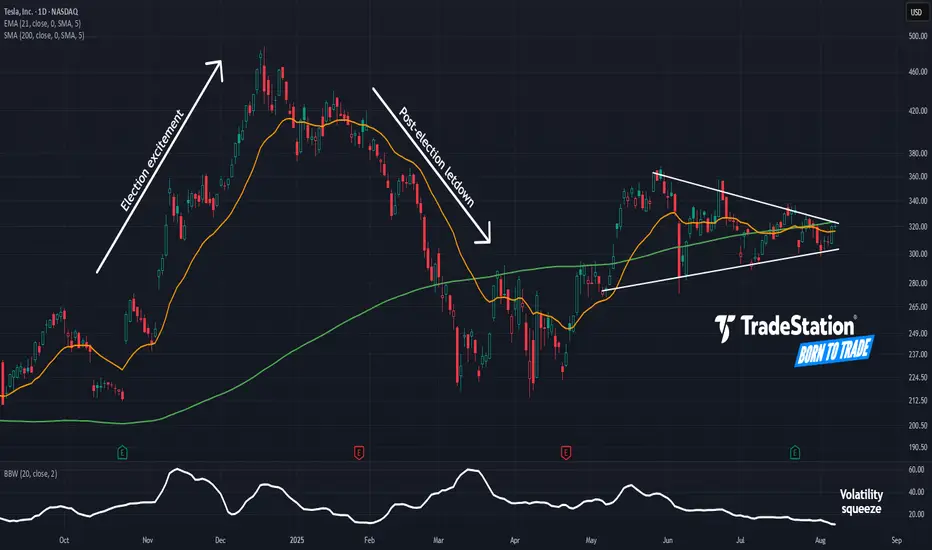
Tight Squeeze in TeslaTesla rallied sharply in late 2024, followed by a drop in the first quarter. Now, after a long period of consolidation, some traders may think the EV maker is getting ready to move again.
The first pattern on today’s chart is the series of higher lows and lower highs since May. That converging triangle may give TSLA breakout potential.
Second, Bollinger Bandwidth has squeezed to a 13-month low. Will that price compression give way to expansion?
Third, the rising 200-day simple moving average may suggest a longer-term uptrend remains in effect.
Next, prices are trying to push above the 21-day exponential moving average. That may be consistent with increasing bullishness in the short term.
Finally, TSLA is a highly active underlier in the options market. (Its average daily volume of 2.3 million contracts ranks behind only Nvidia in the S&P 500, according to TradeStation data.) That may help traders take positions with calls and puts.
TradeStation has, for decades, advanced the trading industry, providing access to stocks, options and futures. If you're born to trade, we could be for you. See our Overview for more.
Past performance, whether actual or indicated by historical tests of strategies, is no guarantee of future performance or success. There is a possibility that you may sustain a loss equal to or greater than your entire investment regardless of which asset class you trade (equities, options or futures); therefore, you should not invest or risk money that you cannot afford to lose. Online trading is not suitable for all investors. View the document titled Characteristics and Risks of Standardized Options at www.TradeStation.com . Before trading any asset class, customers must read the relevant risk disclosure statements on www.TradeStation.com . System access and trade placement and execution may be delayed or fail due to market volatility and volume, quote delays, system and software errors, Internet traffic, outages and other factors.
Securities and futures trading is offered to self-directed customers by TradeStation Securities, Inc., a broker-dealer registered with the Securities and Exchange Commission and a futures commission merchant licensed with the Commodity Futures Trading Commission). TradeStation Securities is a member of the Financial Industry Regulatory Authority, the National Futures Association, and a number of exchanges.
Options trading is not suitable for all investors. Your TradeStation Securities’ account application to trade options will be considered and approved or disapproved based on all relevant factors, including your trading experience. See www.TradeStation.com . Visit www.TradeStation.com for full details on the costs and fees associated with options.
Margin trading involves risks, and it is important that you fully understand those risks before trading on margin. The Margin Disclosure Statement outlines many of those risks, including that you can lose more funds than you deposit in your margin account; your brokerage firm can force the sale of securities in your account; your brokerage firm can sell your securities without contacting you; and you are not entitled to an extension of time on a margin call. Review the Margin Disclosure Statement at www.TradeStation.com .
TradeStation Securities, Inc. and TradeStation Technologies, Inc. are each wholly owned subsidiaries of TradeStation Group, Inc., both operating, and providing products and services, under the TradeStation brand and trademark. When applying for, or purchasing, accounts, subscriptions, products and services, it is important that you know which company you will be dealing with. Visit www.TradeStation.com for further important information explaining what this means.
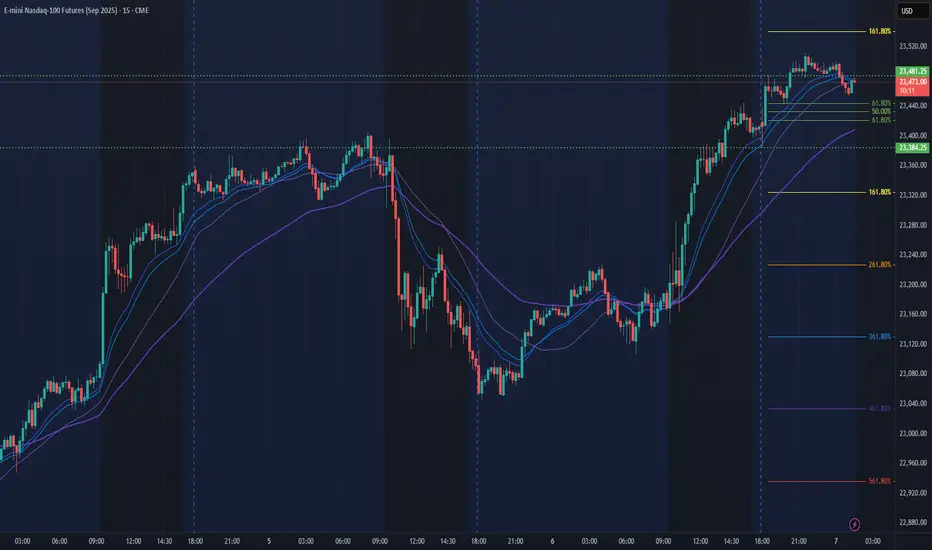
NQ Power Range Report with FIB Ext - 8/7/2025 SessionCME_MINI:NQU2025
- PR High: 23481.00
- PR Low: 23384.50
- NZ Spread: 216.25
Key scheduled economic events:
08:30 | Initial Jobless Claims
13:00 | 30-Year Bond Auction
Session Open Stats (As of 12:35 AM 8/7)
- Session Open ATR: 305.25
- Volume: 34K
- Open Int: 285K
- Trend Grade: Long
- From BA ATH: -1.5% (Rounded)
Key Levels (Rounded - Think of these as ranges)
- Long: 23811
- Mid: 22096
- Short: 20383
Keep in mind this is not speculation or a prediction. Only a report of the Power Range with Fib extensions for target hunting. Do your DD! You determine your risk tolerance. You are fully capable of making your own decisions.
BA: Back Adjusted
BuZ/BeZ: Bull Zone / Bear Zone
NZ: Neutral Zone
GBPUSD Volatility in Focus Ahead of Thursday's BoE Rate DecisionIt’s a new week and GBPUSD is attempting to rebound from a 2-month low that it hit at 1.3140 on Friday. So far, the recovery has been relatively minor, with a high of 1.3308 registered yesterday. Whether the up move can extend from this point or new downside price action is seen may now depend on several factors specifically impacting the UK (GBP) and US (USD) sides of the currency pair.
The bounce in GBPUSD from the lows on Friday began because of the shock weaker than expected US Non-farm Payrolls print, which has called into question the strength of the US economy, leading to a dramatic market repricing of Federal Reserve interest rate expectations and a small reversal of the dollar strength seen through July.
Today sees the release of the US ISM Services PMI at 1500 BST, and FX traders may be looking at this reading to either confirm or disprove the theory that the US economy may now be in a weaker state than thought only several days ago. A reading below 50 = economic contraction and above 50 = economic expansion. Service activity has been the main driver of growth in the US economy and June’s reading was 50.8, so any print below this number could lead to renewed dollar selling and push GBPUSD higher again.
Then on Thursday, the Bank of England (BoE) interest rate decision is released at 1200 BST, quickly followed by the press conference led by Governor Bailey at 1230 BST. The UK central bank is expected to cut rates by 25bps (0.25%), so anything else could be a surprise. The breakdown of the vote between the 9-member decision making committee could also be important given there seems to be a split between those policymakers worried about the strength of UK inflation and those worried about a stuttering UK economy. This is where the comments of Governor Bailey on inflation, growth and future rate cuts could be pivotal for the direction of GBPUSD into the weekend.
Technical Update: Assessing the Trend
Within the technical analysis technique of Fibonacci retracements, after a phase of price strength, the significant price low and significant price high of the move are used to calculate 3 set percentages of the price advance, they are 38.2%, 50% and 61.8%. If price weakness develops after the period of strength, these retracement levels are viewed as potential support to price declines.
In the GBPUSD chart above, we have used 1.2100, posted on January 13th 2025, as the significant price low and 1.3789 registered on July 1st as the significant price high, and have calculated the 3 retracements on this price advance. As you can see, the 38.2% Fibonacci retracement stands at 1.3142 and last Friday’s session low was 1.3140, from which a recovery in price is currently materialising.
Of course, there is no guarantee that 1.3142, the 38.2% Fibonacci retracement support level in GBPUSD will be able to hold or even reverse the current price weakness back to the upside, but it can be helpful to assess what may be the potential support and resistance levels to monitor, particularly if events this week influence price action and lead to an increase in volatility.
Possible Support Levels:
Having seen last week’s price decline held by the 38.2% retracement level at 1.3142, traders could suggest this is now the first support focus, so closing breaks below 1.3142, may lead to a more extended phase of price weakness.
Within Fibonacci techniques, a closing break under a 38.2% retracement support suggests possibilities for a deeper decline in price to the 50% level, and if this in turn is broken towards the deeper 61.8% retracement.
As the chart above shows, in the case of GBPUSD, if closes below 1.3142 support are seen, this might be an indication of the potential for further price weakness to 1.2944 (50% level), even 1.2745 (62% retracement).
Possible Resistance Levels:
Having seen the 1.3142 Fibonacci retracement support limit price declines last week, it is possible traders will now be trying to pinpoint possible resistance levels that if broken on a closing basis, might result in a more extended price recovery.
Within a period of price declines, it is often the declining Bollinger mid-average that is a potential resistance level, and as the chart above shows, in GBPUSD, this currently stands at 1.3413.
Closing breaks above 1.3413 may now be needed to suggest that a more extended phase of strength might be possible, with the next resistance then marked by 1.3589, the July 24th session high, and if this point is broken to the upside, the 1.3789 level which is the July 1st failure high in price.
The material provided here has not been prepared accordance with legal requirements designed to promote the independence of investment research and as such is considered to be a marketing communication. Whilst it is not subject to any prohibition on dealing ahead of the dissemination of investment research, we will not seek to take any advantage before providing it to our clients.
Pepperstone doesn’t represent that the material provided here is accurate, current or complete, and therefore shouldn’t be relied upon as such. The information, whether from a third party or not, isn’t to be considered as a recommendation; or an offer to buy or sell; or the solicitation of an offer to buy or sell any security, financial product or instrument; or to participate in any particular trading strategy. It does not take into account readers’ financial situation or investment objectives. We advise any readers of this content to seek their own advice. Without the approval of Pepperstone, reproduction or redistribution of this information isn’t permitted.

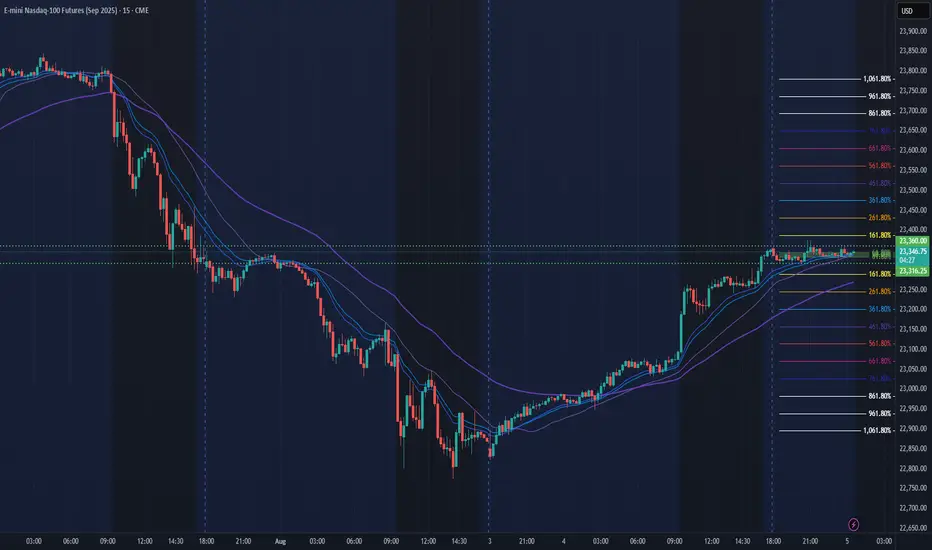
NQ Power Range Report with FIB Ext - 8/5/2025 SessionCME_MINI:NQU2025
- PR High: 23360.00
- PR Low: 23316.25
- NZ Spread: 97.75
Key scheduled economic events:
09:45 | S&P Global Services PMI
10:00 | ISM Non-Manufacturing PMI
- ISM Non-Manufacturing Prices
Session Open Stats (As of 12:35 AM 8/5)
- Session Open ATR: 294.27
- Volume: 23K
- Open Int: 278K
- Trend Grade: Long
- From BA ATH: -2.0% (Rounded)
Key Levels (Rounded - Think of these as ranges)
- Long: 23811
- Mid: 22096
- Short: 20383
Keep in mind this is not speculation or a prediction. Only a report of the Power Range with Fib extensions for target hunting. Do your DD! You determine your risk tolerance. You are fully capable of making your own decisions.
BA: Back Adjusted
BuZ/BeZ: Bull Zone / Bear Zone
NZ: Neutral Zone
US 30 Index – Potential Rebound or Deeper Retracement Ahead?Just as the US 30 became the last of the three major US indices to register a new all time high last Monday at 45160, on a final wave of positivity generated by the announcement of a trade deal between the US and EU, it was snatched away again as traders used the up move to take profit on longs.
This initial fall evolved into 5 straight daily declines which took the index from its record high of 45160 on Monday to a Friday close at 43591 as the sell off accelerated, driven by disappointment of a more hawkish than expected Fed, a new wave of trade tariffs from President Trump, weaker Amazon earnings , and on Friday, perhaps the biggest surprise of all, a Non-farm Payrolls release that showed the US labour market may be weakening faster than anticipated.
Looking forward, with the shock of Friday’s data reverberating through markets, US 30 traders still have lots to think about this week. The US ISM Services PMI release is due at 1500 BST on Tuesday. Service activity has been the major driver of growth in the US economy for the last 18 months, so this new update could have a big influence over where the US 30 index moves next. Any reading below 50 = economic contraction, while readings above 50 = economic expansion, and traders could well be focused on how this month’s print stacks up against last month’s reading of 50.8.
The earnings releases of 3 bellwether US corporates may also be relevant, given their US 30 index weightings. Caterpillar reports its Q2 results before the market open on Tuesday, with McDonald’s and Walt Disney reporting before the open on Wednesday. Traders may be looking to compare actual earnings against expected, alongside assessing any future revenue guidance that is provided against the current trade tariff operating environment.
Now, while the US 30 index has opened this new trading week on a more stable footing, currently trading up 0.25% at 43705 at the time of writing (0530 BST), assessing the technical outlook for the week ahead could also be useful for traders.
Technical Update: Deeper Retracement Risk Emerging?
While it might be argued that it was the reaction to the latest US employment data that saw US equities encounter fresh selling pressure, as the chart below shows, prices were already declining into Friday’s payrolls release.
Price weakness was materialising in the US 30 index right after it posted its new all-time high on Monday July 28th at 45160, and traders might now argue that last Thursday’s close below support provided by the Bollinger mid-average, currently at 44412, was the first potential indication that a more extended phase of price weakness was possible. The case was then perhaps strengthened by Friday’s negative reaction to the payrolls data, which saw closing breaks under support provided by the July 16th last correction low at 43770.
There is of course no guarantee that this price action will result in a retracement of the April 7th (36440) to July 28th strength (45160), but assessing what may be the potential support and resistance levels to monitor this week could be helpful, if the recent volatility continues to dominate price action at the start of August.
Possible Support Levels:
Last week’s price decline held at the 43337 level which was the August 1st low, and having previously found buyers at this point, they may be found again. As such, this 43337 level could now prove to be the first support focus for the week ahead.
Closing breaks below 43337, if seen, could lead to the possibility of further price declines, opening potential to test the next support at 41824, which is the 38.2% Fibonacci retracement of April to July 2025 price strength (see chart above).
Possible Resistance Levels:
Having now seen the Bollinger mid-average for the US 30 index turn lower after last week’s fall, this may now be the first resistance level to watch on any subsequent rally higher. It currently stands at 44442 and watching how this level is defended on a closing basis could be useful.
If a more sustained phase of price strength is to materialise, it could be closing breaks above the mid-average at 44442 that increases the possibility of it happening. Such moves could then see retests of the July 28th all-time high at 45160, possibly higher if this level is then breached on a closing basis.
The material provided here has not been prepared accordance with legal requirements designed to promote the independence of investment research and as such is considered to be a marketing communication. Whilst it is not subject to any prohibition on dealing ahead of the dissemination of investment research, we will not seek to take any advantage before providing it to our clients.
Pepperstone doesn’t represent that the material provided here is accurate, current or complete, and therefore shouldn’t be relied upon as such. The information, whether from a third party or not, isn’t to be considered as a recommendation; or an offer to buy or sell; or the solicitation of an offer to buy or sell any security, financial product or instrument; or to participate in any particular trading strategy. It does not take into account readers’ financial situation or investment objectives. We advise any readers of this content to seek their own advice. Without the approval of Pepperstone, reproduction or redistribution of this information isn’t permitted.

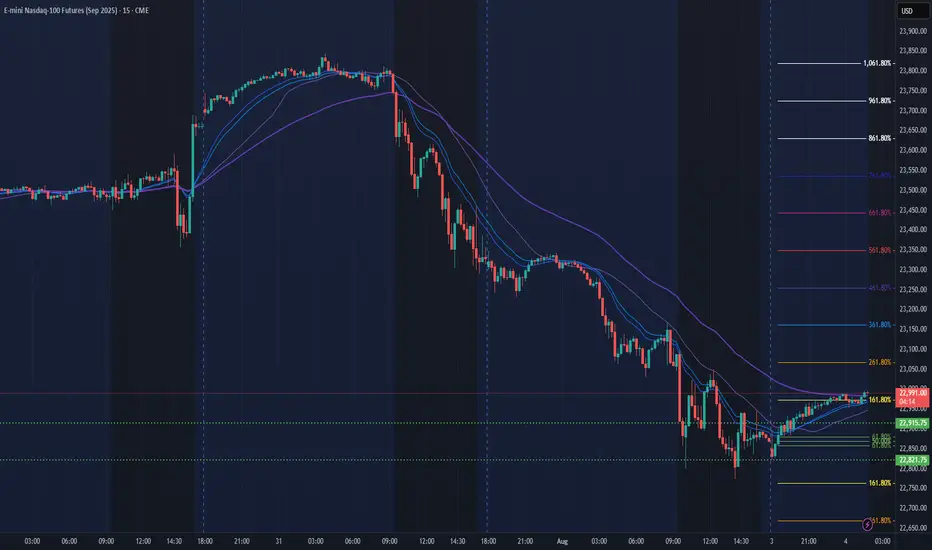
NQ Power Range Report with FIB Ext - 8/4/2025 SessionCME_MINI:NQU2025
- PR High: 22915.75
- PR Low: 22821.75
- NZ Spread: 210.0
No key scheduled economic events
Session Open Stats (As of 12:35 AM 8/4)
- Session Open ATR: 286.24
- Volume: 43K
- Open Int: 272K
- Trend Grade: Long
- From BA ATH: -3.6% (Rounded)
Key Levels (Rounded - Think of these as ranges)
- Long: 23811
- Mid: 22096
- Short: 20383
Keep in mind this is not speculation or a prediction. Only a report of the Power Range with Fib extensions for target hunting. Do your DD! You determine your risk tolerance. You are fully capable of making your own decisions.
BA: Back Adjusted
BuZ/BeZ: Bull Zone / Bear Zone
NZ: Neutral Zone
Deep Dive Into Bollinger Bands 🗓This article explores the Bollinger Bands indicator—a powerful volatility tool used by traders worldwide. You'll learn how it works, how to calculate it, and how to use it to detect potential breakouts, trend reversals, and overbought or oversold conditions in the market.
📚 Introduction to Bollinger Bands
In the fast-paced world of trading, understanding market volatility is key to making informed decisions. Bollinger Bands, developed by John Bollinger in the 1980s, offer a visual and statistical method to measure this volatility. Unlike simple moving averages, which only tell you the trend, Bollinger Bands expand and contract based on recent price action, helping traders spot overbought, oversold, or consolidation phases.
These bands dynamically adjust to market conditions, making them one of the most popular indicators for trend-following, mean-reversion, and breakout strategies. Whether you’re trading crypto, stocks, or forex, Bollinger Bands can help you identify high-probability setups by combining trend direction with volatility.
📚 How Bollinger Bands Are Calculated
Bollinger Bands consist of three lines:
Middle Band – This is a simple moving average (SMA) of the price, typically over 20 periods.
Upper Band – The middle band plus two standard deviations.
Lower Band – The middle band minus two standard deviations.
Middle Band = SMA(n)
Upper Band = SMA(n) + (k × σₙ)
Lower Band = SMA(n) - (k × σₙ)
Where σₙ is the standard deviation of the price for n periods and k is the multiplier, typically set to 2, which captures ~95% of price action under normal distribution. The middle band shows the average price over the last 20 candles. The upper and lower bands adjust based on how volatile the price has been — expanding in high volatility and contracting in low volatility.
🤖 For those traders who want to implement Bollinger Bands into algorithmic strategy we provide formula it's calculation in Pine Script:
basis = ta.sma(src, length) // Middle Band (SMA)
dev = mult * ta.stdev(src, length) // Standard Deviation × Multiplier
upper = basis + dev // Upper Band
lower = basis - dev // Lower Band
📚 How to Use MACD in Trading Strategies
⚡️Bollinger Band Squeeze (Volatility Contraction and Expansion)
The idea is pretty simple, а squeeze indicates low volatility and often precedes a breakout. The squeeze is the situation when the Upper Band and Lower Band contract, and BB width is at a local minimum. In this case you shall be prepared for the high volatility after the period of low volatility. This strategy doesn’t predict direction — it prepares you for volatility.
Long setup:
Price is in long-term uptrend, you can use 200 EMA as a major trend approximation - price shall be above it.
Bollinger Bands is narrow in comparison to the previous period. Price usually is in sideways.
Open long trade when candle shows a breakout and closes above the Upper Band.
Set a trailing stop-loss at the Middle Band.
Short setup:
Price is in long-term downtrend, you can use 200 EMA as a major trend approximation - price shall be below it.
Bollinger Bands is narrow in comparison to the previous period. Price usually is in sideways.
Open short trade when candle shows a breakdown and closes below the Lower Band.
Set a trailing stop-loss at the Middle Band
📈Long Trading Strategy Example
1. Price candle shall be closed above 200-period EMA. In our example we have BITMART:BTCUSDT.P 4h time frame.
2. Bollinger Bands shall be narrow in comparison with the previous periods.
3. Open long trade when candle closes above the Upper Band.
4. Close trade when price touched the Middle Band.
📉Short trading strategy example
1. Price candle shall be closed below 200-period EMA. In our example we have BITMART:BTCUSDT.P 4h time frame.
2. Bollinger Bands shall be narrow in comparison with the previous periods.
3. Open short trade when candle closes below the Lower Band.
4. Close trade when price touched the Middle Band.
⚡️Mean Reversion (Rebound from the Bands)
This is the most common approach to use Bollinger Bands. The idea is also very simple, we just want to open long if price touches Lower Band and short if price reaches Upper Band. Price tends to revert to the mean (Middle Band), especially in range-bound markets. It's very important to trade in the direction of the major trend to reduce the probability of the large move against you.
Long setup:
Price is in long-term uptrend, you can use 200 EMA as a major trend approximation - price shall be above it.
Open long trade when price touches the Lower Band.
Set the initial stop-loss at the fixed percentage below entry price. Choose this percentage number with your personal risk/money management, you shall be comfortable to lose this amount of money in case of stop-loss hit.
If price reached Middle Band set stop-loss at breakeven.
Close trade when price reached the Upper Band.
Short setup:
Price is in long-term downtrend, you can use 200 EMA as a major trend approximation - price shall be below it.
Open short trade when price touches the Upper Band.
Set the initial stop-loss at the fixed percentage above entry price. Choose this percentage number with your personal risk/money management, you shall be comfortable to lose this amount of money in case of stop-loss hit.
If price reached Middle Band set stop-loss at breakeven.
Close trade when price reached the Lower Band.
🧪 Important: the most common approach to close trades is the Middle Band touch, this is classic mean reversion. We experimented multiple times with different approached and revealed that usually it's better to take profit at the Upper/Lower band for long/short trades and use Middle Band only for setting stop-loss at breakeven. This approach provides better risk to reward ratio.
📈Long Trading Strategy Example
1. Price candle shall be closed above 200-period EMA. In our example we have BITMART:BTCUSDT.P 4h time frame.
2. Open long trade the Lower Band.
3. Put Initial stop-loss 2% below the entry price.
4. When price reached Middle band place stop-loss at the breakeven.
5. Close long trade at the Upper Band.
📉Short trading strategy example
1. Price candle shall be closed below 200-period EMA. In our example we have BITMART:BTCUSDT.P 4h time frame.
2. Open short trade the Upper Band.
3. Put Initial stop-loss 2% above the entry price.
4. When price reached Middle band place stop-loss at the breakeven.
5. Close short trade at the Lower Band.
🧪 Important tip: notice that initial stop-loss is needed only to avoid disaster in case of price moves strongly against you. This percentage shall give enough space to avoid its reaching too often. Mean reversion strategy provides fast trades with the small average gain, so you shall maintain the high win rate (perfectly above 70%). You have to choose stop-loss based on particular asset volatility.
⚡️Combined Approach: Mean Reversion + Trend Following
Skyrexio made multiple researches about Bollinger Bands strategies and we found that we can receive better gains in combination of different approaches. Mean reversion gives you great entry with discount but you don't need to exit that early. Use the trading stop and allow to gain profit while market is moving in your direction.
This approach you can find in our advanced strategy Bollinger Bands Enhanced Strategy which we shared in 2024. Click on the link to read about it and understand how you can combine best features of this popular indicator.
📚 Conclusion
Bollinger Bands are more than just a volatility indicator — they provide a flexible framework for understanding price dynamics and market conditions. By visualizing the relationship between price and standard deviation around a moving average, traders can gain valuable insights into whether an asset is consolidating, trending, or preparing for a breakout.
The real strength of Bollinger Bands lies in their versatility. They can adapt to different trading styles — whether you’re a short-term scalper, a swing trader, or a long-term position holder. From identifying squeeze setups to riding strong trends or capturing mean reversion moves, BBs offer a strategic edge when used correctly.
However, Bollinger Bands should never be used in isolation. Like any technical tool, they work best when combined with momentum indicators like RSI or MACD, volume analysis, and price action signals. Context is key: a signal that works well in a ranging market may fail during high momentum trends.
Ultimately, Bollinger Bands help traders make more informed, disciplined decisions by clarifying where price stands relative to recent history. When paired with sound risk management and broader market awareness, they become a powerful ally in navigating market uncertainty.
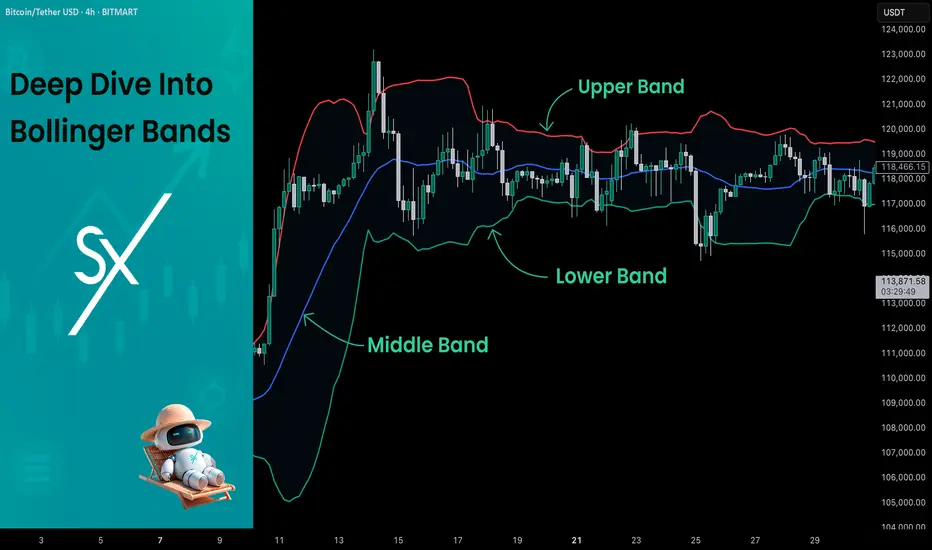
Chart Overview (SOL/USDT – 1D, Binance)Key Insights:
Support Zone: Around $160–165, aligning with Ichimoku support lines.
Fibonacci Levels: Price broke above the 1.618 level (~$175) and is now retesting.
Indicators Below: Showing a strong bullish crossover, supporting upward momentum.
Target Path: Drawn to reach $223, then $240–260 if bullish trend continues.
📈 Bullish Scenario:
Bounce from $160–165 zone
-Short-term target: $195–200
-Mid-term target: $223
-Long-term: $240–260
📉 Bearish Scenario:
If $160 support breaks:
Next support levels: $145, then $122
Worst-case retest: $95
✅ Conclusion:
Crucial zone now: Either a strong bounce or a bearish breakdown.
Current indicators and structure favor a bullish continuation if support holds.

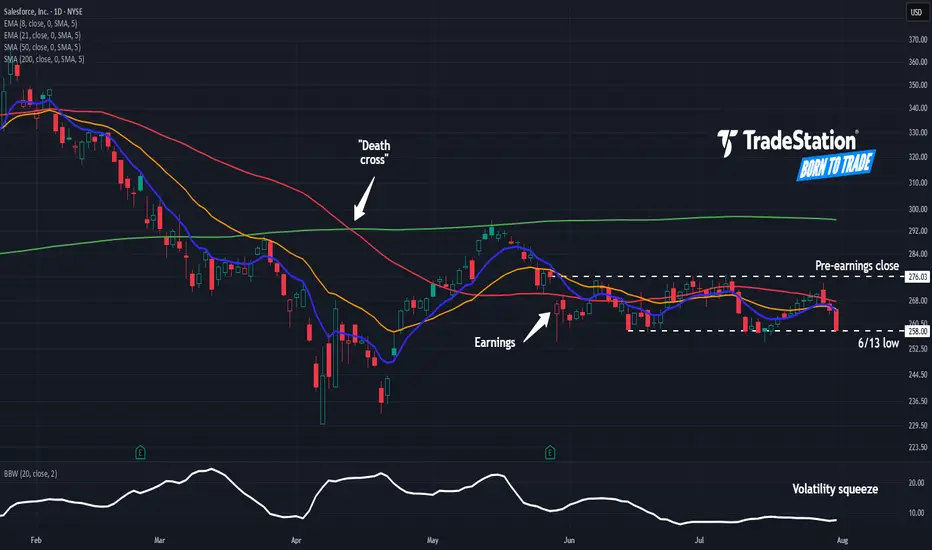
Salesforce May Face DistributionSalesforce has limped as other tech stocks hit new highs, and some traders may think it’s going into distribution.
The first pattern on today’s chart is the bearish price gap on May 29 despite better-than-expected quarterly results. That may reflect waning enthusiasm about the software company’s fundamentals.
Second is the pre-earnings closing price of $276.03. CRM has remained trapped below that level, which may suggest it’s become resistance.
Third is the June 13 low of $258. The stock bounced there in mid-July but may now be at risk of breaking it.
Next, Bollinger Bandwidth has narrowed as the stock formed a tight range between the two levels. Could price movement expand following that period of compression?
Last, the 50-day simple moving average (SMA) had a “death cross” below the 200-day SMA in April. The 8-day exponential moving average (EMA) is also below the 21-day EMA. Those patterns may be consistent with bearishness in the long and short terms.
TradeStation has, for decades, advanced the trading industry, providing access to stocks, options and futures. If you're born to trade, we could be for you. See our Overview for more.
Past performance, whether actual or indicated by historical tests of strategies, is no guarantee of future performance or success. There is a possibility that you may sustain a loss equal to or greater than your entire investment regardless of which asset class you trade (equities, options or futures); therefore, you should not invest or risk money that you cannot afford to lose. Online trading is not suitable for all investors. View the document titled Characteristics and Risks of Standardized Options at www.TradeStation.com . Before trading any asset class, customers must read the relevant risk disclosure statements on www.TradeStation.com . System access and trade placement and execution may be delayed or fail due to market volatility and volume, quote delays, system and software errors, Internet traffic, outages and other factors.
Securities and futures trading is offered to self-directed customers by TradeStation Securities, Inc., a broker-dealer registered with the Securities and Exchange Commission and a futures commission merchant licensed with the Commodity Futures Trading Commission). TradeStation Securities is a member of the Financial Industry Regulatory Authority, the National Futures Association, and a number of exchanges.
TradeStation Securities, Inc. and TradeStation Technologies, Inc. are each wholly owned subsidiaries of TradeStation Group, Inc., both operating, and providing products and services, under the TradeStation brand and trademark. When applying for, or purchasing, accounts, subscriptions, products and services, it is important that you know which company you will be dealing with. Visit www.TradeStation.com for further important information explaining what this means.
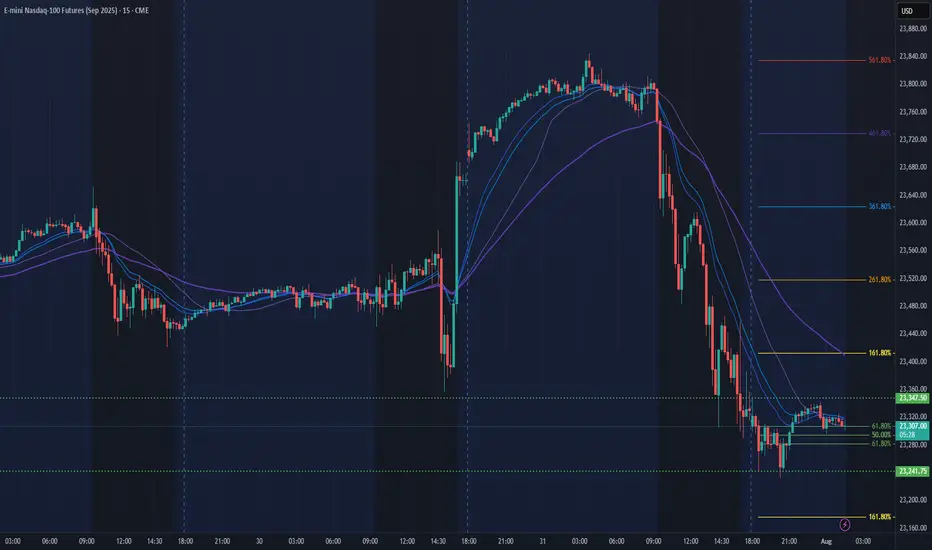
NQ Power Range Report with FIB Ext - 8/1/2025 SessionCME_MINI:NQU2025
- PR High: 23347.50
- PR Low: 23241.75
- NZ Spread: 236.0
Key scheduled economic events:
08:30 | Average Hourly Earnings
- Nonfarm Payrolls
- Unemployment Rate
09:45 | S&P Global Manufacturing PMI
10:00 | ISM Manufacturing PMI
- ISM Manufacturing Prices
Engulfing daily bar from ATH into new week lows
Session Open Stats (As of 12:45 AM 8/1)
- Session Open ATR: 262.82
- Volume: 45K
- Open Int: 280K
- Trend Grade: Long
- From BA ATH: -2.2% (Rounded)
Key Levels (Rounded - Think of these as ranges)
- Long: 23811
- Mid: 22096
- Short: 20383
Keep in mind this is not speculation or a prediction. Only a report of the Power Range with Fib extensions for target hunting. Do your DD! You determine your risk tolerance. You are fully capable of making your own decisions.
BA: Back Adjusted
BuZ/BeZ: Bull Zone / Bear Zone
NZ: Neutral Zone
UK 100 – Moving Back Into the Spotlight It’s been a while since we covered the UK 100, but it feels like recent moves and the fact there is a Bank of England (BoE) rate decision next Thursday (August 7th) means it warrants some extra attention.
For much of 2025 the UK 100 has been the under achiever when compared to other European indices, but things have changed slightly in July as a result of the breakout above the previous all-time high at 8909 (more on this below in technical update) which has led to multiple record peaks all the way up to the most recent one registered on July 28th at 9177.
This up move has been aided by bullish technical momentum, a weaker GBPUSD exchange rate, which can add support to the index given that UK 100 companies are multi-national, earning over 60% of their revenue outside of the UK, and increased expectations for a BoE rate cut of 25bps (0.25%) at their next rate meeting on Thursday August 7th.
Now, looking forward, before traders get ready for that BoE meeting, they must contend with the challenges presented by President Trump’s trade policy and two key US economic data releases that could impact sentiment towards the UK 100 into the weekend. The first piece of data is the US PCE Index inflation print, released later today at 1330 BST and the second is tomorrow’s Non-farm Payrolls update at 1330 BST.
Once traders have more clarity on the outlook for global trade after President Trump’s August 1st tariff deadline has passed, alongside the fresh insight into the current path of US inflation and the health of the labour market provided by these two pivotal pieces of economic data, their preparation can begin for a potential 25bps (0.25%) rate cut in the UK, as the market expects and the accompanying commentary from BoE Governor Bailey in the press conference on whether more cuts could be in the pipeline across the remaining months of 2025.
Technical Update: Assessing the Current Uptrend
Since posting a low of 7525 on April 7th it has been a positive period of trading for the UK 100 index, a move that has seen a near 22% advance. As the chart below shows, except for the decline down to 8692 on June 26th, this has been an almost uninterrupted phase of price strength, as a positive pattern of higher price highs and higher price lows has materialised.
Of course, there is no guarantee that this type of positive pattern will extend and continue to see new all-time highs posted, but traders may be anticipating further attempts at upside price extension, especially while support below current price levels remains intact.
So, with this in mind, let’s look at what could be the relevant support and resistance levels that might influence trader sentiment over upcoming sessions.
Potential Support Levels:
While Monday did see a new all-time high posted at 9177, a price sell-off then materialised to register a low for the day at 9060, but with support being found at this level, it might be suggested this now represents a higher low within the positive trend and as such, is potentially now the first support focus, as the chart below shows.
Traders may find it useful to monitor how 9060 performs as a support on a closing basis, as if it were to give way over coming sessions, a more extended phase of price weakness may result. Such downside support breaks could then see the focus shift to the 38.2% Fibonacci retracement of June 26th to July 28th strength which stands at 8990, possibly even the 50% level at 8933.
Potential Resistance Levels:
Having been capped by the July 28th high at 9177, the UK 100 index may now need to see successful closing breaks above this level to suggest a continuation of the recent positive price trend.
Successful closing breaks above the 9177 high, may be an indication of continued price strength, opening potential for moves to the next possible resistance at 9253, which is the 161.8% Fibonacci extension, even 9335, the higher 200% extension level.
The material provided here has not been prepared accordance with legal requirements designed to promote the independence of investment research and as such is considered to be a marketing communication. Whilst it is not subject to any prohibition on dealing ahead of the dissemination of investment research, we will not seek to take any advantage before providing it to our clients.
Pepperstone doesn’t represent that the material provided here is accurate, current or complete, and therefore shouldn’t be relied upon as such. The information, whether from a third party or not, isn’t to be considered as a recommendation; or an offer to buy or sell; or the solicitation of an offer to buy or sell any security, financial product or instrument; or to participate in any particular trading strategy. It does not take into account readers’ financial situation or investment objectives. We advise any readers of this content to seek their own advice. Without the approval of Pepperstone, reproduction or redistribution of this information isn’t permitted.

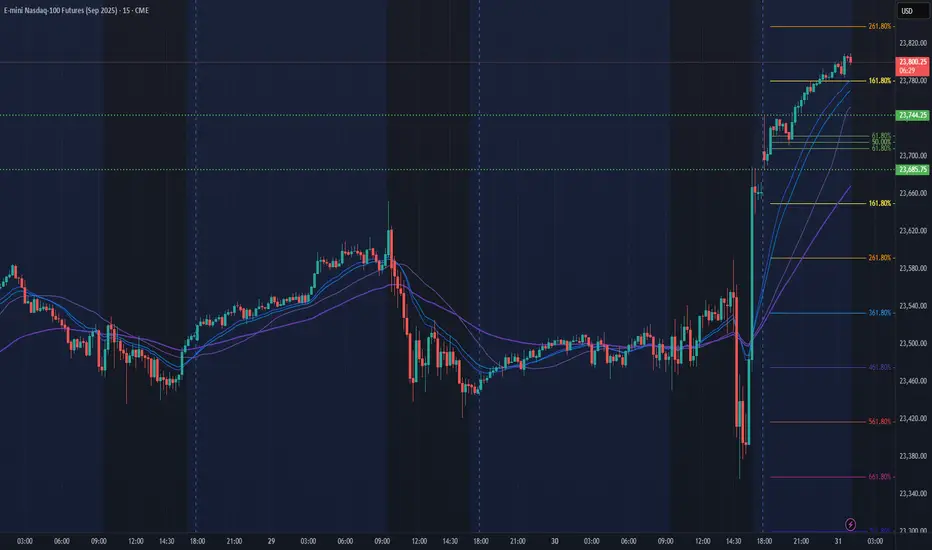
NQ Power Range Report with FIB Ext - 7/31/2025 SessionCME_MINI:NQU2025
- PR High: 23744.25
- PR Low: 23686.00
- NZ Spread: 130.5
Key scheduled economic events:
08:30 | Initial Jobless Claims
- Core PCE Price Index (MoM|YoY)
09:45 | Chicago PMI
New ATHs through Asian hours
Session Open Stats (As of 12:25 AM 7/31)
- Session Open ATR: 244.46
- Volume: 32K
- Open Int: 283K
- Trend Grade: Long
- From BA ATH: -0.6% (Rounded)
Key Levels (Rounded - Think of these as ranges)
- Long: 23811
- Mid: 22096
- Short: 20383
Keep in mind this is not speculation or a prediction. Only a report of the Power Range with Fib extensions for target hunting. Do your DD! You determine your risk tolerance. You are fully capable of making your own decisions.
BA: Back Adjusted
BuZ/BeZ: Bull Zone / Bear Zone
NZ: Neutral Zone
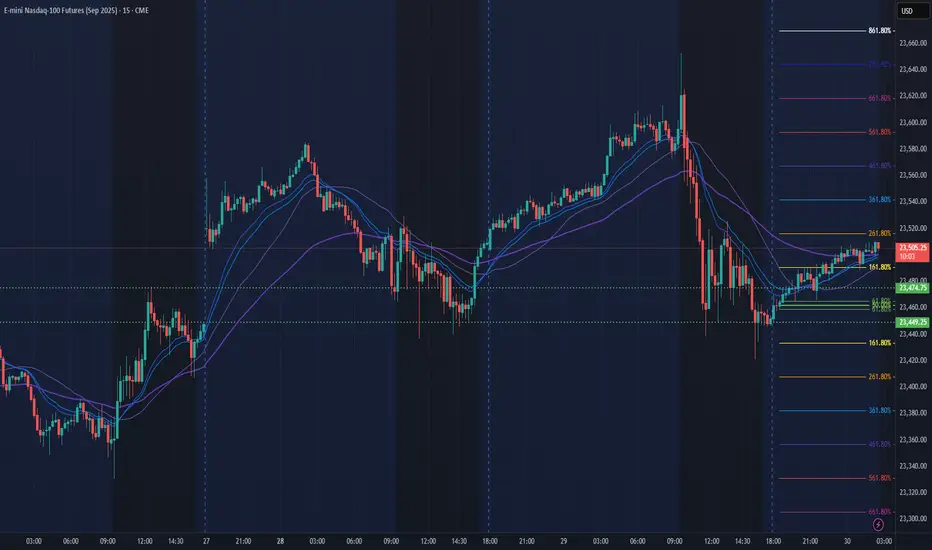
NQ Power Range Report with FIB Ext - 7/30/2025 SessionCME_MINI:NQU2025
- PR High: 23474.75
- PR Low: 23449.25
- NZ Spread: 57.0
Key scheduled economic events:
08:15 | ADP Nonfarm Employment Change
08:30 | GDP
10:30 | Crude Oil Inventories
14:00 | FOMC Statement
- Fed Interest Rate Decision
14:30 | FOMC Press Conference
AMP temp margins increase anticipating vol spike for economic events
Session Open Stats (As of 12:25 AM 7/30)
- Session Open ATR: 232.98
- Volume: 16K
- Open Int: 281K
- Trend Grade: Long
- From BA ATH: -0.6% (Rounded)
Key Levels (Rounded - Think of these as ranges)
- Long: 23811
- Mid: 22096
- Short: 20383
Keep in mind this is not speculation or a prediction. Only a report of the Power Range with Fib extensions for target hunting. Do your DD! You determine your risk tolerance. You are fully capable of making your own decisions.
BA: Back Adjusted
BuZ/BeZ: Bull Zone / Bear Zone
NZ: Neutral Zone
USDJPY – Strap in For the Central Bank Rollercoaster The next 4 trading days could be crucially important for FX markets, with traders bracing for the outcomes of a variety of different events including several central bank meetings, economic data readings and trade deal/tariff negotiations. No currency pair within the majors is likely to feel the impact of these events more than USDJPY, given that both the Federal Reserve (Fed) and Band of Japan (BoJ) interest rate decisions take place within a 9-hour window late on Wednesday evening and early Thursday morning, UK time (Fed 1900 BST Wed, BoJ 0400 BST Thurs).
The first move in USDJPY at the start of this week has been higher. This was in response to the announcement of a trade deal between the EU/US, which sees tariffs of 15% on most EU goods imported into the US and has been taken as a success for President Trump and his trade team. (general USD positive). When coupled with the political uncertainty surrounding Japanese PM Ishiba, who is fighting to keep his job, (potential JPY negative) USDJPY has traded from opening levels at 147.51 on Monday up to a high of 148.71 earlier this morning in Asia.
Looking forward, both the Fed and BoJ are expected to keep interest rates unchanged. This could make what is said at the accompanying press conferences by Fed Chairman Powell (1930 BST Wed) and BoJ Governor Ueda (0730 BST Thurs) on the timing of their next respective interest rate moves potentially pivotal for the direction of USDJPY into the weekend.
Tier 1 US economic data may also be important, with the Fed’s preferred inflation gauge (PCE Index) due for release at 1330 BST on Thursday, and the next update on the current health of the US labour market due on Friday at 1330 BST in the form of Non-farm Payrolls. Sentiment may also be impacted on Friday by any headlines or social media posts from President Trump regarding trade deals and updates on whether he may extend or hold certain countries to his current deadline of August 1st.
Technical Update: Focus on Fibonacci Retracement Resistance at 149.40
On July 16th 2025, USDJPY traded to a price high of 149.19, nearing what might have been considered a resistance level by traders at 149.40. This level is equal to the 50% Fibonacci retracement of the price weakness seen from 158.88 on January 10th down to 139.88, the April 22nd low. Having been capped by this resistance level, a setback in price developed last week.
However, this phase of price weakness encountered buying support around the Bollinger mid-average, currently at 146.98, from which fresh attempts at price strength have emerged. As a result, it might be argued that this type of price action is more constructive in nature, especially as since the April 22nd low was posted a pattern of higher price lows and higher price highs has so far materialised, as the chart above shows.
That said, with potential for a sustained period of USDJPY volatility in the week ahead let’s consider what may be the important support and resistance levels that could influence the direction of prices moving forward.
Potential Resistance Levels:
Having previously capped price strength, the 149.40 retracement level may prove to be successful in doing so again, meaning closing breaks above 149.40 might now be required to suggest a further period of price strength.
As the chart above shows, if successful breaks above 149.40 do materialise, potential may then turn towards tests of the next resistance at 151.21, the March 28th session high, even 151.65, the higher 61.8% Fibonacci resistance level.
Potential Support Levels:
Having seen it offer support to recent price declines, traders may still be focusing on the 146.98 Bollinger mid-average as an important level that if broken on a closing basis, might lead to a further phase of price weakness.
Closing breaks under the 146.98 support while not a guarantee of further declines, could suggest potential to test 145.85, the July 24th session low and rally point, even towards 142.68, the July 1st low.
The material provided here has not been prepared accordance with legal requirements designed to promote the independence of investment research and as such is considered to be a marketing communication. Whilst it is not subject to any prohibition on dealing ahead of the dissemination of investment research, we will not seek to take any advantage before providing it to our clients.
Pepperstone doesn’t represent that the material provided here is accurate, current or complete, and therefore shouldn’t be relied upon as such. The information, whether from a third party or not, isn’t to be considered as a recommendation; or an offer to buy or sell; or the solicitation of an offer to buy or sell any security, financial product or instrument; or to participate in any particular trading strategy. It does not take into account readers’ financial situation or investment objectives. We advise any readers of this content to seek their own advice. Without the approval of Pepperstone, reproduction or redistribution of this information isn’t permitted.

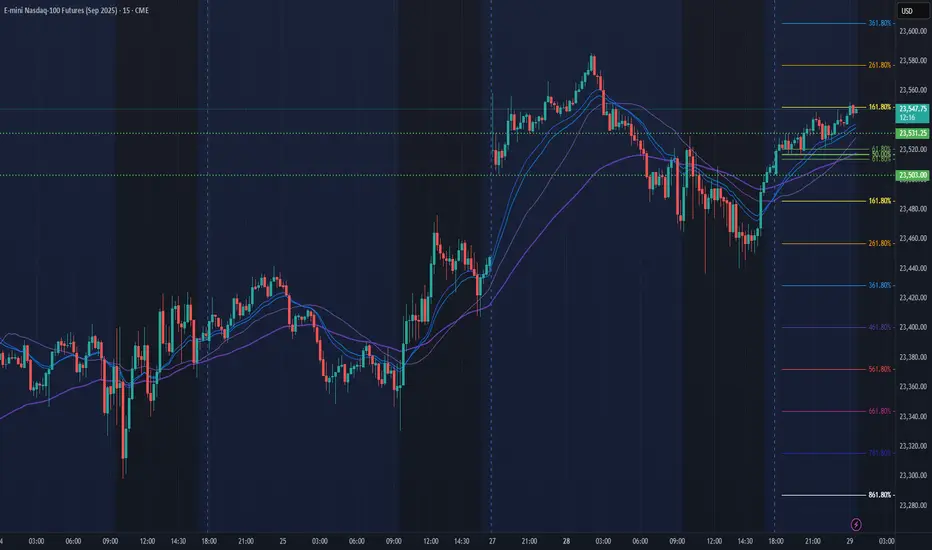
NQ Power Range Report with FIB Ext - 7/29/2025 SessionCME_MINI:NQU2025
- PR High: 23531.00
- PR Low: 23503.00
- NZ Spread: 62.5
Key scheduled economic events:
10:00 | CB Consumer Confidence
- JOLTs Job Openings
Session Open Stats (As of 12:25 AM 7/29)
- Session Open ATR: 233.38
- Volume: 17K
- Open Int: 280K
- Trend Grade: Long
- From BA ATH: -0.2% (Rounded)
Key Levels (Rounded - Think of these as ranges)
- Long: 23811
- Mid: 22096
- Short: 20383
Keep in mind this is not speculation or a prediction. Only a report of the Power Range with Fib extensions for target hunting. Do your DD! You determine your risk tolerance. You are fully capable of making your own decisions.
BA: Back Adjusted
BuZ/BeZ: Bull Zone / Bear Zone
NZ: Neutral Zone
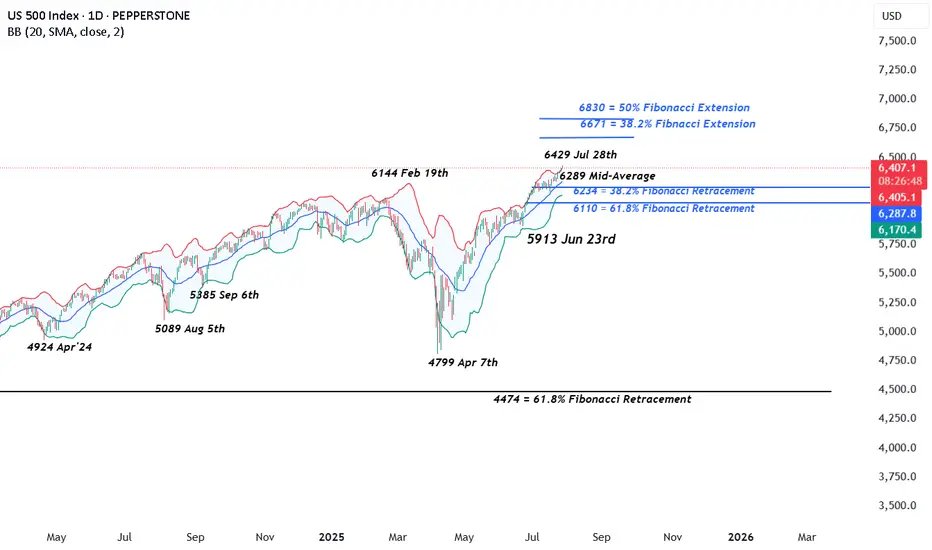
US 500 – Potentially A Pivotal Week Ahead The US 500 index registered a new record closing high on Friday at 6396 continuing a bullish trend that has yet to show many signs of faltering. The Monday open has seen this move extend as traders digest the positive news flow from the weekend that a US/EU trade deal has been agreed after President Trump and EU Commission head Ursula Von der Leyen, met in Scotland on Sunday. This has seen the US 500 index rally another 0.4% to a new high of 6429 (0730 BST).
However, the week ahead could be a pivotal one for the direction of US stock indices over the remainder of the summer, and in this regard, it is perhaps surprising that market volatility measures, such as the VIX (fear Index), are back to their lowest levels since late March, indicating limited trader concern for what lies ahead. Although, things can change very quickly.
In many ways the week ahead is one that has it all, including a new round of US/China trade talks which start today, a Federal Reserve (Fed) rate decision, key tech earnings, tier 1 US data releases and on-going trade/tariff discussions. More than enough to ensure there is the potential for US 500 price action to become increasingly volatile as the week progresses.
Looking forward, Wednesday could be a very busy day, with the Fed Interest Rate Decision released at 1900 BST and quickly followed at 1930 BST by the press conference led by Chairman Powell, who has been under intense political pressure in the last 10 days. While the Fed are expected to keep rates unchanged, traders may be interested to see which policymakers were keen to vote for a cut, as well as whether Chairman Powell’s comments indicate a September rate reduction may be more likely than currently anticipated.
Then, later Wednesday evening Microsoft, Qualcomm and Meta release their earnings updates after the close, with Amazon and Apple’s results due after the market close on Thursday. These releases could be crucial for sentiment towards the US 500, with particular focus being paid to what these companies say about future revenue and tariff issues, as well as the specific performance of AI and cloud services.
This only takes us to the middle of the week, which is where the tier 1 US economic data releases take over, with the PCE Index, the Fed’s preferred gauge of inflation, due on Thursday at 1330 BST, and then the all-important Non-farm Payrolls update on the current health of the US labour market released on Friday at 1330 BST. US 500 index traders may well be sensitive to the outcome of both of these prints.
That’s still not all. Friday’s US employment update coincides with President Trump’s tariff deadline which could add to US 500 volatility into the weekend.
Wow, I did say it’s a week that has it all!
Technical Update: New All-Time Highs Posted Again
It looks as if the latest US 500 index activity is maintaining the current positive trending themes after another all-time high was posted this morning at 6429. This could skew risks towards the further development of the pattern of higher price highs and higher price lows that has materialised since the April 7th downside extreme at 4799 was seen.
However, it must be remembered, these moves do not guarantee this price activity will continue, so traders may find it useful to assess the possible support and resistance levels that could influence price activity moving forward across what is set to be a very busy week of events.
Possible Support Levels:
If any US 500 price weakness does materialise across the week ahead with the potential to develop into a more extended phase of declines, a support level that traders may consider worth monitoring could be 6289.
6289 is equal to the current level of the rising Bollinger mid-average. Closing breaks below 6289 might suggest a more extended phase of weakness is possible, opening the potential for moves back to 6234, which is the 38.2% Fibonacci retracement, possibly further if this level in turn gives way.
Possible Resistance Levels:
Having been capped by the 6429 all-time high this morning, sellers may continue to be found at this level, so this might prove to be the first potential resistance if fresh attempts at price strength develop over the coming week.
It may be helpful for traders to watch how this 6429 level is defended on a closing basis, as successful closing breaks might suggest a further extension of the uptrend pattern currently evident in price activity.
Such closing breaks higher may well suggest price strength towards 6671, which is the 38.2% Fibonacci extension level of the February 19th to April 7th sell-off.
The material provided here has not been prepared accordance with legal requirements designed to promote the independence of investment research and as such is considered to be a marketing communication. Whilst it is not subject to any prohibition on dealing ahead of the dissemination of investment research, we will not seek to take any advantage before providing it to our clients.
Pepperstone doesn’t represent that the material provided here is accurate, current or complete, and therefore shouldn’t be relied upon as such. The information, whether from a third party or not, isn’t to be considered as a recommendation; or an offer to buy or sell; or the solicitation of an offer to buy or sell any security, financial product or instrument; or to participate in any particular trading strategy. It does not take into account readers’ financial situation or investment objectives. We advise any readers of this content to seek their own advice. Without the approval of Pepperstone, reproduction or redistribution of this information isn’t permitted.
Ethereum Staking Strain Exposed — Daxprime Weighs InIn July, the Ethereum ecosystem faced a new challenge: a sharp increase in the staking exit queue revealed structural weaknesses in the current liquid staking architecture. Within just a few days, more than 75,000 validators submitted requests to exit, causing temporary disruptions in certain derivative protocols and downward pressure on the prices of liquid staking tokens such as stETH, rETH, and sfrxETH.
Daxprime, a firm specializing in institutional analytics and active strategies in the Web3 sector, believes that this situation presents not only risks, but also new opportunities for profit — particularly for well-prepared market participants.
What Happened?
Since transitioning to Proof-of-Stake in 2022, Ethereum has enabled staking through validators. However, to exit the network, validators must join a queue. Under normal market conditions, this process takes just a few hours to a couple of days. But in July, a sudden surge in withdrawal requests extended the queue to over seven days — the longest wait time since the Shanghai upgrade.
Several factors contributed to the spike in exits:
Increased market volatility;
Rising yields in alternative DeFi instruments;
Panic reactions to liquidity stress in certain protocols.
As a result, liquid staking tokens — which are designed to trade close to a 1:1 ratio with ETH — began to trade at discounts of 3% to 4%, particularly on low-liquidity DEX platforms.
Systemic Risk or Temporary Disturbance?
Daxprime analysts emphasize that this is not a structural threat to Ethereum itself. However, the recent events clearly demonstrate that even "liquid" staking is still fundamentally tied to base-layer network constraints. Protocols like Lido and Rocket Pool are susceptible to imbalances between assets and liabilities, especially when there is a rapid increase in redemption demand.
This also means that users trading staking derivatives without understanding the mechanics of validator exit processes may face temporary illiquidity or losses when attempting to unwind positions during stress events.
How to Profit — Daxprime’s Perspective
For experienced market participants, such imbalances offer entry points with positive expected value. Here’s how Daxprime identifies ways to profit:
1. Arbitrage on Discounted Tokens
When stETH or sfrxETH fall below 0.97 ETH, there is an opportunity to buy these tokens on the secondary market and redeem them for full ETH value — either through redemption protocols or by waiting through the validator exit process.
2. Liquidity Provision with a Premium
Liquidity providers in stETH/ETH or sfrxETH/ETH pools during periods of market stress earn higher trading fees and farming incentives due to increased volume and imbalance in the pools.
3. Futures and Hedging Strategies
On platforms such as dYdX or Aevo, traders can build structured positions using stETH as the spot asset and hedging via ETH futures. This allows them to profit from either the restoration of parity or a continuation of the spread.
Daxprime’s Conclusion
The current exit queue backlog is not a catastrophe — it is a reminder that liquidity in crypto markets is always conditional. Stress events create inefficiencies that sophisticated investors can turn into sources of return.
Daxprime provides the tools to monitor such inefficiencies and helps clients execute strategies that not only mitigate risk but convert volatility into profit.
In markets where even “liquid” assets can become illiquid, those who understand the mechanics and act ahead of the curve stand to win.
Capital B Hits 2,000 BTC as BBDelta Highlights StrategyEthereum has surged past the $3,900 mark, propelled in part by news that Sharplink has acquired 77,200 ETH — a transaction worth over $300 million at current market value. For BBDelta, this move is not just market noise — it’s a concrete example of how institutional-grade Ethereum strategies can drive both asset growth and consistent income.
Sharplink, originally focused on gaming and Web3 infrastructure, has recently pivoted toward an asset-heavy Ethereum strategy. This latest acquisition positions the firm among the top ETH holders globally — and, more importantly, signals a clear roadmap to profit generation within the Ethereum ecosystem.
BBDelta analysts believe Sharplink isn’t buying ETH for speculative purposes. Rather, the company is likely deploying a multifaceted revenue model using its holdings. That includes high-yield staking via Ethereum’s proof-of-stake protocol, engagement with DeFi lending platforms, and participation in liquidity pools. These strategies, when executed correctly, can yield between 4% and 8% annually — paid directly in ETH or stablecoins.
In addition to yield generation, Sharplink could be utilizing ETH to collateralize derivatives positions, fund tokenized infrastructure, or support its presence in NFT ecosystems. Ethereum, as a platform, offers an incredibly diverse set of use cases — making it more than just a crypto asset, but a cornerstone of digital finance.
The breakout past $3,900 further strengthens this strategy. BBDelta’s technical analysis shows increased open interest in ETH futures and options, indicating rising institutional demand and the likelihood of continued volatility — a prime environment for experienced players to profit from both price movement and structure-based yields.
Sharplink’s timing also reflects sound macroeconomic thinking. As fiat currencies continue to face inflationary pressure and traditional interest rates plateau, ETH-based strategies offer both protection and performance. BBDelta believes this dual value proposition — yield + appreciation — is driving renewed interest in Ethereum as a strategic reserve asset.
At BBDelta, we empower clients to capitalize on these same dynamics. Whether it’s through ETH staking, DeFi revenue models, or structured derivatives, we offer the tools and advisory frameworks that allow investors to turn ETH holdings into active profit centers — with proper risk management in place.
Ethereum’s $3,900 milestone is not a peak — it’s a gateway to next-level opportunity. For those with the infrastructure, insights, and risk controls in place, the digital economy is not just a bet — it’s a business.

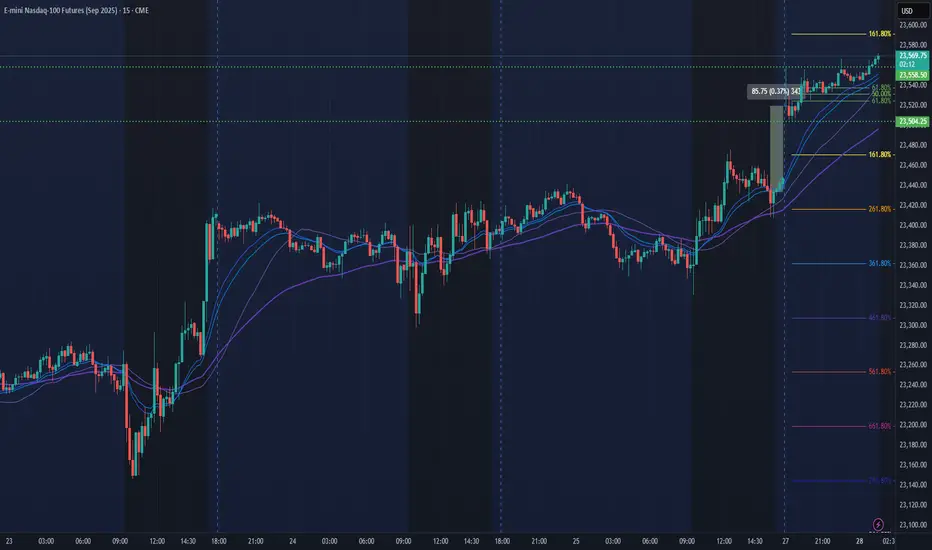
NQ Power Range Report with FIB Ext - 7/28/2025 SessionCME_MINI:NQU2025
- PR High: 23558.25
- PR Low: 23504.00
- NZ Spread: 121.25
No key scheduled economic events
Weekend gap up of 0.37% into new ATH
Session Open Stats (As of 12:25 AM 7/28)
- Session Open ATR: 245.44
- Volume: 23K
- Open Int: 276K
- Trend Grade: Long
- From BA ATH: -0.0% (Rounded)
Key Levels (Rounded - Think of these as ranges)
- Long: 23811
- Mid: 22096
- Short: 20383
Keep in mind this is not speculation or a prediction. Only a report of the Power Range with Fib extensions for target hunting. Do your DD! You determine your risk tolerance. You are fully capable of making your own decisions.
BA: Back Adjusted
BuZ/BeZ: Bull Zone / Bear Zone
NZ: Neutral Zone
bullish on GOLDTrading Idea Setup:
XAUUSD has given me enough confirmation indicators to forecast a bullish run from this price point. ↗️🟢
✅Favorable TP level(s):
⦁ 3414.022
⦁ 3445.179
🛑Stop Loss:
⦁ 3277.205
Indications used:
Trend confirmation indicator
Elliot wave assistance
Momentum indicators
______________________________
Trading Involves Risk: Decisions to buy, sell, hold, or trade in securities, commodities, and other investments carry inherent risk, including the possibility of substantial losses. Please ensure every trade placed is supported by your own thorough analysis and/or fundamental research.
Ps: All the trades that I place, I do hold indefinitely unless noted otherwise but TP points will always be provided. Happy Trading 🖤
