Gold - All eyes on Wednesday 08 May - FED🟡 Gold Traders: Nothing Matters Until Wednesday! ⏳💤
Hey traders! 👋
This week, all eyes are on Wednesday... and everything before that? Mostly noise.
Let me break it down for you. 👇
📊 Technical Outlook
Gold is chilling above a key resistance level right now.
Trendlines suggest we won’t see any major moves before Wednesday unless big news drops. 📰
🕐 Asian session is kicking things off above resistance.
If bulls show up there, we could break Trendline 1 (Image below) and head towards the $3300 🎯 target.
📉 RSI across multiple timeframes? Pretty neutral.
If Asia trades flat or slightly bearish, gold might range between $3210–$3250.
Break below $3201, and things could get shaky... but the European session might push us back above that support.
U.S. session on Monday? Likely a sideways snoozefest 😴 (unless surprise news hits).
🎯 Trade Setup (Mon–Wed)
I’m looking to play the range between:
$3261 (Trendline 2) 🔼 and $3169 (Trendline 4) 🔽
That’s a comfy $90 window I’m aiming to trade before Wednesday's fireworks. 🚀
🔮 After Wednesday – The FED Factor 💣
Here’s the real catalyst:
Wednesday, May 7 at 2:00 PM EST – FOMC Rate Decision
If the FED cuts rates (not likely, but possible under pressure), gold could tank hard. 💥
I’m talking a potential drop to $3150 or lower 🕳️📉
That’d be a -$90+ move easy.
FED has been holding the line 💪, resisting pressure (especially from Trump back in the day), but if the economy flashes red, that rate cut might come sooner than expected.
🧠 Final Thoughts
FED paused hikes, but left the door open for 3 rate cuts this year.
Until we get more clarity, no strong bullish signals on gold.
My bias stays: Bearish unless proven otherwise. 🐻💬
Stay sharp out there, and watch those sessions. Wednesday’s the real deal! 💼📉
And last but not least, look at this and let us know what you think about please:
Some would say its impossible but as we know, gold can do everything!
-------------------------------------------------------------------------
This is just my personal market idea and not financial advice! 📢 Trading gold and other financial instruments carries risks – only invest what you can afford to lose. Always do your own analysis, use solid risk management, and trade responsibly.
Good luck and safe trading! 🚀📊
Volatility

NQ Power Range Report with FIB Ext - 5/6/2025 SessionCME_MINI:NQM2025
- PR High: 20036.75
- PR Low: 20007.00
- NZ Spread: 66.75
Key scheduled economic events:
13:00 | 10-Year Note Auction
Auction holding around 50% of Friday's breakout range
- Value gradually declining below previous session low
Session Open Stats (As of 12:25 AM 5/6)
- Session Open ATR: 598.47
- Volume: 27K
- Open Int: 255K
- Trend Grade: Bear
- From BA ATH: -11.8% (Rounded)
Key Levels (Rounded - Think of these as ranges)
- Long: 20954
- Mid: 19246
- Short: 16963
Keep in mind this is not speculation or a prediction. Only a report of the Power Range with Fib extensions for target hunting. Do your DD! You determine your risk tolerance. You are fully capable of making your own decisions.
BA: Back Adjusted
BuZ/BeZ: Bull Zone / Bear Zone
NZ: Neutral Zone

NQ Power Range Report with FIB Ext - 5/6/2025 SessionCME_MINI:NQM2025
- PR High: 20201.75
- PR Low: 20108.25
- NZ Spread: 209.0
Key scheduled economic events:
09:45 | S&P Global Services
10:00 | ISM Non-Manufacturing PMI
- ISM Non-Manufacturing Prices
Holding previous week's highs
- Advertising ability to break 20400 into Mach 26 daily pivot
Session Open Stats (As of 12:55 AM 5/6)
- Session Open ATR: 634.22
- Volume: 43K
- Open Int: 258K
- Trend Grade: Bear
- From BA ATH: -11.4% (Rounded)
Key Levels (Rounded - Think of these as ranges)
- Long: 20954
- Mid: 19246
- Short: 16963
Keep in mind this is not speculation or a prediction. Only a report of the Power Range with Fib extensions for target hunting. Do your DD! You determine your risk tolerance. You are fully capable of making your own decisions.
BA: Back Adjusted
BuZ/BeZ: Bull Zone / Bear Zone
NZ: Neutral Zone

GBPUSD Technical Expert Review - 3 May 2025🔮 Price Forecast (Main Scenarios)
📈 Bullish Scenario (if price reacts from current level):
Price may bounce from the current 1H LQ Close zone (gray).
It could rally toward the upper 1H LQ Close zone (purple) to retest it and potentially trigger Phase 2 Inducement.
🎯 First target: 1.33150
🎯 Second target: 1.33450 (just below the 4H LQ Close)
📉 Bearish Scenario (if the current zone breaks):
A clean close below 1.32500 could open the path toward the 4H LQ Close zone.
🧲 Expect potential reversal around 1.31600–1.31800 (major buy zone).

EURUSD Technical Expert Review - 3 May 2025📊 Comprehensive Analysis – Multi-Layered Setup Based on LQ Close + Classic Liquidity Manipulation
✅ 1. Proper Reaction to 8H LQ Close Zone
Price reacted accurately to the 8-hour LQ Close zone. However, the 40% level of the ATI candle remains untouched. If price revisits this area, we can expect a potential sell setup, especially if we get confirmation through structure breaks, engulfing candles, or ATI invalidation.
🧠 2. Manipulation of Classic Liquidity Patterns (Trendline, Channel, Triangle)
We see a clean sweep of all classic retail patterns – trendlines, ascending/descending channels, and triangle breakouts. These acted as liquidity traps and were perfectly manipulated, representing Phase 1 and 2 inducements, similar to concepts in ICT and Vector strategies.
📈 3. Bullish Move From 1H LQ Close to Black Trendline
From the 1H LQ Close zone, we had a bullish impulse that pushed price toward the black trendline. However, this move failed to sustain due to a sharp drop caused by news, indicating it might have been a fakeout or part of an incomplete internal structure.
⚠️ 4. Suicide Level Below = Potential for Short-Term Reaction
There’s a key “suicide level” at the bottom of the chart – a high-probability zone for a quick bullish reaction. If price shows impulsive behavior or liquidity sweeps on lower timeframes, this level could push price back up to the 1H LQ Close zone.
🔁 5. If Suicide Level Fails → Watch for 4H LQ Close Zone to Act as Reversal Point
If the suicide level doesn't hold, we shift focus to the 4H LQ Close zone, which could act as a major reversal area. Look for bullish confirmations like order blocks, strong engulfing candles, or liquidity voids forming around that area.
🎯 Final Note:
This chart is a perfect example of how LQ Close zones across multiple timeframes, paired with classic liquidity traps and smart price action confirmation, can guide high-quality setups in the Phantom Pips style.
Right now, we’re waiting for a clear reaction from either:
The 40% ATI candle zone above → Sell opportunity
The 4H LQ Close zone below → Potential buy setup

04/28 Weekly GEX AnalysisDETAILED IMAGE:
Here’s what the charts and indicators are showing right now until Friday.
We are approaching a key breakout zone.
🐂 🟢 IF the market breaks above the white bearish daily trendline, the next bullish target could be between 5515–5680.
🟦 ⚖️ The chop area is between 5435–5515.
Expect more back-and-forth moves here if the breakout fails.
🐻🔴 Watch out: if the price drops below 5435 or 5425, there’s little support left.
This could trigger a sharp sell-off ("Bearish Armageddon" scenario).
GEX profiles remain positive 🟢 across all near expirations — for now — suggesting that underlying support still exists, but we need to monitor any changes closely.
IVRank is still relatively high (30.9), meaning options are priced with a decent amount of implied volatility.
🟢Short-term sentiment is currently bullish, with some speculative activity picking up.
This suggests that traders are expecting less volatility over the next month compared to what we saw in the past week.
However, if we look at institutional positions focused on longer-term expirations (especially beyond 30 days on SPX/AM maturities), the picture remains bearish 🔴 or at least highly volatile.
These players are still strongly hedging against downside risks.
This confirms the broader point:
Even though price action managed to recover to pre-tariff-announcement levels — with very low trading volume — we’re not out of the woods yet.
Until we can break and hold above the key resistance bearish trend with HIGH BUY VOLUME (aka. momentum), we shouldn't expect a strong, stable GEX profile across all expirations like we had in the past.

Btc ready to blast 100000Fib levels are crossing one by one
Next target 99020 to 100000
Btc form LL TO LH TO HH
NEXT HIGH 99020 NEARLY

Good PalantirianNoticed recently there is very few NASDAQ:PLTR stock for sale on the market. As a good and kind trader I decide to borrow ad sell couple of NASDAQ:PLTR like a good move to provide liquidity to the market and help other traders to obtain so passionately desired Palantir stock.
Dear Palatirians pls don't get me wrong. I'm not betraying our faith, just need to step back for a while

NQ Power Range Report with FIB Ext - 5/2/2025 SessionCME_MINI:NQM2025
- PR High: 19797.25
- PR Low: 19749.50
- NZ Spread: 106.75
Key scheduled economic events:
08:30 | Average Hourly Earnings
Nonfarm Payrolls
Unemployment Rate
Advertising rotation short off 20100
- Holding auction inside previous session range
Session Open Stats (As of 12:55 AM 5/2)
- Session Open ATR: 647.21
- Volume: 47K
- Open Int: 250K
- Trend Grade: Bear
- From BA ATH: -11.8% (Rounded)
Key Levels (Rounded - Think of these as ranges)
- Long: 20954
- Mid: 19246
- Short: 16963
Keep in mind this is not speculation or a prediction. Only a report of the Power Range with Fib extensions for target hunting. Do your DD! You determine your risk tolerance. You are fully capable of making your own decisions.
BA: Back Adjusted
BuZ/BeZ: Bull Zone / Bear Zone
NZ: Neutral Zone

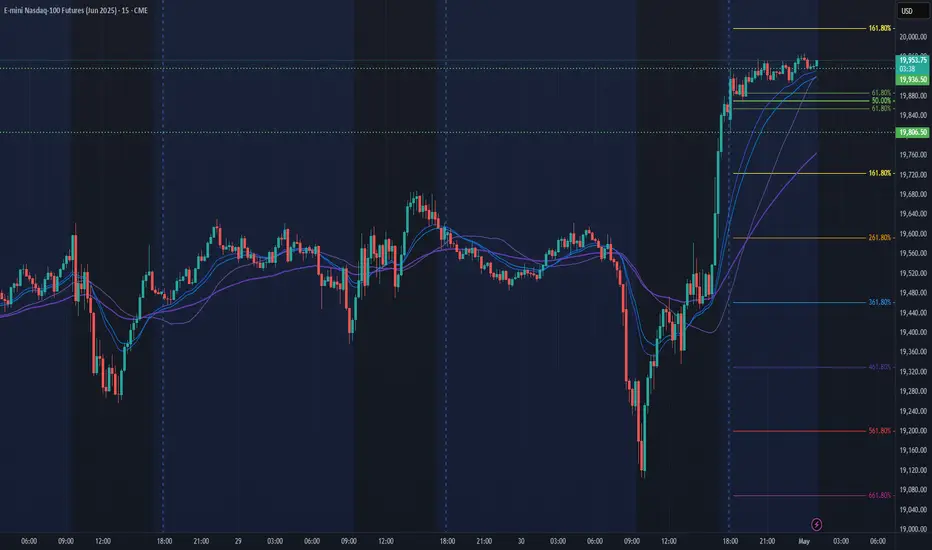
NQ Power Range Report with FIB Ext - 5/1/2025 SessionCME_MINI:NQM2025
- PR High: 19936.00
- PR Low: 19805.00
- NZ Spread: 292.5
Key scheduled economic events:
08:30 | Initial Jobless Claims
09:45 | S&P Global Manufacturing PMI
10:00 | ISM Manufacturing PMI
- ISM Manufacturing Prices
Wide previous session swing expanding week high and low
- Continuing to push highs back towards 20k
Session Open Stats (As of 12:25 AM 5/1)
- Session Open ATR: 662.61
- Volume: 47K
- Open Int: 241K
- Trend Grade: Bear
- From BA ATH: -11.9% (Rounded)
Key Levels (Rounded - Think of these as ranges)
- Long: 20954
- Mid: 19246
- Short: 16963
Keep in mind this is not speculation or a prediction. Only a report of the Power Range with Fib extensions for target hunting. Do your DD! You determine your risk tolerance. You are fully capable of making your own decisions.
BA: Back Adjusted
BuZ/BeZ: Bull Zone / Bear Zone
NZ: Neutral Zone
NQ Power Range Report with FIB Ext - 4/30/2025 SessionCME_MINI:NQM2025
- PR High: 19611.75
- PR Low: 19563.25
- NZ Spread: 108.5
Key scheduled economic events:
08:15 | ADP Nonfarm Employment Change
08:30 | GDP
09:45 | Chicago PMI
10:00 | Core PCE Price Index (YoY|MoM)
10:30 | Crude Inventories
Maintaining inside print week range
Session Open Stats (As of 12:55 AM 4/30)
- Session Open ATR: 654.86
- Volume: 32K
- Open Int: 245K
- Trend Grade: Bear
- From BA ATH: -13.8% (Rounded)
Key Levels (Rounded - Think of these as ranges)
- Long: 20954
- Mid: 19246
- Short: 16963
Keep in mind this is not speculation or a prediction. Only a report of the Power Range with Fib extensions for target hunting. Do your DD! You determine your risk tolerance. You are fully capable of making your own decisions.
BA: Back Adjusted
BuZ/BeZ: Bull Zone / Bear Zone
NZ: Neutral Zone

USDCHF short: Sellers Getting Ready to DominateAfter a strong impulse from buyers, we saw exhaustion near the highs. Price retraced to a major support zone, but instead of a strong bounce, we got a tight, controlled accumulation range.
the higher timeframe, i.e 4H is in a strong downmove
What’s interesting is the structure within that box: the breakout attempts are weak, volatility is contracting, and there’s a noticeable lack of bullish follow-through—just coiling.
Smart money doesn’t chase—they trap. This triangle near key support is exactly where larger players hide intentions behind "indecision." But to me, the silence screams. This doesn’t look like preparation for a markup—it feels like a setup for distribution under the disguise of consolidation.
I’m anticipating a sellers' takeover.
Entry Idea: Short on breakdown of triangle structure or on a faker as shown on the chart
Stop: Above false breakout wick
Target: Near 0.80408 (based on prior imbalance + clean levels below)
Risk-reward speaks for itself.
Let’s see if the tape reveals what I believe it’s been hiding in plain sight.

NQ Power Range Report with FIB Ext - 4/29/2025 SessionCME_MINI:NQM2025
- PR High: 19490.25
- PR Low: 19455.50
- NZ Spread: 77.75
Key scheduled economic events:
10:00 | CB Consumer Confidence
JOLTs Job Openings
Session Open Stats (As of 12:35 AM 4/29)
- Session Open ATR: 685.67
- Volume: 32K
- Open Int: 245K
- Trend Grade: Bear
- From BA ATH: -13.7% (Rounded)
Key Levels (Rounded - Think of these as ranges)
- Long: 20954
- Mid: 19246
- Short: 16963
Keep in mind this is not speculation or a prediction. Only a report of the Power Range with Fib extensions for target hunting. Do your DD! You determine your risk tolerance. You are fully capable of making your own decisions.
BA: Back Adjusted
BuZ/BeZ: Bull Zone / Bear Zone
NZ: Neutral Zone

Technical Analysis Indicators Cheat SheetHello, traders! 🦾
This cheat sheet provides a comprehensive overview of the most widely used technical analysis indicators. It is designed to support traders in analyzing trends, momentum, volatility, and volume.
Below, you’ll find a handy screenshot of this Cheat Sheet that you can save and peek at whenever you need a quick, friendly refresher on your trading indicators. ;)
1. Trend Indicators
These tools identify the direction and strength of price movements, critical for trend-following strategies.
Moving Averages (MA)
Simple Moving Average (SMA) and Exponential Moving Average (EMA) smooth price data to highlight trends. Crossovers (e.g., 50-day vs. 200-day MA) signal potential trend shifts.
MACD (Moving Average Convergence Divergence) – Tracks the difference between two EMAs, paired with a signal line to generate trade signals. A bullish crossover occurs when MACD rises above the signal line.
Parabolic SAR. Places dots above or below the price to indicate trend direction. Dots below the price suggest an uptrend; above, a downtrend.
ADX (Average Directional Index)
Measures trend strength (0–100). Values above 25 confirm a robust trend; below 20 indicate consolidation.
2. Momentum Indicators (Oscillators)
These indicators assess price movement speed and highlight overbought or oversold conditions.
RSI (Relative Strength Index)
Ranges from 0 to 100, with values above 70 indicating overbought conditions and below 30 indicating oversold. The divergence between the RSI and price can signal impending reversals.
Stochastic Oscillator –Compares closing price to the price range over a period (0–100). Above 80 is overbought; below 20, oversold. %K and %D line crossovers provide precise trade signals.
CCI (Commodity Channel Index) – Measures price deviation from its average. Readings above +100 indicate overbought; below -100, oversold.
Williams %R – Similar to Stochastic, it measures distance from the period’s high (0 to 100). Above -20 is overbought; below -80, oversold.
3. Volatility Indicators
These tools quantify price fluctuation ranges to optimize trade timing.
Bollinger Bands – Comprises a 20-day SMA and two bands (±2 standard deviations). Narrow bands reflect low volatility; wide bands indicate high volatility. A price touching the outer bands may signal a reversal or trend continuation, depending on the context.
ATR (Average True Range) – Calculates the average price range over a period to gauge volatility. Higher ATR values denote greater market movement.
4. Volume Indicators
Volume-based indicators validate price movements and highlight market participation.
OBV (On-Balance Volume) – Cumulates volume to confirm price trends. The rising OBV, alongside rising prices, supports an uptrend. OBV divergence from price may foreshadow reversals.
Volume Oscillator – Compares two volume moving averages to evaluate buying or selling pressure. Positive values suggest stronger buying. It typically confirms breakouts or assesses the sustainability of a trend.
Chaikin Money Flow (CMF) – It analyzes money flow based on price and volume. Positive CMF indicates buying pressure; negative, selling pressure.
5. Other Key Indicators. Advanced Tools for Deeper Market Analysis.
Ichimoku Cloud – Combines five lines and a “cloud” to assess trend, momentum, and support/resistance. Price above the cloud signals an uptrend; below, a downtrend. Cloud thickness reflects the strength of support or resistance levels.
Fibonacci Retracement – Maps potential support and resistance using Fibonacci ratios (23.6%, 38.2%, 50%, 61.8%).
Pivot Points – Derives support (S1, S2) and resistance (R1, R2) levels from the prior period’s high, low, and close.
Skills to Sharpen for Smarter Trading
Successful traders often find that combining indicators from different categories yields better results. For instance, pairing a trend-based EMA with a momentum indicator like RSI can help confirm signals more reliably — much like crafting the perfect coffee blend, where balance is everything.
Many also realize that stacking similar tools, such as using both RSI and Stochastic, tends to clutter the picture rather than clarify it. A focused set of indicators usually proves more effective.
Another common practice is backtesting setups on historical data to understand how strategies perform in specific markets and timeframes. It’s a way to rehearse before stepping onto the stage.
Ultimately, those who see consistent results tend to integrate indicators into a coherent strategy rather than reacting to every signal. That clarity often makes all the difference
Many of these indicators, from MACD to Bollinger Bands, are readily available on platforms like TradingView, making it easy to apply them to your charts.
Subscribe and let us know which of these indicators intrigues you the most so we can explore it further in our next post!
Good luck! 👏

NQ Power Range Report with FIB Ext - 4/25/2025 SessionCME_MINI:NQM2025
- PR High: 19427.00
- PR Low: 19352.25
- NZ Spread: 167.0
No key scheduled economic events
Wednesday session gap remains partially filled below 18595.00
- Auction lifting into supply above daily Keltner average
- Value hovering previous session high
Session Open Stats (As of 12:35 AM 4/25)
- Session Open ATR: 736.63
- Volume: 44K
- Open Int: 241K
- Trend Grade: Bear
- From BA ATH: -14.3% (Rounded)
Key Levels (Rounded - Think of these as ranges)
- Long: 20954
- Mid: 19246
- Short: 16963
Keep in mind this is not speculation or a prediction. Only a report of the Power Range with Fib extensions for target hunting. Do your DD! You determine your risk tolerance. You are fully capable of making your own decisions.
BA: Back Adjusted
BuZ/BeZ: Bull Zone / Bear Zone
NZ: Neutral Zone

NQ Power Range Report with FIB Ext - 4/24/2025 SessionCME_MINI:NQM2025
- PR High: 18842.25
- PR Low: 18740.50
- NZ Spread: 277.5
Key scheduled economic events:
08:30 | Initial Jobless Claims
- Durable Goods Orders
10:00 | Existing Home Sales
Previous session gap remains unfilled
- Advertising rotation inside daily Keltner average cloud
Session Open Stats (As of 12:45 AM 4/24)
- Session Open ATR: 734.74
- Volume: 36K
- Open Int: 238K
- Trend Grade: Bear
- From BA ATH: -17.0% (Rounded)
Key Levels (Rounded - Think of these as ranges)
- Long: 20954
- Mid: 19246
- Short: 16963
Keep in mind this is not speculation or a prediction. Only a report of the Power Range with Fib extensions for target hunting. Do your DD! You determine your risk tolerance. You are fully capable of making your own decisions.
BA: Back Adjusted
BuZ/BeZ: Bull Zone / Bear Zone
NZ: Neutral Zone

NQ Power Range Report with FIB Ext - 4/23/2025 SessionCME_MINI:NQM2025
- PR High: 18771.75
- PR Low: 18644.00
- NZ Spread: 285.75
Key scheduled economic events:
09:45 | S&P Global Manufacturing PMI
- S&P Global Services PMI
10:00 | New Home Sales
10:30 | Crude Inventories
Major +1.5% session gap, unfilled to 18400
Session Open Stats (As of 12:15 AM 4/23)
- Session Open ATR: 752.66
- Volume: 58K
- Open Int: 241K
- Trend Grade: Bear
- From BA ATH: -17.4% (Rounded)
Key Levels (Rounded - Think of these as ranges)
- Long: 20954
- Mid: 19246
- Short: 16963
Keep in mind this is not speculation or a prediction. Only a report of the Power Range with Fib extensions for target hunting. Do your DD! You determine your risk tolerance. You are fully capable of making your own decisions.
BA: Back Adjusted
BuZ/BeZ: Bull Zone / Bear Zone
NZ: Neutral Zone

[04/22] 𝟬𝗗𝗧𝗘 𝗦𝗣𝗫 𝗚𝗘𝗫 𝗥𝗲𝘃𝗶𝗲𝘄Contextual Thinking:
Yesterday’s sharp drop was fully bought back — for now. We're currently at a call resistance level, so the down move may continue today.
Gameplay:
Below 5205, I lean towards being cautious or outright bearish. A hypothetical selloff could intensify below 5170 (Gamma Flip level).
I'm definitely not targeting below 5100, but based on the current options pricing, the market seems to be pricing in 5100 — yesterday’s low — as the most pessimistic scenario.
Caution:
Given the significant intraday swings over the past 24 hours (both up and down), the market is likely to close somewhere between the high and low of the day due to ongoing uncertainty. This is typical in such volatile conditions, and I see this as the most probable outcome.
So unless strong buying pressure or good news emerges, I expect the market to close between 5100 and 5205.
However, if we break above 5205, we could witness a positive gamma squeeze , with 5250 being the first upside target.

US 100 Index - Is 17404/749 Support Important?As European traders return from their extended Easter break they turn on their screens to find US assets back under pressure. The US 100 index dropped 2.2% yesterday to close at 17779, which included a late rally from a mid session low at 17570.
These moves are potentially reflecting a growing unease around numerous important issues, including, a lack of progress in trade talks with US allies, US economic growth concerns and President Trump's on-going challenge to Federal Reserve independence.
Looking forward, US 100 traders have a lot to focus on this week, Tesla reports its earnings after the close tonight, against a backdrop of weekend news reports which suggested it may be about to delay production of cheaper EVs. That aside, investors may also be focused on sales projections for 2025, autonomous driving plans and the impact of tariffs on the company's profitability.
It may well be a similar story when Alphabet reports its earnings after the close on Thursday.
Throw in the latest April Preliminary PMI Survey releases on Wednesday from the developed economies, which could well start to show the impact of tariffs on growth, business sentiment and inflation, and it is possible that the recent US 100 index volatility could continue across the week.
Technical Update: Could Potential Support at 17404/17749 Be Important?
As impressive as the 18% recovery in the US 100 index from the April 7th 2025 low to the April 10th 2025 high (16290 up to 19222) appeared, after the latest price weakness, this upside may prove to be a limited reactive move, although further confirmation may still be required.
As the chart above shows, the latest upside strength saw the index back to what some traders may have viewed as an important resistance, marked by a combination of the declining Bollinger mid-average (18992 at the time) and the 50% Fibonacci retracement of the February 18th 2025 to April 7th 2025 weakness, which stands at 19258.
With the latest price activity seeing weakness materialise again, it might now be suggested
this potential resistance range remains the important focus on the topside, although much will depend on future market sentiment and price trends.
With this in mind, what are the potential supports we might wish to monitor, to help us gauge how much further the current weakness may have to carry?
Possible Support Levels:
Fibonacci retracements can offer an insight into potential support zones, with them possibly able to hold, even reverse price weakness back to the upside. Therefore, 17404/17749, which is equal to the 50% and 61.8% Fibonacci retracements of the April price strength, maybe an area traders are currently focusing on.
However, there could still be potential for a further period of price weakness if this 17404/17749 range is broken on a closing basis. In that case, the next support may well then be represented by the April 7th 2025 session low at 16290, possibly further, if this in turn gives way.
Possible Resistance Levels:
The 17404/17749 support range is still intact, and while this remains the case on a closing basis, attempts at price strength could still be seen. However, with the declining Bollinger mid-average currently at 18648 and having recently seen it reverse attempts at price strength, closing breaks above this level might be required to trigger a more extended phase of strength.
That said, as proved the case in early April, 19258, the 50% Fibonacci retracement level, may also now need to give way on a closing basis, to suggest further attempts to develop price strength towards higher resistance levels.
The material provided here has not been prepared in accordance with legal requirements designed to promote the independence of investment research and as such is considered to be a marketing communication. Whilst it is not subject to any prohibition on dealing ahead of the dissemination of investment research, we will not seek to take any advantage before providing it to our clients.
Pepperstone doesn’t represent that the material provided here is accurate, current or complete, and therefore shouldn’t be relied upon as such. The information, whether from a third party or not, isn’t to be considered as a recommendation; or an offer to buy or sell; or the solicitation of an offer to buy or sell any security, financial product or instrument; or to participate in any particular trading strategy. It does not take into account readers’ financial situation or investment objectives. We advise any readers of this content to seek their own advice. Without the approval of Pepperstone, reproduction or redistribution of this information isn’t permitted.

NQ Power Range Report with FIB Ext - 4/22/2025 SessionCME_MINI:NQM2025
- PR High: 17934.25
- PR Low: 17863.75
- NZ Spread: 157.5
No key scheduled economic events
Rollover to 17700 inventory
- Responding above previous session close, beginning inside print
Session Open Stats (As of 12:45 AM 4/22)
- Session Open ATR: 744.58
- Volume: 42K
- Open Int: 242K
- Trend Grade: Bear
- From BA ATH: -20.6% (Rounded)
Key Levels (Rounded - Think of these as ranges)
- Long: 20954
- Mid: 19246
- Short: 16963
Keep in mind this is not speculation or a prediction. Only a report of the Power Range with Fib extensions for target hunting. Do your DD! You determine your risk tolerance. You are fully capable of making your own decisions.
BA: Back Adjusted
BuZ/BeZ: Bull Zone / Bear Zone
NZ: Neutral Zone

TRG, Buy Opportunity is coming up !Buy once price closes above BB50
Price target1: 92.59
Price Target2: 150

VXX shortVIX above regular range
After SPY quick down, VIX is high, there might be sideway consolidation.
Long entry 76
no Stop ,
Target 40
Risk management is much more important than a good entry point.
I am not a PRO trader.
In my trading plan, the Max Risk of each short term trade should be less than 1% of an account.

Weekly plan for SolanaMarked the important levels in this video for this week and considered a few scenarios of price performance
I would like to see price support at the 130 level
Write a comment with your coins & hit the like button, and I will make an analysis for you
The author's opinion may differ from yours,
Consider your risks.
Wish you successful trades! MURA
