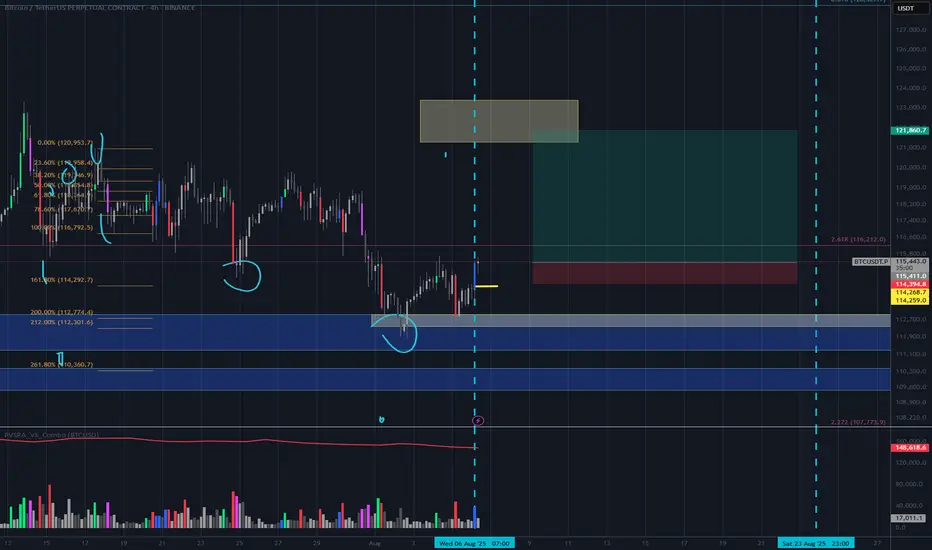
BTC long with stop lossA leg of our strategy says price will return to broken threshold candle price levels. Meaning the corresponding price candle to the volulme bar that broke threshold will have price back within that candles open and close range; at some point in time. Things get kind of shaky below 15minute with my script but nonethe less we will use our stop loss just below the candles open at 114268. yellow line
Volume
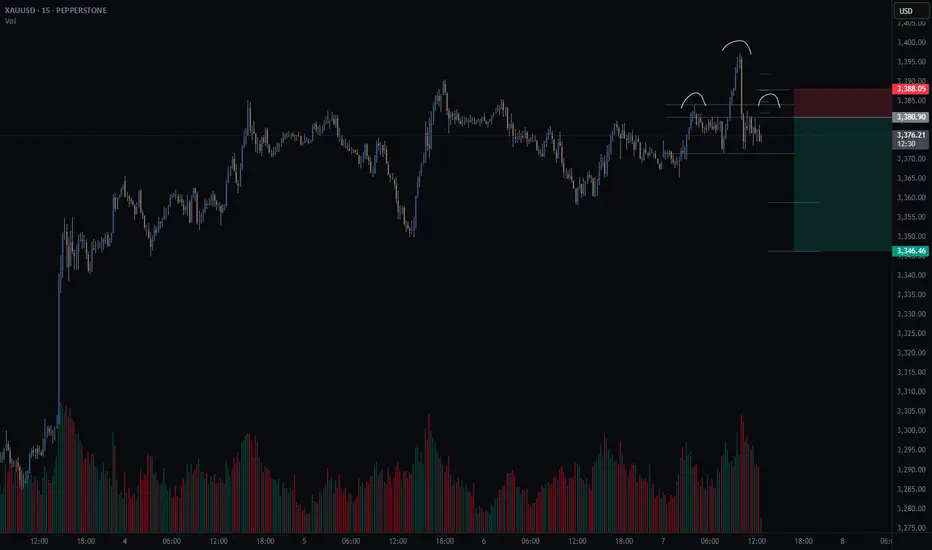
Gold short – Head and Shoulders Setting Up on 15min?There’s a potential head and shoulders pattern forming on the 15-minute chart.
📌 What I’m watching for:
A 15min candle close back inside the neckline range
Lower volume on the right shoulder vs. the left (to confirm weakening momentum)
🧠 Trade Idea (Short bias)
🎯 Entry: 3380.9
❌ Stop Loss: 3388.0
✅ Take Profit 1 (50%): 3358.9
✅ Take Profit 2 (50%): 3346.3
⚖️ Risk/Reward: 3.8R
This setup lines up with my trading method that focuses on structure, volume, and clean risk/reward.
🤔 What are your thoughts on gold today?
Are we about to roll over — or will bulls push through resistance?
ETH: LIVE TRADEHello friends🙌
✅Given the good rise we had, we had a small correction that was a buying opportunity and there is another support area where we can buy the second step in case of further correction.
We have also specified targets for you, be careful and do not act emotionally and observe capital and risk management.
🔥Follow us for more signals🔥
*Trade safely with us*

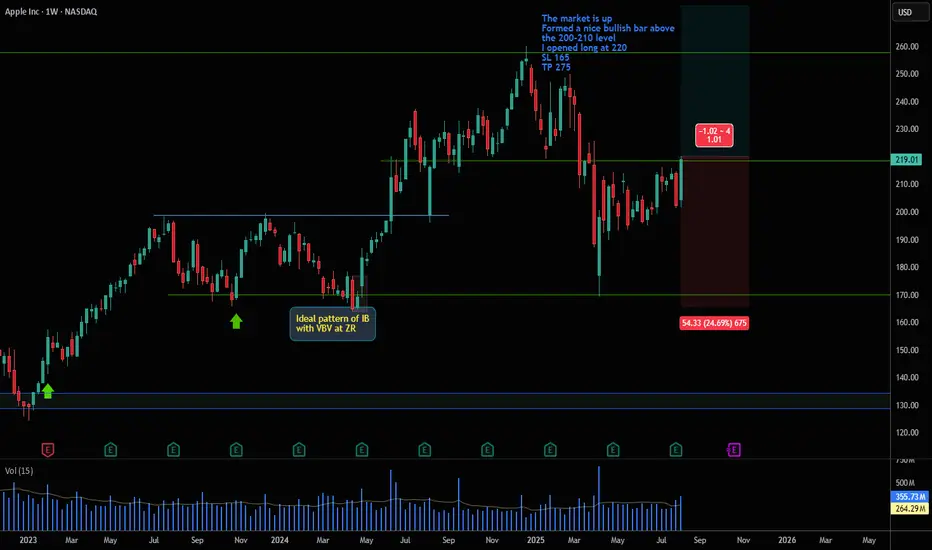
Buy Apple at the break of 200-210 levelI opened long at the BRO the level 200-210
by a strong bullish bar
with a very good Volume and after the EPS
this market is in up trend
Long at 220
SL 165
TO 275
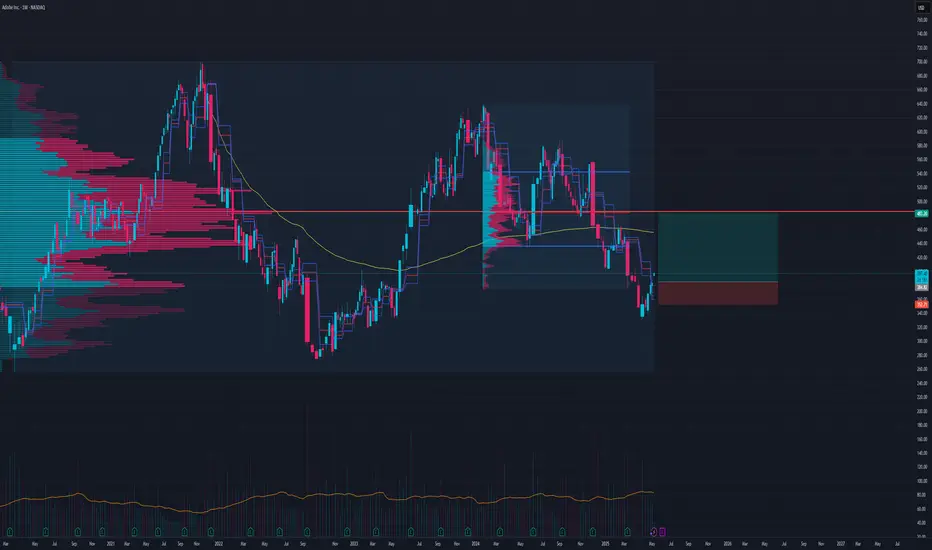
ADBE Swing Long Possible Long Trade Around Here
Entry around 385 or a bit higher
TP1 435
TP2 450
TP3 479
Stop loss at 352
ZETA: when a wedge isn’t just a wedge — it’s a launchpadTechnically, this setup is textbook clean. Price completed the fifth wave within a falling wedge and instantly reacted with a bullish breakout. The expected breakdown didn’t happen — instead, buyers stepped in, confirmed by rising volume. All EMAs are compressed at the bottom of the structure, signaling a clear shift in momentum. The volume profile shows strong accumulation around $14, while the area above current levels is a vacuum — ideal conditions for acceleration.
The key resistance zone is $16.70–17.20 — former base highs and the 0.236 Fibonacci retracement. If price breaks this area with volume, the next stop is likely $24.48 (0.5 Fibo). Classical wedge targets land at $38.28 and $55.33 (1.272 and 1.618 extensions). If a trending leg begins, it could move fast — because there’s simply no supply overhead.
Fundamentals:
ZETA isn’t a profitable company yet, but it shows consistent revenue growth and aggressive expansion. Capitalization is rising, debt is manageable, and institutional interest has increased over recent quarters. In an environment where tech and AI are regaining momentum, ZETA could be a speculative second-tier breakout candidate.
Tactical plan:
— Entry: market or after a retest of $14.00–14.30
— First target: $17.20
— Main target: $24.48
— Continuation: $38.28+
— Stop: below $13.00 (bottom wedge boundary)
When the market prints a wedge like this and the crowd ignores it — that’s often the best trap setup. Only this time, it’s not for retail buyers. It’s for the shorts. Because when a falling wedge breaks to the upside with volume — it’s time to buckle up.

GBPUSD 4H: retest done - bearish continuation beginsOn the 4H chart, GBPUSD has completed a textbook head and shoulders pattern. The neckline has already been broken, and the price is now finalizing a retest around 1.3365–1.3380, where the 0.5 Fibo level also lies. This confirms a trend reversal, with the market preparing for the next leg down.
MA and EMA are above the current price, adding pressure to the downside. RSI remains neutral, and volume is shifting in favor of bears. The key resistance zone at 1.3365 has been tested from below, and the price is beginning to roll over - a classic bearish continuation signal.
Targets: 1.3240 first, then 1.3150 and potentially 1.2 870 if momentum builds. The invalidation point is a close above 1.3365, which is not likely at this stage.
Fundamentals support the move: the dollar remains strong as the Fed holds its hawkish stance, while the UK economy continues to show weakness across services and manufacturing.
Neckline broken ✅
Retest done ✅
Momentum building ✅
The setup is complete — time to follow the structure.

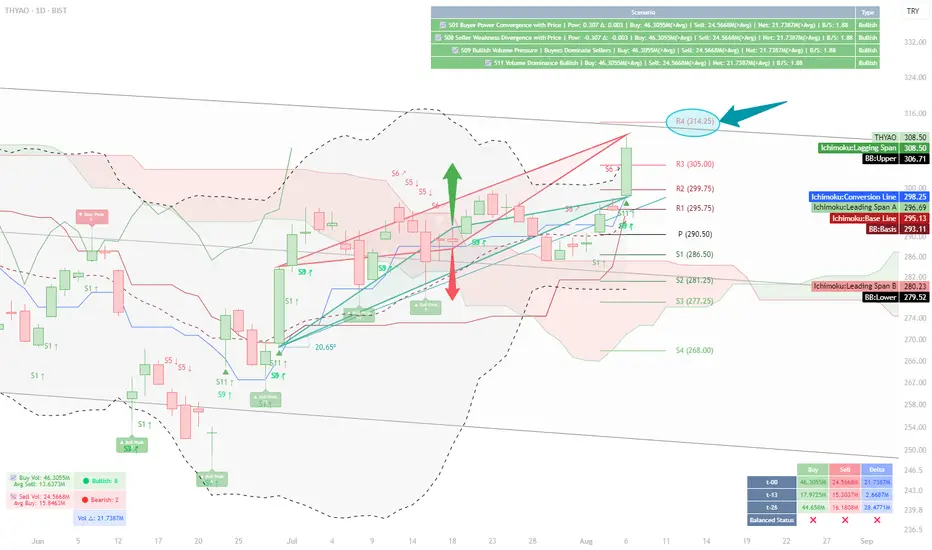
Volume and Structural Analysis of THYAO — Reaching Resistance at📝 Analysis:
My initial focus in this chart was on the daily buy and sell volumes.
According to the table displayed at the bottom of the chart for August 6th:
Buy Volume (t-0): 46.305M
Sell Volume (t-0): 24.566M
These values show a clear increase compared to previous checkpoints (t-13 and t-26).
Notably, the buy volume is 28.3M higher than t-13 and about 1.6M higher than t-26.
This gives us a broader picture: buying strength remains dominant, even though delta volume has not surpassed its value at t-26 (still about 7M short). Nevertheless, the current volume levels show stronger positioning compared to the mid-term past.
On the upper-right side of the chart, four system-based scenarios have been triggered via our custom indicator:
✅ Scenario 01 – Buyer Power Convergence with Price
✅ Scenario 08 – Seller Weakness Divergence
✅ Scenario 09 – Bullish Volume Pressure
✅ Scenario 11 – Volume Dominance Bullish
Together, they present a market that is tilting in favor of the buyers, with bullish sentiment supported by volume structure.
Next, my attention shifts to the triangle formations on the chart, which were automatically plotted based on cross high/low logic.
🔺 The green ascending triangle, with a slope of 20.65°, indicates a healthy and steady bullish structure.
Its top has not yet reached the resistance zone, where the red triangle forms a descending structure aligned with the R4 level at 314.25.
Beyond the technical interpretation, I also look at triangles symbolically.
Throughout history, from the Seal of Solomon (Star of David) to the Egyptian pyramids, triangles have represented stability, energy focus, and a path upward.
In this chart, that symbolism holds true — the green triangle embodies a progressive, rising support, while the red triangle offers a calculated obstacle.
What’s intriguing is the parallel structure of the triangle bases — suggesting a balanced energy field, ready to be tipped by momentum.
📊 When combined with other indicators:
Price is above the red Ichimoku cloud
It sits in the upper zone of the regression channel
Bollinger Bands show an upward breakout bias
Daily pivot levels align with this structure, and the R4 level (314.25) becomes a relevant resistance to monitor
📍 Conclusion:
Given the alignment of structural elements and volume behavior,
a move toward the resistance at 314.25 is well within reach under current market dynamics.
⚠️ This analysis is based on a custom-built indicator named Volume Based Analysis V 1.4+ and is provided strictly for educational and analytical purposes.
No investment or trading advice is intended.
👥 I welcome your interpretations and experiences —
Do you also see 314.25 as a realistic target?
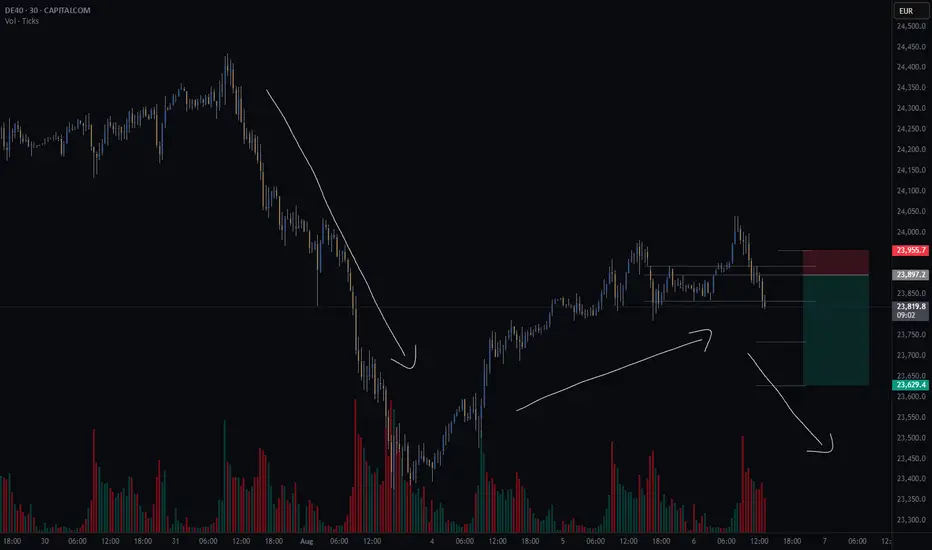
GER40CASH (DE40) - potential short - HSThere is a potential head and shoulders continuation pattern.
What I like about this setup is the GER40 is potentially creating a bear flag.
Finding a continuation pattern within the bear flag, like the head and shoulders, is a great entry point for the second part of the downward move.
Still waiting for my system to confirm some variables before I take the trade.
Risk/reward = 4.3
Entry price = 23 905.3
Stop loss price = 23 955.4
Take profit level 1 (50%) = 23 733
Take profit level 2 (50%) = 23 628
USD/CHF Analysis Based on Volume, Fibonacci & Stochastic
This USD/CHF trade idea is based on:
Volume profile analysis to identify key price zones
Fibonacci retracement levels to confirm technical structure
Stochastic indicator to refine entry timing
🔹 Entry: 0.8078
🔹 Stop-Loss: 0.8069
🔹 Take-Profit: 0.8097
🔹 Risk-to-Reward Ratio: 1.00
⚠️ Disclaimer: This setup is shared for educational purposes only. It does not constitute financial advice. Always apply strict risk management.

Possible run to 130 in the cardsEasily invalidated.
We are using the patterns from the price action post threshold break (redline in bottom pane)
These breaks are unseen on this time frame
The volume instabilities are between the 15 minute and the 1 hour. I would look for breaks under 15 minutes, too much noise at that level. Go ahead and test it yourself. See my script posted on trading view for details.

EUR/USD Analysis Based on Volume, Fibonacci & Stochastic
This EUR/USD trade setup is structured using:
Volume analysis to locate key activity zones
Fibonacci retracement for confluence
Stochastic indicator to refine the timing of entry
🔹 Entry: 1.1546
🔹 Stop-Loss: 1.1588
🔹 Take-Profit: 1.1506
🔹 Risk-to-Reward Ratio: 1.02
⚠️ Disclaimer: This analysis is for educational purposes only and is not financial advice. Always manage your risk and trade responsibly.

OKLO — when nuclear momentum breaks resistanceSince late 2024, OKLO had been consolidating inside a clear rectangle between $17 and $59. The breakout from this long-term range triggered a new bullish impulse. The price has since returned to retest the breakout zone, now aligned with the 0.618 Fibonacci retracement at $51.94. The retest has completed, and the price is bouncing upward, confirming buyer interest.
Technically, the trend remains firmly bullish. The price closed above the prior range, EMAs are aligned below, and the volume spike during breakout supports genuine demand. The volume profile shows a clean path toward $100, indicating limited resistance ahead. The structure suggests a controlled rally rather than an exhausted move.
Fundamentally, OKLO is a next-generation SMR (Small Modular Reactor) company focused on delivering compact, efficient nuclear power solutions. Following its public debut via SPAC and recent capital injection, OKLO is transitioning from development to implementation. Institutional interest is holding strong, and the broader move toward decarbonization and energy independence places the company in a strategic position.
Target levels:
— First target: $100 — psychological and technical resistance
— Second target: $143 — projected from prior range breakout
OKLO isn’t just another clean energy ticker — it’s a quiet disruptor with nuclear potential. The chart broke out. The volume confirmed. Now it’s time to see if the market follows through.

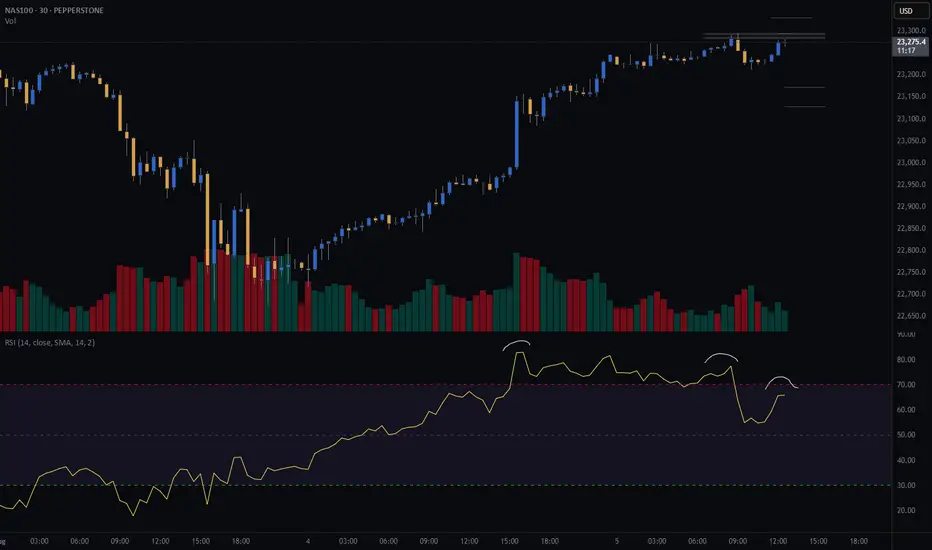
NAS100 (CASH100) Short - Double top 30minThe 15min head and shoulders setup got invalidated.
However, my double top variables are currently being met.
Still need confirmation before entering trade.
Risk/reward = 2.7
Entry price = 23 284
Stop loss price = 23 331
Take profit level 1 (50%) = 23 173
Take profit level 2 (50%) = 23 129
What does everyone thing the NASDAQ is going to do today?
AUD/USD Analysis Based on Volume, Fibonacci & Stochastic
This AUD/USD setup is based on:
Volume Profile zones to detect institutional interest
Fibonacci levels for structural confirmation
Stochastic oscillator to time the entry more accurately
🔹 Entry: 0.6460
🔹 Stop-Loss: 0.6476
🔹 Take-Profit: 0.6441
🔹 Risk-to-Reward Ratio: 1.19
⚠️ Disclaimer: This analysis is for educational purposes only and does not constitute financial advice. Always do your own due diligence and manage risk appropriately.

USD/CHFThis USD/CHF setup is based on:
Volume profile analysis to identify key liquidity zones
Fibonacci levels for structural confirmation
Stochastic oscillator to refine entry precision
🔹 Entry: 0.8105
🔹 Take-Profit: 0.8139
🔹 Stop-Loss: 0.8080
🔹 Risk-to-Reward Ratio: 1.38
⚠️ Disclaimer: This analysis is for educational purposes only and should not be considered financial advice. Always use proper risk management.

NZD/USD Analysis Based on Volume, Fibonacci & Stochastic
This NZD/USD setup is developed using:
Volume analysis to highlight market participation zones
Fibonacci levels to confirm technical structure
Stochastic indicator to find precise entry timing
🔹 Entry: 0.5892
🔹 Take-Profit: 0.5864
🔹 Stop-Loss: 0.5909
🔹 Risk-to-Reward Ratio: 1.64
⚠️ Disclaimer: This analysis is for educational purposes only and is not financial advice. Always trade with proper risk management.

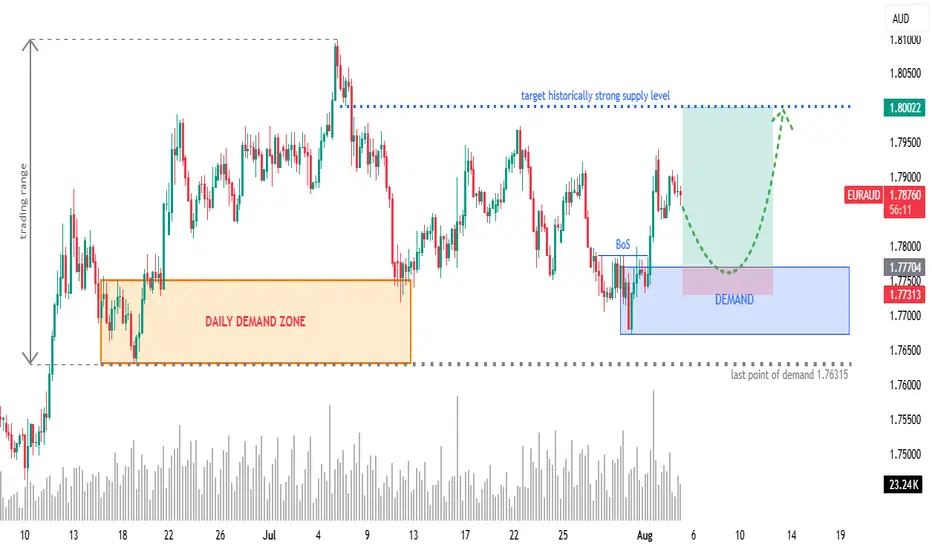
EURAUD 4H: Long Setup from Fresh Demand ZoneOverview:
OANDA:EURAUD retracing into a newly formed 4H demand zone after a bullish Break of Structure (BoS). Eyes on continuation towards a historically significant supply zone at 1.8000.
🧩 Setup Details
• Asset & Timeframe: EURAUD, 4H
• Bias: Bullish
• Entry Zone: 1.77300 – 1.77700 (DEMAND area)
• Targets:
🎯 T1 = 1.7900 (minor reaction level)
🎯 T2 = 1.8000 (historical supply level)
• Stop-Loss: Below 1.77300 (last valid demand)
• Risk-Reward: Approx. 1:6+
🧠 Why Now? (Trade Rationale)
• ✅ Fresh 4H Demand Zone: Price is retracing into a clear demand zone after rejecting lower prices.
• ✅ Break of Structure (BoS): Bullish BoS confirms shift in order flow.
• ✅ Volume Confirmation: Increasing demand near current price levels.
• ✅ Clear Liquidity Sweep: Price likely swept short-term lows before BoS.
• ✅ Target Supply Zone: 1.8000 is a well-respected historical supply/resistance level — clean magnet for price.
⏱ Multi-Timeframe Context
• Daily Chart: Price is reacting off a larger DAILY DEMAND ZONE. Trend bias is bullish.
• 4H Chart: Structure break + demand formation suggest continuation.
• 1H/Entry Level: Monitor price action in the blue zone for lower-timeframe confirmation (e.g. bullish engulfing, flip zones, LQ sweep, etc.) and potentially greater risk-reward.
📉 Risk Management & Duration
• Stop below 1.76315 keeps you protected from deeper invalidation.
• Trade Duration: Short to mid-term (1–4 days).
• Position Size: Scale based on volatility; ideal for swing trade conditions.
📌 Trade Plan Summary
📍 Watch for bullish PA on re-entry into demand (1.77300–1.77700)
📍 Set SL below 1.76315
📍 TP1 at 1.79000 — partials advised
📍 TP2 at 1.80000 — strong historical level
📍 Adjust SL to BE on momentum breakout
GBP/USD Analysis Based on Volume, Fibonacci & Stochastic
This GBP/USD setup is built on:
Volume Analysis to detect strong price areas
Fibonacci retracement to identify key support/resistance
Stochastic oscillator to find a better-timed entry
🔹 Entry: 1.3270
🔹 Stop-Loss: 1.3298
🔹 Take-Profit: 1.3239
🔹 Risk-to-Reward Ratio: 1.14
⚠️ Disclaimer: This analysis is for educational purposes only and does not constitute financial advice. Please do your own research and manage your risk properly before trading.

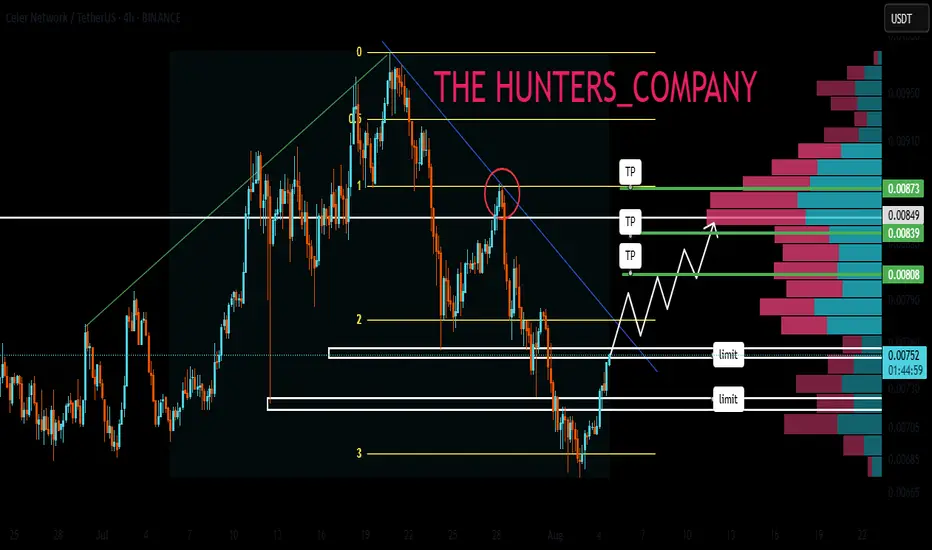
CELR : Sensitive areaHello friends🙌
✅Considering the decline we had, you can see that the price has been well supported in the support area drawn with Fibonacci and now it seems that it wants to go up to the specified ranges, which are also good and high-volume ranges, and these areas are like magnets for the price.
✅Don't forget risk and capital management.
🔥Follow us for more signals🔥
*Trade safely with us*
USD/CHFThis trade setup is based on volume analysis, Fibonacci retracement zones, and confirmation from the Stochastic oscillator to determine a strong long entry. The setup suggests a potential bullish move with favorable risk conditions.
Entry: 0.8082 area
Stop-Loss: 0.8044 area
Take-Profit: 0.8130 area
Risk-to-Reward Ratio: ~1:1.5
This idea capitalizes on a bounce from a key Fibonacci support level, where volume and momentum indicate buyer strength and trend continuation potential.
⚠️ Disclaimer:
This is not financial advice. Trading involves risk and may not be suitable for all investors. Always do your own research and apply proper risk management.

GBP/USD This trade is based on a combination of volume analysis, Fibonacci retracement levels, and signals from the Stochastic oscillator to identify a favorable long entry. The setup indicates a potential bullish continuation, supported by increasing volume and a shift in momentum.
Entry: 1.3293 area
Stop-Loss: 1.3269 area
Take-Profit: 1.3333 area
Risk-to-Reward Ratio: ~1:2.0
This setup targets a continuation of the upward move, with price reacting positively at a key Fibonacci zone and momentum confirming with a bullish signal from the Stochastic.
⚠️ Disclaimer:
This is not financial advice. Trading involves risk and may not be suitable for all investors. Always conduct your own analysis and use proper risk management.

AUD/USDThis analysis is based on a combination of volume analysis, Fibonacci retracement levels, and Stochastic oscillator signals to find an optimal entry point. The trade setup suggests a potential bullish move after confirming support and momentum alignment.
Entry: 0.6475 area
Stop-Loss: 0.6465 area
Take-Profit: 0.6498 area
This setup aims to capitalize on a high-probability bounce within a key Fibonacci zone, confirmed by volume strength and oversold readings on the Stochastic indicator.
⚠️ Disclaimer:
This is not financial advice. Trading involves risk and may not be suitable for all investors. Always do your own research and use proper risk management.
