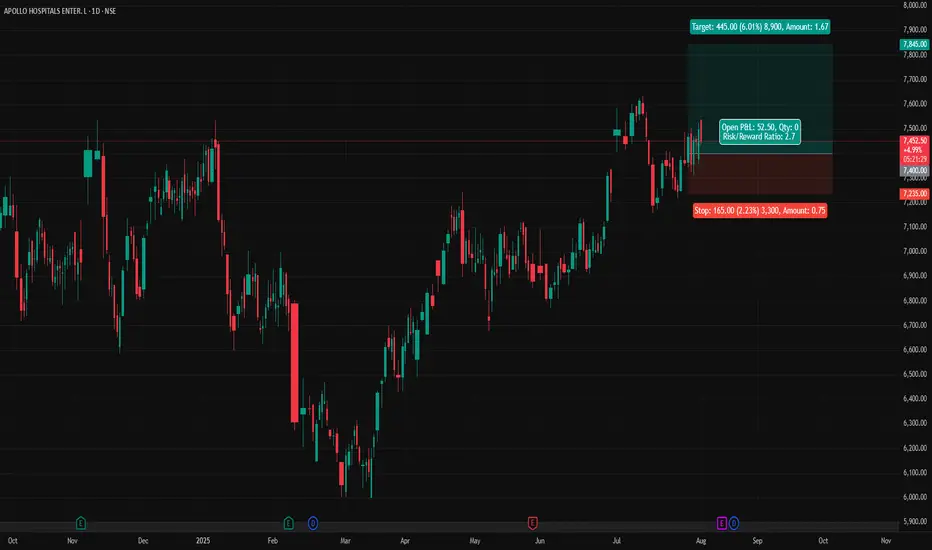
APOLLOHOSP - Apollo Hospitals (Daily chart, NSE) - Long PositionAPOLLOHOSP - Apollo Hospitals Enterprise Ltd. (Daily chart, NSE) - Long Position
Risk assessment: Medium {support structure integrity risk}
Risk/Reward ratio ~ 2.7
Current Market Price (CMP) ~ 7450
Entry limit ~ 7400 on Aug. 01, 2025
Target limit ~ 7845 (+6.01%; +445 points)
Stop order limit ~ 7235 (-2.23%; -165 points)
Disclaimer: Investments in securities markets are subject to market risks. All information presented in this group is strictly for reference and personal study purposes only and is not a recommendation and/or a solicitation to act upon under any interpretation of the letter.
LEGEND:
{curly brackets} = observation notes
= important updates
(parentheses) = information details
~ tilde/approximation = variable value
-hyphen = fixed value
Volume
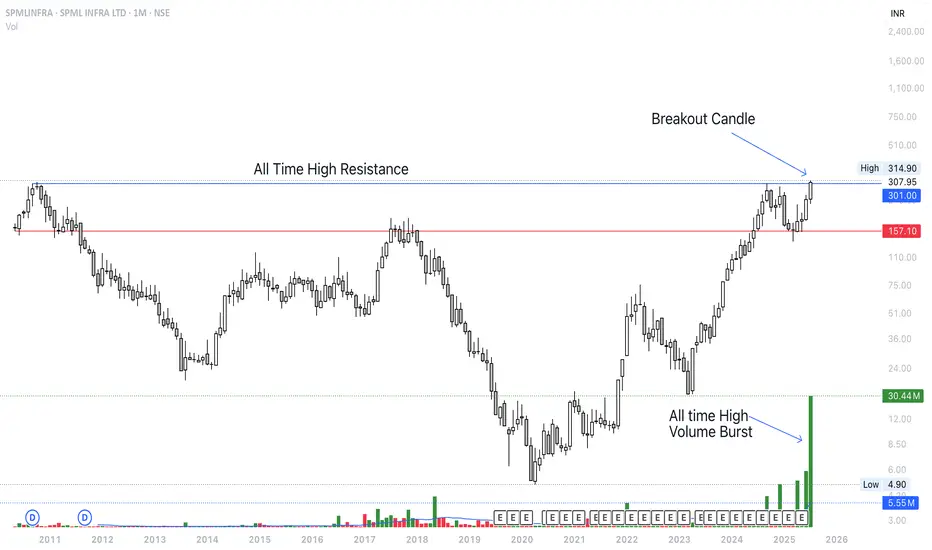
Breakout Soon <> SPMLINFRAStock is pushing above All time High resistance level. Keeping on radar. It would have been solid breakout if the Monthly closing was above 310 level. Volume also supporting the level. Recently realty sector rally also supporting.
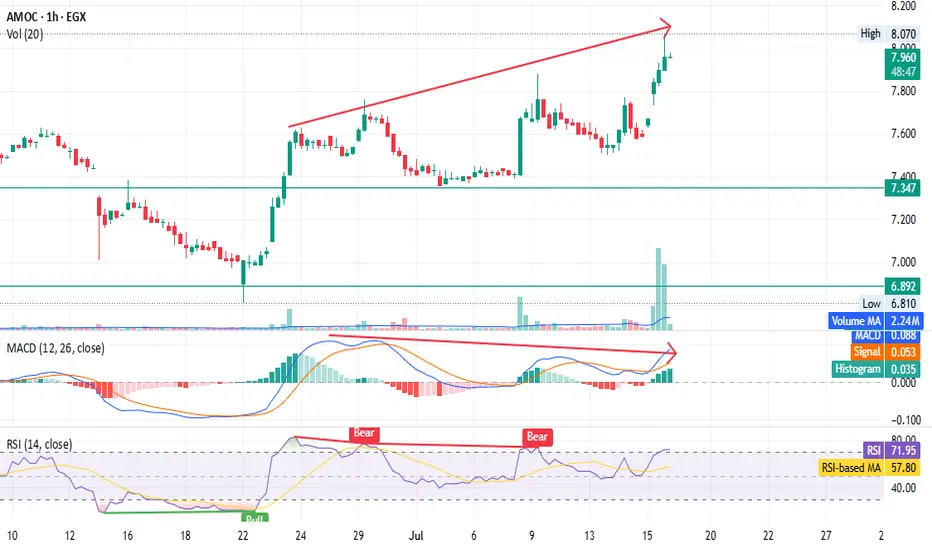
AMOC - Beware of the bear trap - only for shareholders EGX:AMOC timeframe: 1 hour
Prices continue to rise, forming a higher top than the previous one,
but MACD shows a negative divergence.
RSI indicates bearish dominance despite the price increase.
High volume with a gap, unsupported by other indicators, suggests possible distribution.
Stop loss (profit-saving) at 7.62.
This is not financial advice, just our analysis based on chart data. Consult your account manager before investing.
Thanks and good luck!
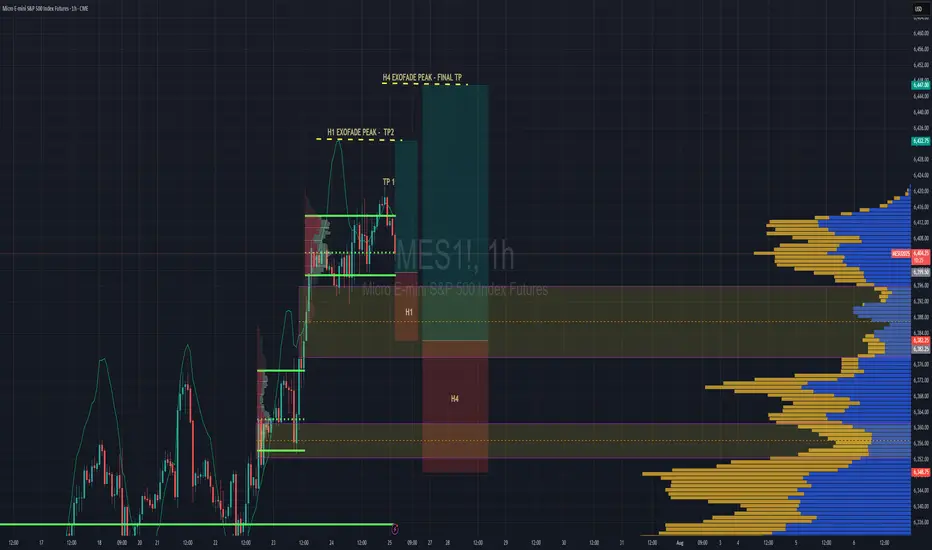
S&P 500 Intraday & Swing Entries H1 entry is close to getting activated for intraday.
If you want a swing trade then wait for H4 entry (you might be waiting a while obviously)
Reason for entries - We have broken out of Balance since July 25th and currently in a trend phase until we establish a new value area, or return to the one we broke out from.
So since Trend and Momentum is UP, then we should find Low Volume Areas to enter in the direction of the trend for a classic pullback entry trade.

$LINK – VAH RejectionKeeping an eye on this one. Watching the rejection off VAH — I’d consider laddering in around the POC and VAL. We've also got confluence with an anchored VWAP, GP, and a monthly order block in play.

MSTR Holding VWAP Support – Reversal Attempt but Earnings AheadMSTR bounced nearly 2% today after testing anchored VWAP support near $390. This recovery comes after a steady pullback from the recent $460 high. Price is holding above the yellow VWAP and just above the green zone, signaling possible short-term support.
However, volume remains light (3.72M vs. 11.47M average), indicating cautious buying — and earnings are scheduled for tomorrow, which introduces added volatility risk. A close above $410 post-earnings would strengthen the bullish case.
Until then, this remains a speculative long setup with event risk.
Indicators used:
Anchored VWAP (support zone: $390–395)
Volume vs. Volume MA (light = indecision)
Earnings date = risk trigger
Entry idea: Only after earnings reaction; ideally above $410
Target: $430–440
Stop: Below $388 or earnings miss

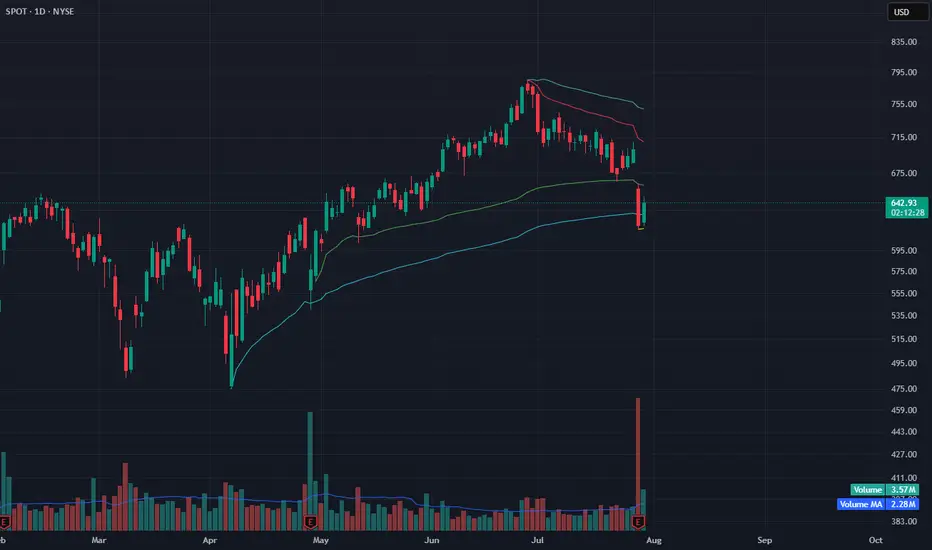
SPOT Reversing at VWAP Support – Signs of Seller ExhaustionAfter a sharp drop, SPOT is showing early signs of reversal at a key anchored VWAP support zone. The intraday bounce occurred on low volume, which may indicate seller exhaustion rather than aggressive dip-buying.
Price is holding near the blue VWAP anchored from the April low, a level that previously acted as dynamic support. Although today’s bounce lacks volume strength (3.53M vs. 2.28M MA), the selling pressure appears to be cooling off.
If SPOT can reclaim $665–670 in the coming sessions with improving volume, a recovery toward $700+ is possible. However, failure to hold above $640 may resume downside momentum.
Indicators used:
Anchored VWAP (support holding from prior pivot)
Volume (low, signaling possible seller fatigue)
Price structure (early reversal after steep correction)
Entry idea: Watch for reclaim of $665
Target: $700–715
Stop: Below $638 or new low
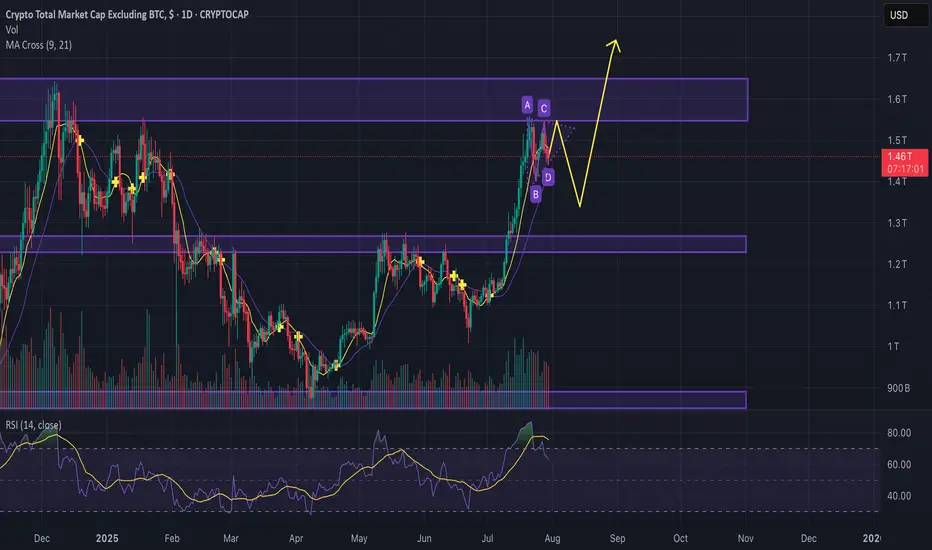
Is altcoin season over before it even started?Guys,
Gonna break down the situation on the chart to see where we can go next with the altcoins.
We see the key resistance levels and now we moving in kinda bullish pennant, but considering descending volumes we can easily test the support line and go back to the 1.25T. (maybe even lower)
After that, seems like we can try to go back and break the 1.64T resistance zone and previous ATH.
Anyway current market is going to be way more different from previous cycles, because huge institutions can feel nice only in hyper volatile, so divide your strategy between short, mid and long term investments to take profits.
Good trades and share your thoughts down to see what others think.
EUR USD long As the EUR treaty yesterday gave strength to the USD and "made America great again," today we’re seeing a correction. This setup is based on a value gap—if price breaks through this gap, there's a strong chance it will reach the next zone quickly. A buy setup could be effective in this scenario.
Disclaimer: This analysis is for educational purposes only and does not constitute financial advice. Always do your own research before making any trading decisions.

Pattern detection bitcoinusing hourly btc analysis we can breakdown this move and its time cycles
pvsra volume threshold breaks indicating price instability allows us to break down these moves starting point
present
past pattern repeating
barpattern-overlay
EVER LongIf we get a pull back this is a pretty good risk reward, but it will probably break this range and head towards 33$
SL at 23.74
AMD - Will Buyers Show Up at Longterm VAL???With the markets getting oversold, does AMD, who has been in a long downtrend, finally find buyers at its longterm VAL? This is the area to see if buyers finally show up in my opinion.

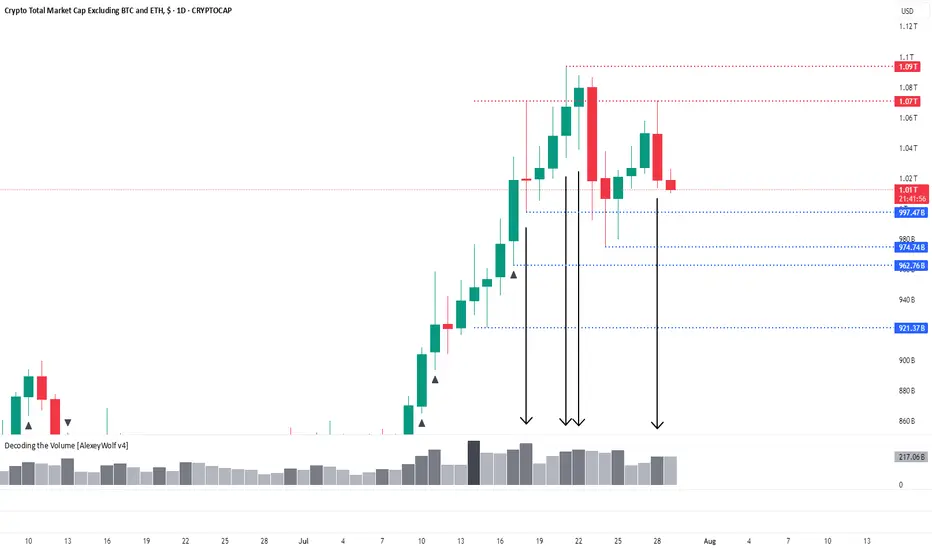
Total3: Fourth Interaction with 1.07 LevelHi traders and investors!
The altcoin market capitalization (Total3) is interacting with the 1.07T level for the fourth time — and once again, on increased volume. Yesterday’s price action formed a bearish candle after touching this level — a clear seller’s candle.
We’re now watching the 997.47B level closely. A reaction from this level could trigger a reversal in altcoins, with buyers potentially regaining initiative.
Since the last outlook, a new level has appeared at 974.74B — this could also serve as a strong support area and trigger a buyer response, aiming for a retest of the local high at 1.09T.
👉 If no bullish reaction follows at 997.47B, attention shifts to 974.74B.
👉 If that level also fails to hold, we return to the previously mentioned support zone between 921B and 963B — the optimal correction range for a potential new ATH scenario.
This analysis is based on the Initiative Analysis concept (IA).
Wishing you profitable trades!
$BTC Daily OutlookBINANCE:BTCUSDT.P
Weekly Chart:
Bitcoin has now printed three consecutive weekly closes above the former higher-high threshold at $111 960. That series is enough to confirm a clean breakout of the prior HH-HL range and keeps the long-term bias pointed firmly higher.
That said, a near-term pullback is still on the table:
• First support — the breakout shelf at $111 960 (re-test of structure).
• Deeper support — the next V-level around $98 115.
Why the caution?
Last week’s candle left a small Failed Auction just above the new high, and Footprint data shows a cluster of aggressive buy-delta trapped in that wick. Those buyers may need to get washed out before the trend resumes.
Big picture: weekly structure is bullish; any dip into the levels above is a potential reload zone while the breakout holds.
Daily Chart:
Price action remains firmly bullish: multiple Failed-Auction rejections at the $116 860 higher-low vLevel keeps supply thin and reinforce the up-trend toward the prior ATH.
That said, remember Auction Market Theory rule #5: “When time or volume builds at the edge of balance, price often pushes through.”
• Each failed auction is absorbing resting bids.
• If sellers lean in again with size, the level can flip from support to resistance very quickly.
In practice that means:
•Base case – continuation to the highs while the Daily structure holds.
•Risk scenario – a clean break of $116 860 would open room for a deeper weekly pullback toward $107456.0
For now we treat the current weekly pullback as a fresh opportunity: scouting intraday longs as price reacts to the 1-Hourly zone.
From the footprint read-out, today’s bar finished with a neutral delta, but note where the profile is stacked: both the Value Area Low and the POC sit right at the bottom of the candle. That tells us the bulk of volume printed down at the session lows and it skewed negative, sellers were leaning hard, trying to extend the move lower.

$ETH 2nd Weekly Close Above 50MA = Alt Season2nd Consecutive Weekly Close
above the 50MA for CRYPTOCAP:ETH
✅ Volume to confirm the breakout.
✅ RSI has bottomed.
WHAT TO WATCH 👀
┛Bullish Cross on the 20/50MA to confirm the next leg up.
┛Approaching some resistance ahead at the .236 Fib
┛Expect a small pullback in the next week or two so make sure to get your bids in.
Remember the rotation:
✅ BTC > ✅ ETH > Large Caps > Mid Caps > Micro Caps.
$TOTAL Market Cap Highest Weekly Close - Bearish Divergence?!Once again, highest Weekly Close on the Crypto CRYPTOCAP:TOTAL Market Cap ever.
PA continues to trend above the EMA9 and POI.
It’s worth noting Bearish Divergence on this local level.
I do not believe this is much to worry about however and have discussed this in prior analysis which I will post in the comments.
Strong Volume has shifted in the Bulls favor.
Bulls want to keep PA above $3.7T
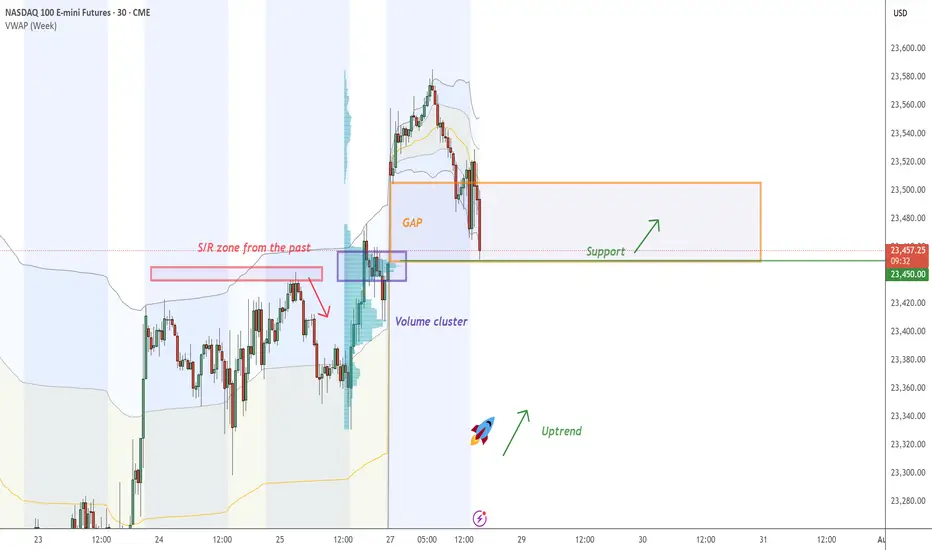
NASDAQ - Fair Value GAP On NASDAQ , it's nice to see a strong buying reaction at the price of 23450.00.
There's a significant accumulation of contracts in this area, indicating strong buyer interest. I believe that buyers who entered at this level will defend their long positions. If the price returns to this area, strong buyers will likely push the market up again.
(FVG) - Fair Value GAP and high volume cluster are the main reasons for my decision to go long on this trade.
Happy trading
Dale
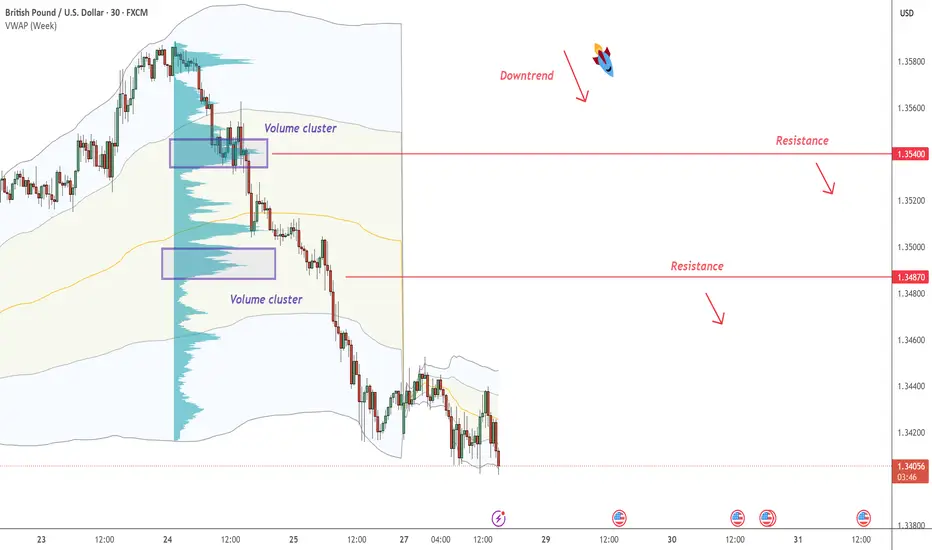
GBP/USD - continues the downtrendOn GBP/USD , it's nice to see a strong sell-off from the price of 1.34870 and 1.35400 . It's also encouraging to observe a strong volume area where a lot of contracts are accumulated.
I believe that sellers from this area will defend their short positions. When the price returns to this area, strong sellers will push the market down again.
Downtrend and high volume cluster are the main reasons for my decision to go short on this trade.
Happy trading,
Dale
XRP Eyes $4? Analyst Says ‘Most Profitable Phase’ May Have BegunAs the broader crypto market shows signs of recovery, XRP is once again capturing investor attention—this time with bold forecasts of a surge toward $4.00, driven by technical momentum, market sentiment, and expanding real-world utility.
According to crypto analyst Darren Chu, CFA, founder of Tradable Patterns, XRP may be entering its “most profitable phase” since its 2021 rally. The token has posted a 20% gain over the last three weeks, breaking key resistance levels and displaying stronger correlation with broader altcoin inflows.
“XRP has the ideal confluence of legal clarity, technical breakout, and network traction,” Chu explained in a recent research note. “The conditions now resemble the early stages of major cyclical surges we’ve seen in past bull runs.”
Legal and Regulatory Tailwinds
Since Ripple Labs’ partial legal victory against the U.S. SEC in 2023—where a federal judge ruled that XRP is not a security when traded on exchanges—the asset has regained credibility among institutional players. Multiple crypto funds and ETFs have added exposure, and on-chain wallet growth has accelerated.
This legal clarity has paved the way for Ripple to resume aggressive expansion of its payment corridors, especially in Latin America and Asia-Pacific.
Real-World Utility as a Demand Catalyst
Unlike many Layer 1 tokens with purely speculative value, XRP benefits from real-world utility as a bridge asset for global payments. RippleNet, the enterprise-grade payment network built on XRP, now boasts over 300 financial institutions using or piloting XRP-based settlement infrastructure.
In July, Ripple announced its latest partnership with Banco Bradesco, one of Brazil’s largest banks, to streamline USD/BRL remittances—a deal expected to drive significant volume on-chain.
Analysts note that real-world utility may now be priced into XRP’s valuation at a discount, creating room for catch-up as adoption increases.
Technical Analysis Points Toward Breakout
From a technical standpoint, XRP has breached its multi-month descending channel, with daily trading volume rising 35% over the past two weeks. Analysts are watching the $0.92–$1.00 range as a short-term hurdle. If broken, momentum could accelerate quickly toward $1.50, and potentially as high as $3.80–$4.20, according to Fibonacci-based projections.
“The breakout setup is textbook,” says Chu. “We’re seeing volume confirmation, RSI divergence, and a broader macro narrative—all aligning.”
Risk and Reward: A Balanced View
Of course, XRP is not without risks. Pending SEC appeals, macro volatility, and delays in Ripple’s expansion plans could temper the pace of gains. Still, many investors are betting that the risk-reward profile is increasingly asymmetric in XRP’s favor.
In the eyes of analysts and asset managers alike, XRP is now more than a litigation story—it’s a comeback story.
For those seeking exposure to a large-cap crypto with strong fundamentals, legal clarity, and real-world traction, the message from the market is clear: XRP’s most profitable phase may have just begun.

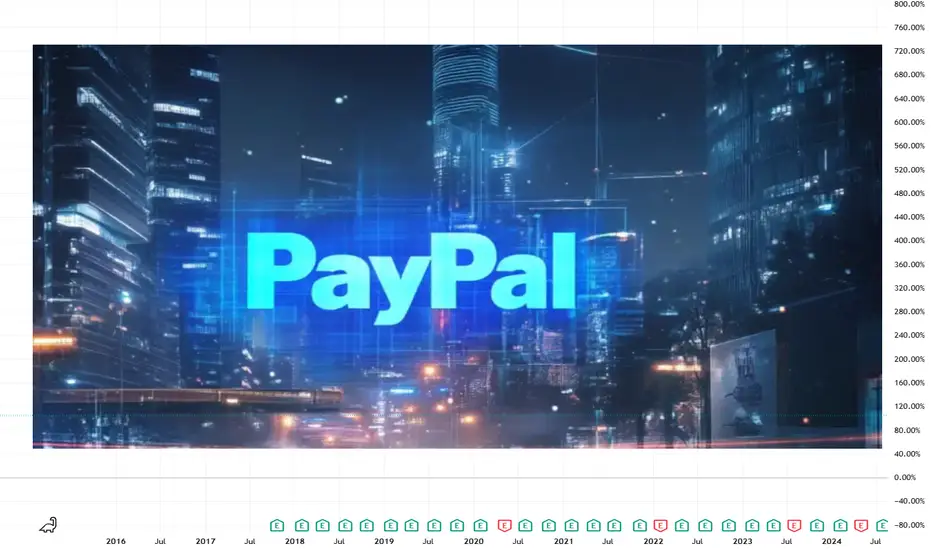
PayPal’s Stablecoin Ambitions Falter Ahead of Earnings ReportWhen PayPal launched its own stablecoin PYUSD in August 2023, the move was seen by many as a bold step toward dominating the digital payments space. However, nearly two years later, PYUSD has yet to meet expectations. Its market share remains minimal, trading volume is weak, and trust from the DeFi community is limited — all while PayPal’s next earnings report looms and investor pressure mounts.
What’s the issue?
According to data from DefiLlama and CoinGecko, PYUSD’s market cap stands at just over $400 million, despite high-profile marketing campaigns and its integration with Venmo. In comparison, USDT has surpassed $110 billion in circulation, and USDC stands at around $32 billion. PYUSD hasn’t even broken into the top five stablecoins on Ethereum by trading activity.
A key problem is low liquidity and limited DeFi adoption. Although PYUSD is available on several decentralized exchanges (DEXs), it often suffers from high slippage. Moreover, PayPal operates under strict regulatory scrutiny as a public fintech company, limiting its ability to innovate or respond rapidly to market trends.
Why earnings matter
PayPal’s Q2 earnings report is expected next week, and investors will be closely watching not only core metrics like revenue and profit but also figures related to its Web3 and digital asset initiatives. With PYUSD underperforming, pressure is building for PayPal to justify its continued push into the crypto space.
There is growing speculation that the company may consider partnering with an established stablecoin provider or even abandoning PYUSD in favor of a white-label solution — a move that could realign its Web3 roadmap.
The strategic lens
Despite current struggles, PayPal still has the brand and user base to play a significant role in digital finance. However, as DLT analysts emphasize, a stablecoin is more than a payment tool — it’s infrastructure. Success depends on liquidity, trust, and deep integration within the DeFi ecosystem. Without robust adoption across chains and use cases, PYUSD risks becoming an internal-only solution with limited external relevance.
Unless the earnings report reveals a strategic pivot or new partnerships, investors may interpret PYUSD as a lost opportunity rather than a long-term asset.
Ethereum Staking Strain Exposed — Daxprime Weighs InIn July, the Ethereum ecosystem faced a new challenge: a sharp increase in the staking exit queue revealed structural weaknesses in the current liquid staking architecture. Within just a few days, more than 75,000 validators submitted requests to exit, causing temporary disruptions in certain derivative protocols and downward pressure on the prices of liquid staking tokens such as stETH, rETH, and sfrxETH.
Daxprime, a firm specializing in institutional analytics and active strategies in the Web3 sector, believes that this situation presents not only risks, but also new opportunities for profit — particularly for well-prepared market participants.
What Happened?
Since transitioning to Proof-of-Stake in 2022, Ethereum has enabled staking through validators. However, to exit the network, validators must join a queue. Under normal market conditions, this process takes just a few hours to a couple of days. But in July, a sudden surge in withdrawal requests extended the queue to over seven days — the longest wait time since the Shanghai upgrade.
Several factors contributed to the spike in exits:
Increased market volatility;
Rising yields in alternative DeFi instruments;
Panic reactions to liquidity stress in certain protocols.
As a result, liquid staking tokens — which are designed to trade close to a 1:1 ratio with ETH — began to trade at discounts of 3% to 4%, particularly on low-liquidity DEX platforms.
Systemic Risk or Temporary Disturbance?
Daxprime analysts emphasize that this is not a structural threat to Ethereum itself. However, the recent events clearly demonstrate that even "liquid" staking is still fundamentally tied to base-layer network constraints. Protocols like Lido and Rocket Pool are susceptible to imbalances between assets and liabilities, especially when there is a rapid increase in redemption demand.
This also means that users trading staking derivatives without understanding the mechanics of validator exit processes may face temporary illiquidity or losses when attempting to unwind positions during stress events.
How to Profit — Daxprime’s Perspective
For experienced market participants, such imbalances offer entry points with positive expected value. Here’s how Daxprime identifies ways to profit:
1. Arbitrage on Discounted Tokens
When stETH or sfrxETH fall below 0.97 ETH, there is an opportunity to buy these tokens on the secondary market and redeem them for full ETH value — either through redemption protocols or by waiting through the validator exit process.
2. Liquidity Provision with a Premium
Liquidity providers in stETH/ETH or sfrxETH/ETH pools during periods of market stress earn higher trading fees and farming incentives due to increased volume and imbalance in the pools.
3. Futures and Hedging Strategies
On platforms such as dYdX or Aevo, traders can build structured positions using stETH as the spot asset and hedging via ETH futures. This allows them to profit from either the restoration of parity or a continuation of the spread.
Daxprime’s Conclusion
The current exit queue backlog is not a catastrophe — it is a reminder that liquidity in crypto markets is always conditional. Stress events create inefficiencies that sophisticated investors can turn into sources of return.
Daxprime provides the tools to monitor such inefficiencies and helps clients execute strategies that not only mitigate risk but convert volatility into profit.
In markets where even “liquid” assets can become illiquid, those who understand the mechanics and act ahead of the curve stand to win.
Capital B Hits 2,000 BTC as BBDelta Highlights StrategyEthereum has surged past the $3,900 mark, propelled in part by news that Sharplink has acquired 77,200 ETH — a transaction worth over $300 million at current market value. For BBDelta, this move is not just market noise — it’s a concrete example of how institutional-grade Ethereum strategies can drive both asset growth and consistent income.
Sharplink, originally focused on gaming and Web3 infrastructure, has recently pivoted toward an asset-heavy Ethereum strategy. This latest acquisition positions the firm among the top ETH holders globally — and, more importantly, signals a clear roadmap to profit generation within the Ethereum ecosystem.
BBDelta analysts believe Sharplink isn’t buying ETH for speculative purposes. Rather, the company is likely deploying a multifaceted revenue model using its holdings. That includes high-yield staking via Ethereum’s proof-of-stake protocol, engagement with DeFi lending platforms, and participation in liquidity pools. These strategies, when executed correctly, can yield between 4% and 8% annually — paid directly in ETH or stablecoins.
In addition to yield generation, Sharplink could be utilizing ETH to collateralize derivatives positions, fund tokenized infrastructure, or support its presence in NFT ecosystems. Ethereum, as a platform, offers an incredibly diverse set of use cases — making it more than just a crypto asset, but a cornerstone of digital finance.
The breakout past $3,900 further strengthens this strategy. BBDelta’s technical analysis shows increased open interest in ETH futures and options, indicating rising institutional demand and the likelihood of continued volatility — a prime environment for experienced players to profit from both price movement and structure-based yields.
Sharplink’s timing also reflects sound macroeconomic thinking. As fiat currencies continue to face inflationary pressure and traditional interest rates plateau, ETH-based strategies offer both protection and performance. BBDelta believes this dual value proposition — yield + appreciation — is driving renewed interest in Ethereum as a strategic reserve asset.
At BBDelta, we empower clients to capitalize on these same dynamics. Whether it’s through ETH staking, DeFi revenue models, or structured derivatives, we offer the tools and advisory frameworks that allow investors to turn ETH holdings into active profit centers — with proper risk management in place.
Ethereum’s $3,900 milestone is not a peak — it’s a gateway to next-level opportunity. For those with the infrastructure, insights, and risk controls in place, the digital economy is not just a bet — it’s a business.
