ATAI breaks out of three year channel on massive volumeATAI had a big breakout last week on positive market reaction to news, and is trading at the highest levels in 3 years. This is the first monthly trend change in the history of this stock (and maybe even the psych sector!) and I'm anticipating this to continue playing out as hype slowly returns to the sector. this is a small cap and a little volume on this can go a long way. Entry: 2.15, stop loss 1.95
Volume

Side way Breaks to new all time high Hello Traders,
i can see big volume compared to the monthly trading at the ending of side way markets which will lead for a continuation for the bullish trend targets is already mentioned and it depends what you are investing for short intermediate long if we break the discount area we well go for big correction advice to sell with the retest however if we breaks the discount area huge profits coming. if you like the idea kindly show your support for more ideas to come good day.

40 Year Rough EstimateThis chart looks silly, I know. Turn on log to see it a bit better. It sounds absurd, but so does just about any market.
The only thing I can see stopping this is a return to the gold standard. As long as money can be printed for free, it will. Bitcoin can't.
I suspect we'll start seeing the qSAT (quadrillionSAT) shorthand or something, because you can always add more zeroes.

VTI 1D: breakout on the daily within a long-term weekly uptrend On the daily chart, VTI (Vanguard Total Stock Market ETF) has broken through the key $303.5 resistance level with strong volume. This breakout occurs within a larger weekly uptrend channel, highlighting a continuation of the long-term bullish structure.
Volume profile shows a clear path ahead: $321.7 (1.272 Fibo) and $345 (1.618 Fibo). The golden cross (MA50 crossing MA200 from below) further supports the bullish case.
Fundamentally, VTI represents the entire U.S. equity market - large to small caps - and benefits from economic resilience, declining inflation, and passive inflows. It’s a logical macro play for trend continuation.
Tactical plan:
— Entry by market or after retest $303.5
— TP1: $321.7
— TP2: $345
— Invalidation below $300
The whole market breaking out? That’s not noise — it’s the signal.

Final move by the bears? Bulls lining up for ATHHi traders and investors!
Buyers have reached the first target at 108,952.
On Binance spot, BTC missed the second target (110,530.17) by just 99 cents.
Is this a setup for a breakout and a run toward a new ATH?
So far, the price action looks like a level manipulation around 108,952: volume in all 3 bars interacting with this level is concentrated above it.
Just below lies a buyer zone (107,500 – 105,100).
I am watching for buyer reaction once the price reaches this area.
This analysis is based on the Initiative Analysis concept (IA).
Wishing you profitable trades!

Preventing Holiday Schedule Glitches in Automated Futures Trade
Yesterday the market closed at 1:00 PM, and I still had two open positions. Normally my algorithm sends an “exit all” signal at 3:59 PM EST to close every futures contract, but it didn’t account for the holiday schedule. That glitch cost me $5,000 in just a few hours. Lesson learned.

ETH SHORT SCALP ! to 2500
Executed an ETH short from the earlier setup — took 75% profit at TP1, then let the rest run.
Price pulled back into the secondary zone, added to the position with structure confirmation.
Let it roll into the next leg — clean execution, solid momentum follow-through.
+113.84% on the full move, managed with scale-out and conviction on the retest.
Patience paid. System did the work.

Nat Gas; Dip then RipA slight breather as expected for NG prices after such a strong reversal, from the storage report lows on 6/27/2025. Support for NG based on volume looks to be in the $3.55 to $3.65 range, before continuing a move up to $4+. NYMEX:NG1!

WBA LongLong triggered at 11.4 even tho I'm not happy with the volume,
a pullback to 11.2 is probably and would be a better entry point
SL at 10
TP at 15

BTC/USDT Long Setup – Daily Bullish Continuation PlayMarket Context:
Bitcoin has reclaimed significant ground after a corrective phase and is now approaching prior highs. The current move suggests strength and potential continuation — but with overhead resistance near 111,866, a retracement or consolidation before continuation is likely.
Setup Idea:
The chart illustrates a bullish continuation scenario: price may push slightly higher into resistance, then retrace into a more favorable entry zone before targeting new highs. The Fibonacci retracement levels between 100,500 and 102,470 align with a high-probability demand zone for a dip buy.
Trade Plan:
Entry Zone: Await retracement into the 0.5–0.618 fib zone (102,400–100,500)
Stop Loss: Below 99,900 (beneath 0.65 fib and invalidation structure)
Target: 119,900 (clean extension above prior high)
Risk/Reward: Favorable multi-R setup based on macro continuation
Notes:
The setup anticipates a pullback before the next impulse. If BTC breaks through 111,900 with momentum and no retrace, the trade idea would shift to chasing on strength or waiting for consolidation above.
Momentum indicators on VMC show bullish pressure building, but overbought conditions suggest temporary cooling may occur.
Let the retrace come to you — and position accordingly on confirmation.
Crypto Mining CIFR LongWe are at last major resistance here at 4 bucks before possible push towards and above 6$
Any pullback between 3.8 - 4 represents a lucrative risk to reward
Entering half position here and rest below 4$
TP1 5.06
TP2 6.06
SL 3.24

HINO LongHino broke its downward channel line in November 24. It posted a high of 545 in Jan 25 and came back to retest the level which broke the downward channel (~300).
Now it is exactly at its Fib 0.236 level, crossing which, it will pace up and move towards its next levels.
Next levels are: 545, 589, 721 and 853 in short to medium term.
Long terms target can be its all-time high level of 1274.
Its not a buy / sell call, just my personal opinion.
Daily, weekly and Monthly RSI are all at or around 60 that show positive momentum.
Moreover, the increasing volumes since it broke downward channel showing active players ;)
One thing to note that its free float is very low, that will cause its very fast move upward (whenever it may be)

DESTINI-WB - May follow its mother share ?DESTINI-WB - CURRENT PRICE : RM0.090
This warrant is an illiquid and a bit difficult to trade. However recently alot of trading activity takes place as we can see in the volume bar. This is due to its mother share DESTINI (7212) broke out from its accumulation phase on 12 JUNE 2025. At the same time, it also makes a NEW 52 WEEK HIGH. The company's fundamental is improving. Traders may take this opportunity to buy the company's warrant as it is so cheap and have potential of following its mother share. Furthermore, the expiry dates is on 06 MARCH 2029.
ENTRY PRICE : RM0.085 - RM0.100
TARGET : RM0.120 (33.33%) and RM0.150 (66.67%)
SUPPORT : RM0.070 (-22.22%)

BTC/USDT Technical Analysis, 2025-07-01 19:30 UTCA bullish trade opportunity was identified after price action formed a Piercing Line candlestick pattern, signaling a potential reversal from recent lows.
🔹 Technical Overview:
Entry Price: 105,869.86 USDT
Take Profit (TP): 106,939.86 USDT
Stop Loss (SL): 104,669.86 USDT
200 EMA: 106,320.49 USDT (Price is trading below — potential dip-buy opportunity)
Pattern Detected: Piercing Line (bullish reversal)
🔹 Volume Context:
Recent candles showed moderate volume with signs of buyer interest increasing.
OBV trend has turned slightly positive, supporting a short-term bullish case.
🔹 Order Flow:
Price action is showing signs of recovery from a local support zone.
Some imbalance in the order book tilted toward buyers, with supportive bid liquidity observed.
This setup combines trend deviation, bullish price action, and support reaction, creating a favorable risk-to-reward scenario. Trade is now active and being monitored toward the defined TP level, with strict stop-loss protection in place.

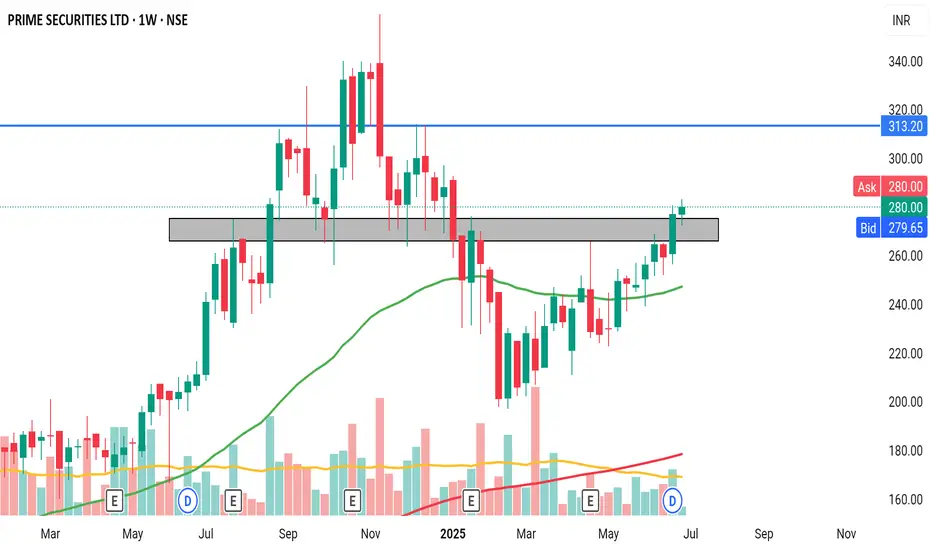
PRIME SECURITIES Crossed resistance with good volume in weekly timeframe. Price above 50 EMA indicates bullishness.
Dow Jones LongsCouple long ideas,
Price action is sitting on big volume note
Sooner or later expect bullish price action
Conservative Position sizing is prudent in this market environment

Russels IWM LongSeems decent here since its the VAH of the previous all time high correction move
Pump into POC for TP
Would not risk more then 1%

June trading results - three automated trading systemsHi,
In month of June 2025, my three automated trading systems made 32 trades on ME.S and MN.Q.
The pnl pie charts are on the screen. I lost about $1,000 in total. I trade on Micro. Well, I was up for the past 5 month but this kinda hurts, but its ok, I should not give up. I have back tested my strategies using python backtrader in 5 years (rolling walk forward), I know that lost is also expected.
My system trades on 15 min candle, and I use tradingView + tradovate automation system which I built myself.

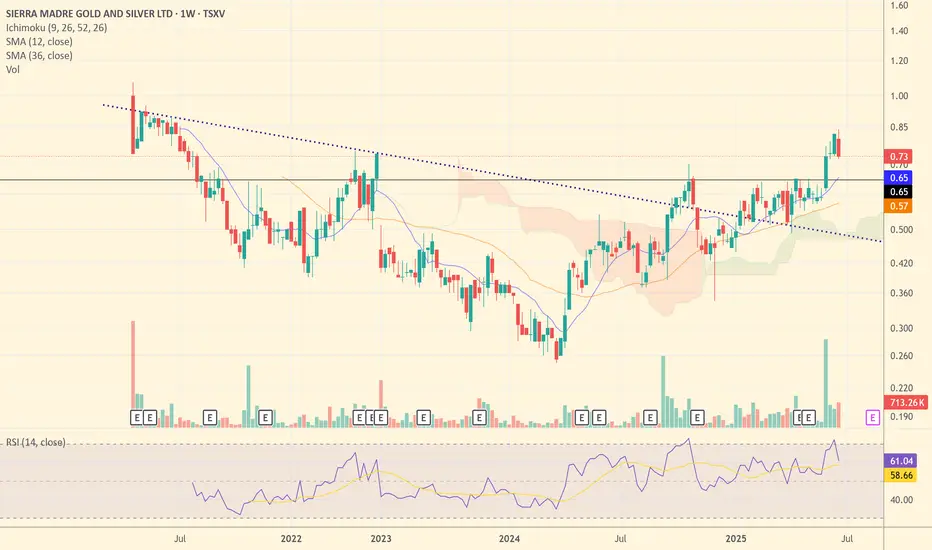
SM: Poised for Silver Alpha? - A Producer's Growth StorySierra Madre Gold and Silver (TSXV: SM) is shaping up to be a prime candidate for significant upside in a rising silver market. Having recently transitioned to commercial production and achieved positive cash flow in Q1 2025, SM has moved past the riskiest development hurdles and is now firmly in the "Production & Growth" phase of the Lassonde Curve.
Why SM Stands Out for Potential Upside:
- Operational Momentum: In Q1 2025, SM achieved positive cash flow with sales of 165,000 ounces of silver equivalent (AgEq), a critical milestone that validates the Guitarra project's viability.
- Improving Cost Structure: All-in Sustaining Costs (AISC) have been brought down to approximately $29/ounce AgEq. This efficiency directly translates to expanded margins as silver prices climb.
- Exponential Leverage to Silver Price: At a $40/ounce silver price scenario, SM's margin would jump to over $11/ounce AgEq. This significant increase in profitability is a powerful catalyst for share price appreciation, generating robust free cash flow for reinvestment.
- Clear Growth Catalysts: The company has ambitious plans to optimize operations, implement new flotation systems, and expand mill capacity to 1,200-1,500 tonnes per day. This could boost annual production to 2.5-3 million ounces of silver, creating substantial organic growth.
- Supportive Environment: A observed positive shift in the Mexican regulatory environment towards mining further enhances investment appeal.
Technical Analysis Snapshot:
SM's chart shows promising technical signs. After a period of consolidation (akin to a "valley" in the Lassonde Curve), the stock has recently experienced a breakout above a long-term downtrend line, signaling a potential shift from bearish to bullish sentiment. Volume accompanying this breakout is crucial for conviction. The stock appears to be establishing new support levels, indicating a potential accumulation phase. Investors should monitor for sustained trading above key moving averages and continued volume confirmation as indicators of a strengthening trend.
Risk-Reward Profile:
- Risk Profile: Medium to High (as a new, smaller producer with expansion execution risks)
- Potential Return at $40 Ag: Very High (due to dramatic profitability increase and accelerated growth)
Conclusion:
Sierra Madre Gold and Silver is well-positioned to capitalize on a bullish silver market. Its proven production, cost efficiency, and clear expansion roadmap make it a compelling candidate for significant price appreciation as silver prices head towards $40/ounce. For investors seeking "alpha" with a calculated approach to risk, SM offers a compelling growth story.
BTC/USD Technical Analysis – Weekly Elliott Wave StructureIn this video, we analyze the weekly chart of Bitcoin ( BYBIT:BTCUSDT ) using Elliott Wave theory.
The current structure suggests the beginning of a new bullish impulse (waves 0, 1, and 2) following a clearly completed and technically correct corrective phase.
We explore potential impulsive scenarios starting from wave 2, using Fibonacci extensions to project possible targets and identifying key support zones and invalidation levels.
This analysis aims to provide a macro perspective based on price action, helpful for traders and investors following BTC from a medium- to long-term technical view.
🛑 Disclaimer: This content is for educational and informational purposes only. It does not constitute investment advice. Each user is responsible for their own trading decisions.

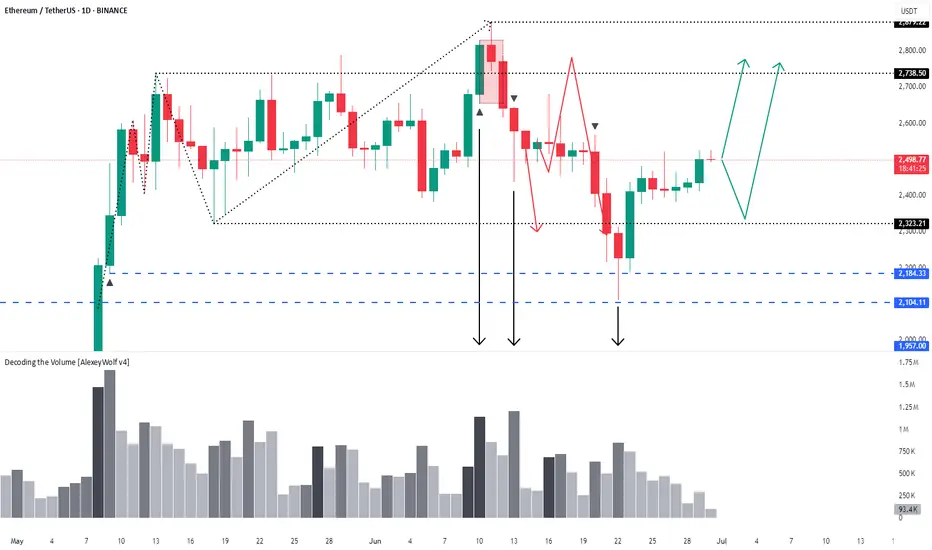
Ethereum – 1D timeframe overview with Initiative AnalysisHey traders and investors!
The seller has reached their target.
A buyer started buying from the 2184 level and now holds the initiative.
Targets are on the chart.
This analysis is based on the Initiative Analysis concept (IA).
Wishing you profitable trades!