10.09.25 Morning ForecastPairs on Watch -
FX:EURUSD
FX:EURJPY
FX:EURCAD
A short overview of the instruments I am looking at for today, multi-timeframe analysis down to what I will be looking at for an entry. Enjoy!
W-patterns

09.09.25 Morning ForecastPairs on Watch -
FX:EURUSD
FX:EURCAD
FX:NZDCAD
FX:NZDUSD
A short overview of the instruments I am looking at for today, multi-timeframe analysis down to what I will be looking at for an entry. Enjoy!

Two EURCAD Positions Trade Recap 10.09.25Two positions covered in this recap.
EUR / CAD -1%
EUR / CAD Re-Entry BE
Full explanation as to why I executed on these positions and how I maintained my mindset to allow me to get back into the second position after taking the loss. Something I have been working on the past month or so is maintaining the executional mindset after being taken out of a trade, and if it is still intact to actually get back in to the market.
Any questions you have just drop them below 👇

Risky NZDUSD Trade RecapThis setup wasn’t the cleanest, but sometimes calculated risk pays off.
📉 Setup:
Price was in a clear downtrend, making this buy counter-trend.
Demand zone around 0.5818 offered a possible bounce.
Break of the descending trendline gave early confirmation.
✅ Entry: 0.58189
❌ SL: 0.57964
🎯 TP: 0.59420 – 0.59490 supply zone
📊 Outcome:
Despite the risk of fading the trend, price respected demand, broke structure, and ran straight into my supply target at 0.5940+ for full profits.
⚠️ Not every trade will be textbook perfect — but with proper risk management, even the risky ones can pay off.
#NZDUSD #ForexTrader #RiskManagement #RiskyTrade #PriceAction #SmartMoneyConcepts #ForexJourney #MarketStructure

08.09.25 Morning ForecastPairs on Watch -
FX:EURUSD
FX:GBPUSD
FX:EURCAD
FX:AUDJPY
A short overview of the instruments I am looking at for today, multi-timeframe analysis down to what I will be looking at for an entry. Enjoy!

05.09.25 Morning ForecastPairs on Watch -
FX:EURNZD
FX:EURGBP
FX:GBPUSD
A short overview of the instruments I am looking at for today, multi-timeframe analysis down to what I will be looking at for an entry. Enjoy!

04.09.25 Morning ForecastPairs on Watch -
FX:GBPAUD
FX:EURJPY
FOREXCOM:COFFEE
FX:NZDCAD
A short overview of the instruments I am looking at for today, multi-timeframe analysis down to what I will be looking at for an entry. Enjoy!

03.09.25 Morning ForecastPairs on Watch -
FOREXCOM:COFFEE
FX:NZDCAD
FX:EURNZD
A short overview of the instruments I am looking at for today, multi-timeframe analysis down to what I will be looking at for an entry. Enjoy!

02.09.25 Morning ForecastPairs on Watch -
FX:EURCAD
FX:AUDUSD
FX:EURAUD
FX:GBPAUD
A short overview of the instruments I am looking at for today, multi-timeframe analysis down to what I will be looking at for an entry. Enjoy!

01.09.25 Morning ForecastPairs on Watch -
FX:EURNZD
FX:GBPAUD
A short overview of the instruments I am looking at for today, multi-timeframe analysis down to what I will be looking at for an entry. Enjoy!

29.08.25 Morning ForecastPairs on Watch -
FX:AUDUSD
FX:EURUSD
FX:GBPUSD
FX:EURNZD
A short overview of the instruments I am looking at for today, multi-timeframe analysis down to what I will be looking at for an entry. Enjoy!

GBPAUD / EURGBP / AUDUSD Trade Recap (Closing +5.5%) 28.08.25Three positions covered in this recap.
GBP / AUD +2%
EUR / GBP +0.0%
AUD / USD +2.5%
Full explanation as to why I executed on these positions and the management plan with all three.
Any questions you have just drop them below 👇

28.08.25 Morning ForecastPairs on Watch -
FX:GBPAUD
FX:AUDUSD
FX:EURUSD
A short overview of the instruments I am looking at for today, multi-timeframe analysis down to what I will be looking at for an entry. Enjoy!

27.08.25 Morning ForecastPairs on Watch -
FX:GBPCAD
FX:AUDUSD
FX:GBPAUD
A short overview of the instruments I am looking at for today, multi-timeframe analysis down to what I will be looking at for an entry. Enjoy!

26.08.25 Morning ForecastPairs on Watch -
FX:AUDUSD
FX:GBPCAD
FX:GBPAUD
A short overview of the instruments I am looking at for today, multi-timeframe analysis down to what I will be looking at for an entry. Enjoy!

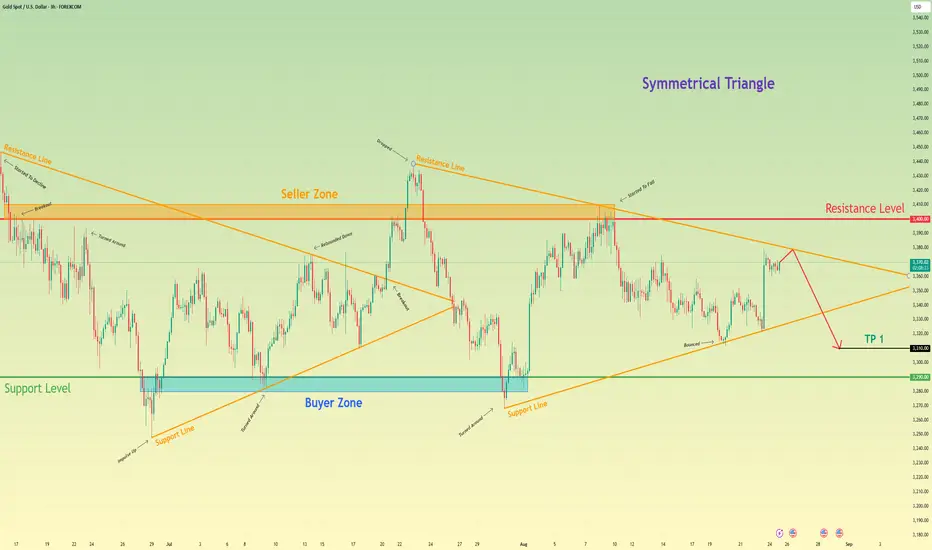
Gold will drop from resistance line of triangle to 3310 pointsHello traders, I want share with you my opinion about Gold. The market for Gold is currently defined by a large symmetrical triangle, a pattern of equilibrium that has formed after a strong rebound from the 3290 buyer zone halted the previous downward trend. This new market structure indicates a period of contracting volatility, with the price action for XAU being methodically squeezed between a descending resistance line and an ascending support line. These boundaries are anchored by the major seller zone around the 3400 resistance level and the aforementioned 3290 buyer zone. At present, the asset is at a critical inflection point, having rallied to test the descending resistance line of this triangle. The primary working hypothesis is a short scenario, based on the expectation that the 3400 seller zone will hold and that sellers will re-emerge to defend this territory. A confirmed rejection from this upper boundary would validate the integrity of the symmetrical triangle and likely initiate another major downward rotation within the pattern. This fall would target the ascending support line and the underlying horizontal support. Therefore, the TP for this rotational play is logically placed at 3310 points. Please share this idea with your friends and click Boost 🚀
25.08.25 Morning ForecastPairs on Watch -
FX:USDCAD
FX:EURAUD
FX:AUDJPY
A short overview of the instruments I am looking at for today, multi-timeframe analysis down to what I will be looking at for an entry. Enjoy!

22.08.25 Morning ForecastPairs on Watch -
FX:EURCAD
FX:GBPAUD
A short overview of the instruments I am looking at for today, multi-timeframe analysis down to what I will be looking at for an entry. Enjoy!

CHFJPY / GBPUSD / EURGBP Trade Recaps 22.08.25A tester trade on CHFJPY with the reasons explained as to why this was a test position, a long position executed on GBPUSD, a solid setup that this time around just didn't commit. And lastly a long position on EURGBP playing the failure of sell structure and getting involved in the buys.
Full explanation as to why I executed on these positions and the management plan with all three.
Any questions you have just drop them below 👇

21.08.25 Morning ForecastPairs on Watch -
FX:GBPCAD
FX:GBPUSD
FX:EURGBP
FX:EURUSD
A short overview of the instruments I am looking at for today, multi-timeframe analysis down to what I will be looking at for an entry. Enjoy!

20.08.25 Morning ForecastPairs on Watch -
FX:GBPUSD
FX:EURUSD
FX:AUDJPY
OANDA:XAGUSD
A short overview of the instruments I am looking at for today, multi-timeframe analysis down to what I will be looking at for an entry. Enjoy!

19.08.25 Morning ForecastPairs on Watch -
FX:EURCAD
FX:GBPUSD
FX:GBPCAD
A short overview of the instruments I am looking at for today, multi-timeframe analysis down to what I will be looking at for an entry. Enjoy!

18.08.25 Morning ForecastPairs on Watch -
FX:EURUSD
FX:GBPAUD
FX:AUDNZD
FX:EURNZD
A short overview of the instruments I am looking at for today, multi-timeframe analysis down to what I will be looking at for an entry. Enjoy!
