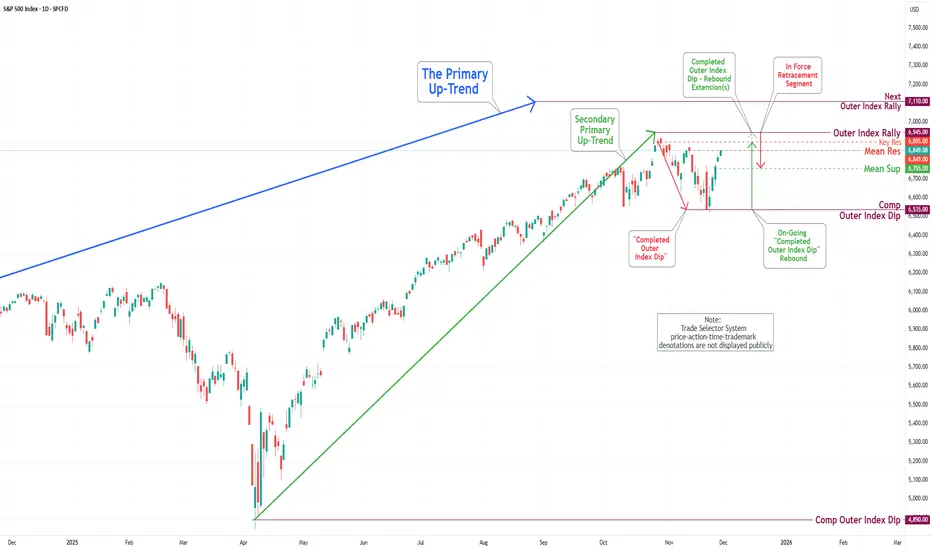
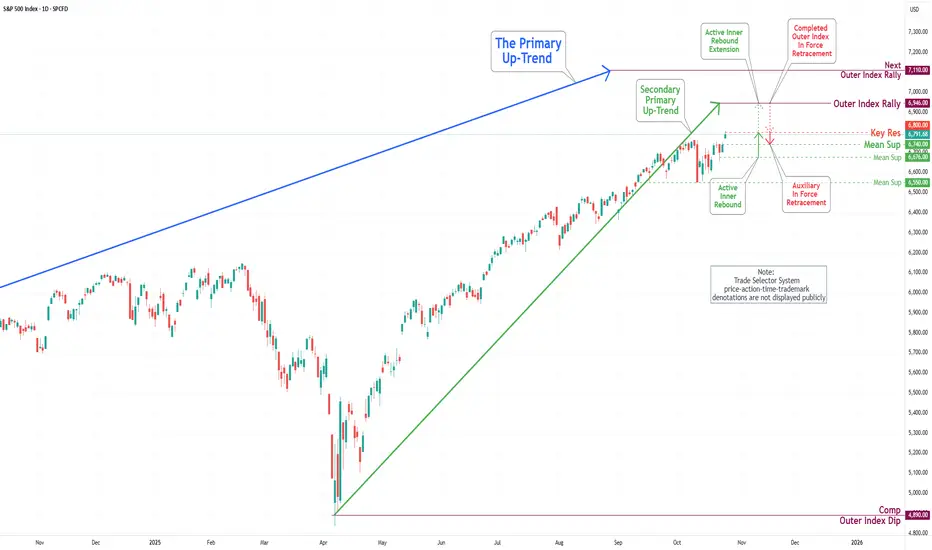
S&P 500 Daily Chart Analysis For Week of Dec 26, 2025Technical Analysis and Outlook:
During this shortened holiday trading session, the S&P 500 Index achieved a significant milestone by completing the highly anticipated Outer Index Rally target of 6,945, surpassing the Key Resistance level of 6,905, which had been forecasted over a considerable period.
At this time, upon the above-mentioned target completion, the index market experienced an admirable pullback; the downside target is currently set at Mean Support 6.877.
It is, however, essential to acknowledge that, given the market's recent gains, there is a substantial likelihood that prices may exhibit an upward fluctuation near this completed target. Additionally, there remains the potential for further upward movement before the anticipated alignment with the projected downward trajectory.
Wallstreet

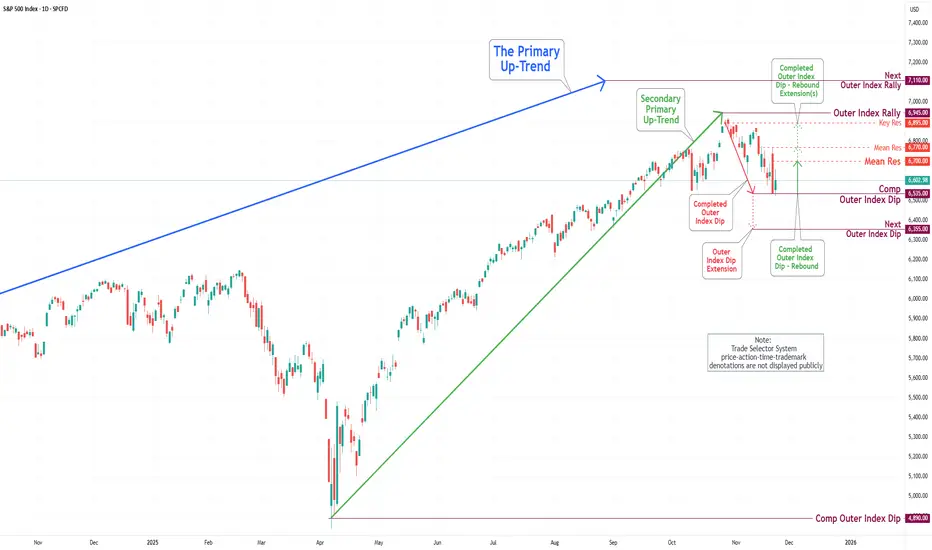
S&P 500 Daily Chart Analysis For Week of Dec 19, 2025Technical Analysis and Outlook:
In the most recent weekly trading session, the S&P 500 Index demonstrated significant downward movement followed by a notable recovery, bringing it closer to our primary target for the Outer Index Rally at 6,945.
At this time, the current market positioning indicates robust potential for continued upward momentum, with the principal objective being to reach the Key Resistance level of 6,905. This milestone is expected to contribute towards achieving the anticipated target of the Outer Index Rally at 6,945.
Nonetheless, it is essential to recognize that, given prevailing market dynamics, there is a considerable probability that prices will experience a pullback before realigning with the projected upward trajectory.

S&P 500 Daily Chart Analysis For Week of Dec 12, 2025Technical Analysis and Outlook:
In the course of the recent weekly trading session, the S&P 500 Index exhibited significant gyrational volatility, reaching a Key Resistance level at 6,895 before retracting to the Major Mean Support level delineated at 6,816.
At present, this market positioning indicates strong potential for continued downward movement, with the primary objective focused on targeting the Mean Support level at 6,755 via heavily traded Mean Support at 6,816.
Nevertheless, it is crucial to recognize that, given current market dynamics, there is a substantial probability of a robust price surge to retest the critical Key Resistance at 6,900, which may be accompanied by a strong rebound to the Outer Index Rally target at 6,945.

Massive WALL STREET Short At All Time High Price is testing the all time high while a head and shoulders formation is visible on the Daily, indicating potential distribution at resistance
On H4, momentum is overbought and price has remained range bound for approximately four sessions, signaling reduced follow through on the upside
Sentiment appears fragile amid discussion of an AI driven excess, and risk appetite is moderating into strength
Harmonic confluence is present, with a deep crab on H1 and a crab on H4 aligning near current levels to define a potential reversal zone
Multi-timeframe momentum is stretched up to H4; bearish RSI divergence is present on H1 and H4, with H4 showing roughly a 15-point divergence while price holds flat
Repeated failures at the all-time high confirm supply; this level continues to cap advances and strengthens the resistance profile
The H1 trend has transitioned from flat to lower, shifting near-term bias to the downside within the broader range
Cross-market context is consistent, as major US indices are also near record highs and failing to extend, which adds intermarket confirmation
Risk parameters are defined with a stop above 48,250 or above the all-time high at 48,425, which would invalidate the reversal thesis
Initial downside objective is 47,300, corresponding to the next significant support and consistent with an H4 scale pullback
Position management should consider partial profit taking at interim supports and a reduction in risk if RSI resets higher without corresponding price weakness

S&P 500 Daily Chart Analysis For Week of Dec 5, 2025Technical Analysis and Outlook:
In the recent weekly trading session, the S&P 500 Index recorded significant gains, achieving our primary target at the Key Resistance level of 6,895. Presently, this market position indicates potential downward movement, with the primary target set at Mean Support at 6,816, and the possibility of further decline to Mean Support at 6,755.
Nevertheless, it is essential to acknowledge that, in light of the current market dynamics, there exists a considerable probability of a repeat retracement from the Key Resistance at 6,895, accompanied by a robust bounce from Mean Support at 6,816.

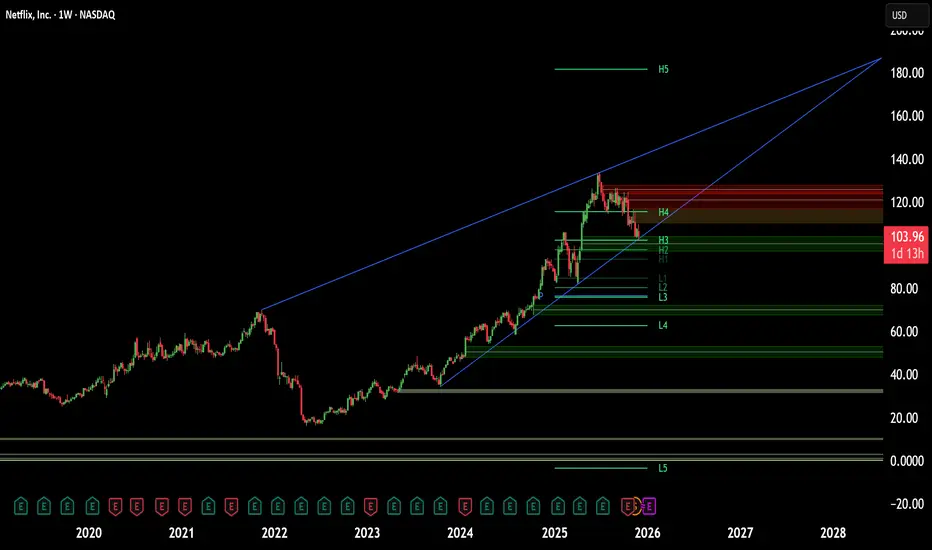
Netflix’s $70B Bid: The End of the Streaming Wars?Netflix (NASDAQ: NFLX) is rewriting the global media playbook. The streaming titan has submitted a binding, predominantly cash offer to acquire Warner Bros. Discovery (NASDAQ: WBD). This $70 billion maneuver marks a definitive pivot from disruptive builder to dominant consolidator. Management now signals that securing the next decade of dominance requires buying the industry’s most established moats.
Macroeconomics: The Power of Cash
Financial maturity drives this aggressive acquisition strategy. In a high-interest-rate environment, cash offers reign supreme. Netflix utilizes its fortress balance sheet to outmaneuver the rival Paramount Skydance consortium. While competitors propose complex stock swaps, Netflix offers WBD shareholders immediate liquidity and a defined exit price. With a projected Free Cash Flow of $9 billion for 2025, the company can service the necessary bridge loans without jeopardizing operations.
Geostrategy: The Regulatory Battlefield
The acquisition’s greatest threat lies in Washington, not Wall Street. White House officials have flagged concerns regarding media consolidation. However, Netflix utilizes a sophisticated geostrategic argument. The company contends it competes against trillion-dollar ecosystems like Apple and Amazon, not just legacy studios. By framing the merger as essential for surviving against Big Tech, Netflix aims to navigate the Department of Justice’s antitrust maze.
Industry Trends: Buying Cultural Infrastructure
Netflix is purchasing history, not just content. The deal secures the DC Universe, Harry Potter, and the historic Warner Bros. Studio lot. These assets represent "cultural infrastructure" that original production spend cannot replicate. Data from WBD’s Q3 2025 earnings confirms the value here: theatrical revenue surged 74% driven by franchise hits. This allows Netflix to diversify revenue streams into box office and merchandising at an unprecedented scale.
Technology & Cyber: The Traffic Signal
Platform stability remains a key indicator of consumer demand. The recent premiere of *Stranger Things* Season 5 crashed the platform, causing widespread outages. While technically a failure, Wall Street interprets this cyber-stress test as a bullish signal. It proves organic engagement is explosive. Integrating WBD’s library into this high-traffic ecosystem leverages Netflix’s proprietary delivery architecture to maximize viewership of dormant assets.
Management & Leadership: The Strategic Pivot
Netflix leadership is executing a calculated evolution. For 15 years, the strategy focused on building IP from scratch. Now, the C-suite recognizes that acquiring established franchises is the fastest route to a defensible moat. This assertiveness reflects confidence. With a market cap of roughly $460 billion, they are acquiring WBD because they can, not because they must to survive.
Data Science & Innovation: The Algorithmic Multiplier
The true value unlocked lies in data science. Netflix’s proprietary recommendation algorithms will likely revitalize WBD’s deep library. Merging WBD’s content with Netflix’s user data creates a powerful feedback loop. This "algorithmic multiplier" ensures that back-catalog titles achieve higher engagement on Netflix than they ever could on standalone platforms. This technological synergy justifies the premium paid for the assets.
Conclusion: A New Media Era
Netflix is positioning itself to own the entire entertainment ecosystem. The deal eliminates a key competitor and secures irrefutable IP dominance. While the $109 stock price held firm, the long-term thesis has shifted. Netflix is no longer just a tech platform; it is becoming the definitive media empire of the 21st century.
S&P 500 Daily Chart Analysis For Week of Nov 28, 2025Technical Analysis and Outlook:
In this abbreviated weekly trading session, influenced by a significant U.S. holiday and a cooling issue at the CyrusOne data centers at CME, the S&P 500 Index posted notable gains, reaching our primary target, the Mean Resistance at 6,849.
At present, this position suggests the potential for further upward movement, with primary targets established for a continuation of the robust trend toward Key Resistance at 6,895, followed by an extended target identified as the Outer Index Rally at 6,945.
Nevertheless, it is crucial to recognize that, given the prevailing market dynamics, there exists a considerable likelihood of an In-Force pullback from the aforementioned price targets.
SPY WEEKLY LIVE 26 NOV 2025This is Spy weekly where I have clearly discussed why not to long here. Best is not to trade if you are not sure otherwise chances are you might get stuck at the top.
NOTE:STAY AWAY FROM GOING LONGS

S&P 500 Daily Chart Analysis For Week of Nov 21, 2025Technical Analysis and Outlook:
In the last trading session, the S&P 500 Index exhibited significant gyrations, implying a pump-and-dump scenario and highlighting the significance of our completed Outer Index Dip at 6,535.
At present, this position suggests the possibility of further upward movement, with the primary targets established at the Mean Resistance levels of 6,700 and possibly 6,770. Furthermore, there exists a well-defined extension towards the Key Resistance level of 6,895, with an ultimate target for the Outer Index Rally set at 6,945.
Nonetheless, it is imperative to acknowledge the risk of a potential drawdown in the forthcoming trading session. Such an event could result in prices retesting the completed Outer Index Rally at 6,535, as well as the expansion towards the next Outer Index Rally at 6,355.
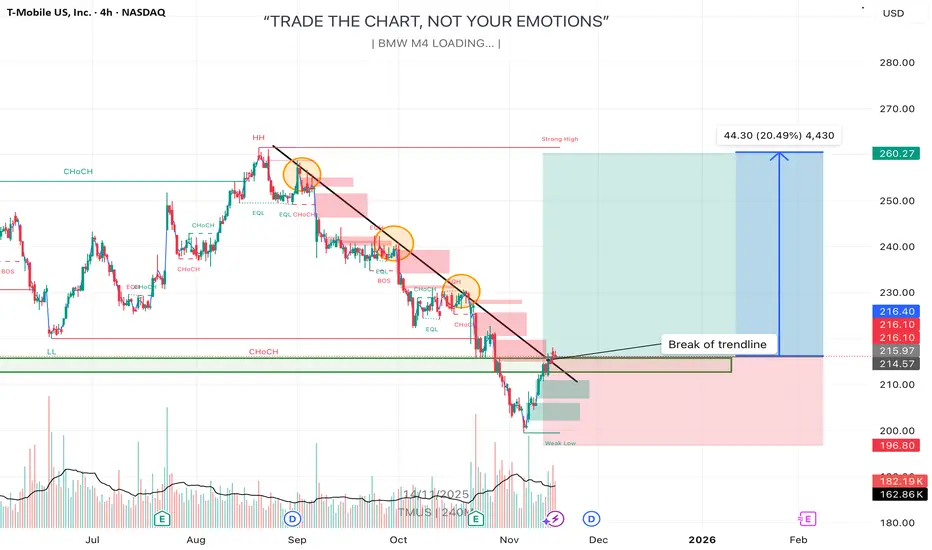
TMUS – Trendline Break & Bounce From Support Zone🔍 Quick Summary
I’m seeing T‑Mobile US, Inc. (TMUS) break a long-term descending trendline and bounce off a key support region. The chart suggests a breakout scenario where I expect price to push toward the strong high near $260 (≈ +20% upside).
⸻
📊 Deep Analysis
• On the 4-hour timeframe, TMUS formed a clear down-sloping trendline that has held resistance on multiple touches (three orange circles). Each successive rejection appears weaker, indicating bearish momentum is fading.
• The price recently broke above the trendline and found support again in the green zone around $214-$216, which aligns with past structure (a strong demand region).
• The big projected move (~$44 to $260) corresponds to previous swing highs and structural liquidity. That aligns with typical “liquidity above weak high” mechanics.
• From a fundamental angle: T-Mobile has delivered strong results — in Q4 it beat earnings and subscriber growth expectations and raised guidance for 2025, which supports a bullish bias.  Also, it launched a new fibre service with a 5-year price lock and is expanding its satellite messaging offering, which strengthens future growth potential. 
• Since the chart shows a low risk (stop-loss) around the support zone and big reward potential toward the strong high, this setup meets favourable risk-reward criteria.
⸻
🎯 Trade Idea Scenario
Bullish Scenario
• Entry: Around ~$214–$216 support zone (preferably on confirmation of trendline retest or bullish price action)
• Target 1: ~$245–$250 (intermediate structure)
• Target 2: ~$260 (strong high liquidity zone)
• Stop-Loss / Invalidation: Below ~$202-$200 (if price breaks below support, setup invalidated)
Bearish Scenario
• If price fails to hold support and closes below ~$202-$200, risk opens toward ~$180 or lower support regions. In that case, bearish momentum resumes and the upside target no longer valid.
⸻
📌 What I’m Watching Next
• Candlestick reaction around the trendline retest: a strong bullish close would validate breakout.
• Volume: higher volume on breakout confirms strength; low volume may signal a fake.
• Support break below ~$202-$200 would cancel the bullish case and shift focus to downside.
• Fundamentals: any new update on fibre rollout, satellite service, or earnings could trigger acceleration.
⸻
⚠️ Disclaimer
This is my personal analysis and not financial advice. Please do your own research and manage your risk carefully. 📉📚
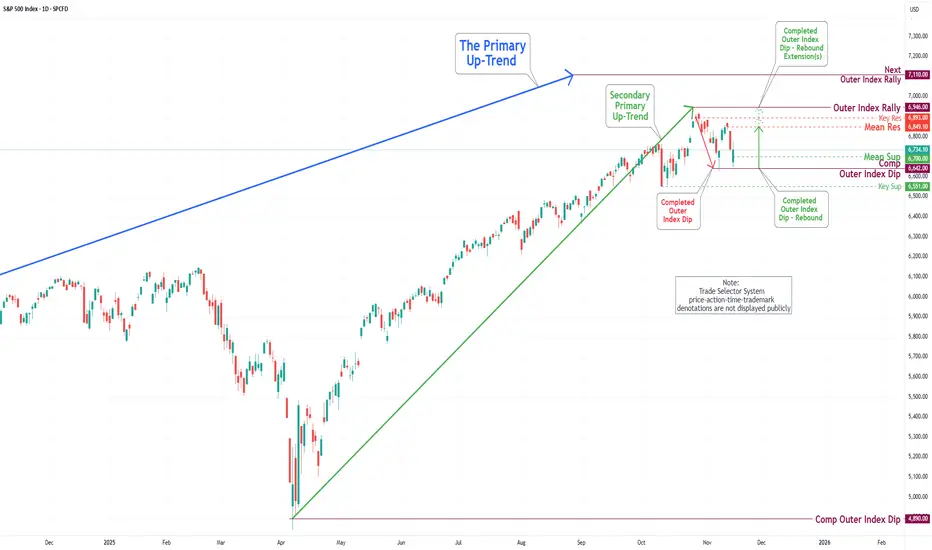
S&P 500 Daily Chart Analysis For Week of Nov 14, 2025Technical Analysis and Outlook:
The most recent trading session exhibited a significant decline in the S&P 500 Index, highlighting the significance of our Key Resistance target, marked as 6893, situated just below the Outer Index Rally 6,946. The index has now retested the Outer Index Dip at 6,642, and it tipped its hand that it wants to go higher. This current position indicates the potential for further upward movement, with the target established at the Mean Resistance level of 6,849 and a well-structured extension towards the Key Resistance level of 6,893, with an ultimate target for the Outer Index Rally set at 6,946.
Nevertheless, it is crucial to acknowledge the possibility of a drawdown in the forthcoming week's trading session, which could nibble at the Mean Support of 6,700, possibly resulting in a further decline to the "Do That to Me One More Time" Outer Index Dip at 6,642 before ultimately resuming an upward trajectory.
Wall Street Weekly Outlook – Week 46 2025 (Nov 10 – Nov 14)📊💥 Wall Street Weekly Outlook – Week 46 2025 💥📊
+ High Probability SMA/EMA Cross-Over Strategy! 💥
📅 November 10 – November 14, 2025
The new trading week is dominated by one crucial question:
Are we heading toward a larger year-end correction in equities, or does the market shift back into risk-on mode? 🚀📉📈
In this video, I break down the most important market drivers for the weeks ahead. 🎥📊
Lean back and get a structured overview of which levels matter now, how hedge funds are adjusting their exposures, and which setups look most attractive from a mean-reversion perspective. 🧠💼
💡 Bonus Lessons:
EMA/SMA cross-over strategy for equities, three key macro focus themes, and actionable mean-reversion setups. ⚡️
📘 Topics covered in this weekly outlook:
+ SMA/EMA Cross-Over Strategy 🧠💼
Best,
Meikel

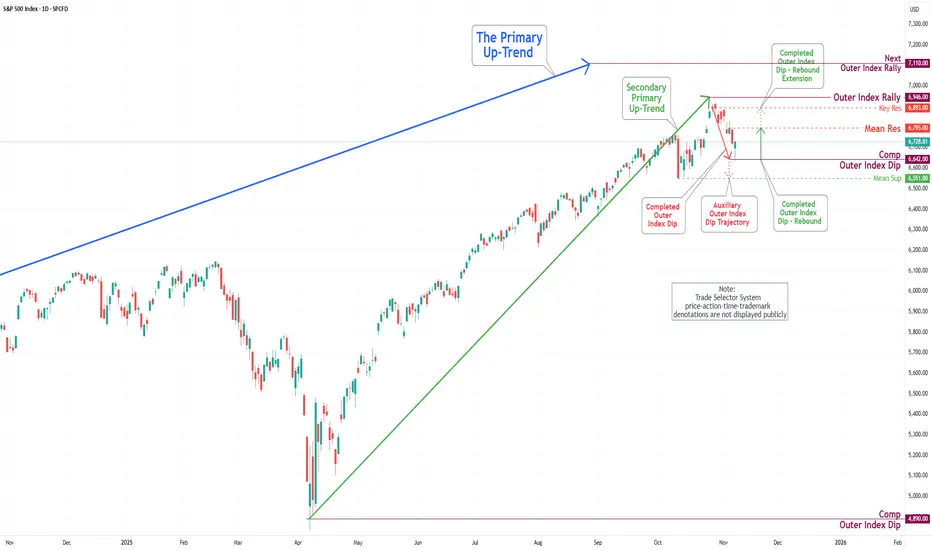
S&P 500 Daily Chart Analysis For Week of Nov 7, 2025Technical Analysis and Outlook:
During the recent trading session, the S&P 500 Index experienced a notable decline, underscoring the significance of our key target, situated at the Mean Support level of 6,740. The index has now completed the Outer Index Dip at 6,642. This positioning indicates the potential for further upward movement, with the target established at the Mean Resistance level of 6,795. The prevailing trend suggests a well-structured extension towards the Key Resistance level of 6,893, with an ultimate target for the Outer Index Rally set at 7,110.
Nevertheless, it is crucial to acknowledge the possibility of a substantial drawdown in the forthcoming week’s trading session. This may lead to a retest of the Outer Index Dip at 6,642, possibly resulting in a further decline to the Mean Support level at 6,551 before ultimately resuming an upward trajectory.
Wall Street Weekly Outlook - Week 45 2025 [03.11.- 07.11.2025]Wall Street Weekly Outlook - Week 45 2025
📅 November 3 – November 7, 2025
Let’s kick off an exciting new trading week — and a brand-new trading month! 🚀
Seasonal factors often play a major role in November and December, and I’ll break them down for you in this week’s video. 🎥📈
Sit back, enjoy the overview, and dive into the world of banks, hedge funds, and institutional flows — with exclusive insights into how the pros are positioned right now. 🧠💼📊
💡 Bonus segments: Strategies, setups & market psychology — everything you need to know for the week ahead. ⚡️
📘 Topics covered in this week’s outlook:
🏛 Seasonality in the Nasdaq:
🥇 Seasonality in Gold:
... and many more charts & concepts in the video! 🎬📊
💬 I’m looking forward to your questions, comments, and an active discussion here on TradingView!
👋 Best,
Meikel

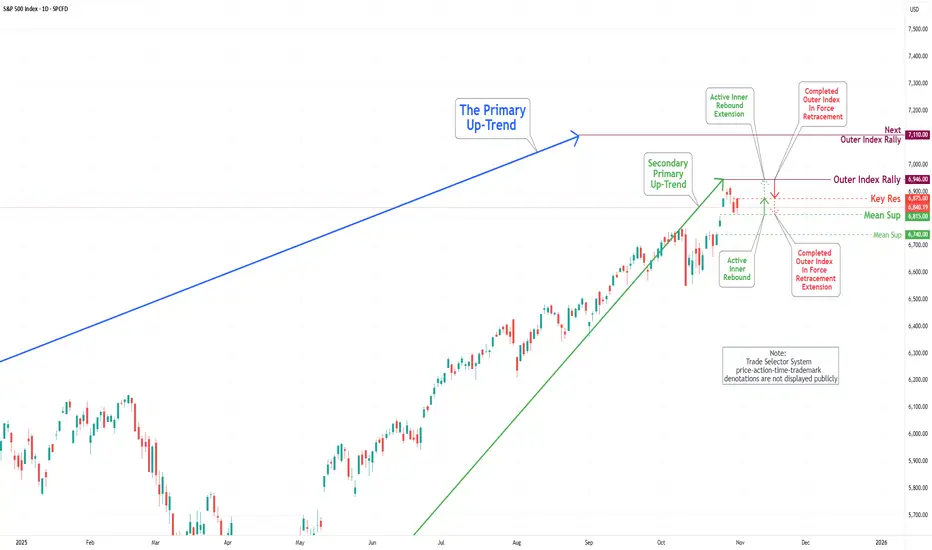
S&P 500 Daily Chart Analysis For Week of Oct 31, 2025Technical Analysis and Outlook:
During the recent trading session, the S&P 500 Index continued its wild ride, highlighting the importance of our key target, which stands as an Outer Index Rally at 6946. Fluctuations between the Mean Support at 6815 and the Key Resistance at 6875 serve as a crucial threshold for market participants. This positioning suggests the potential for further upward momentum, as the prevailing trend indicates a well-structured Active Inner Rebound extension toward the target stated above.
Nevertheless, it is essential to acknowledge the possibility of a sustained and gradual pullback within the current Active Inner Rebound zone. Such a pullback may retest the Mean Support at 6815 and could decline further to the Mean Support at 6740 before ultimately resuming an upward trajectory.
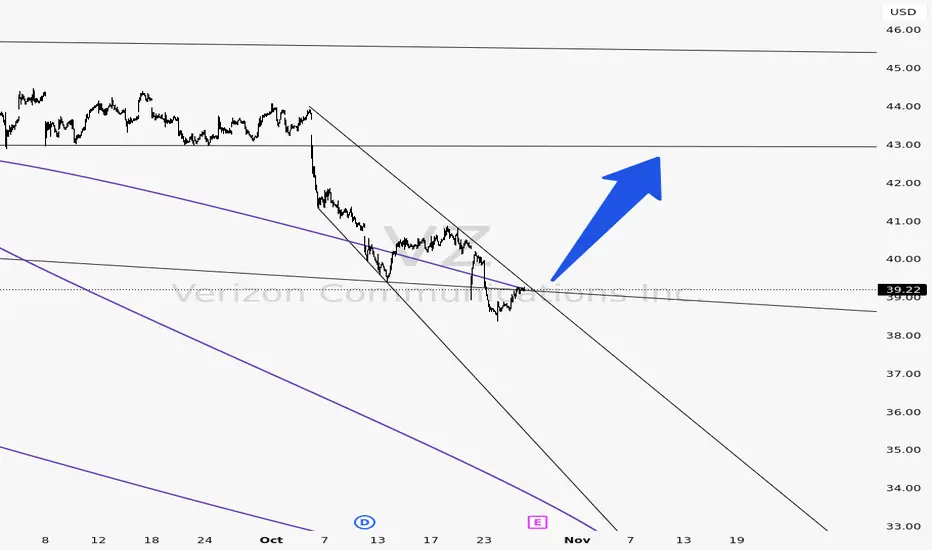
Verizon (VZ) — Bullish Reversal Setup! Smart Money Loading UpNYSE:VZ is showing early signs of a **trend reversal** after a long downtrend. The price is now testing the **upper boundary of its descending channel**, signaling potential breakout momentum.
Technicals suggest that **smart money might be accumulating** before a larger move toward the $45 range.
💎 The structure looks strong — a clean breakout and retest could confirm a new bullish leg.
Watch for volume confirmation and hold above resistance for a possible **momentum breakout**.
“They laughed when NYSE:VZ dipped. They won’t laugh when it rips.” - twitter (WallStMessiah)
👇 Drop your thoughts below — breakout or fakeout?
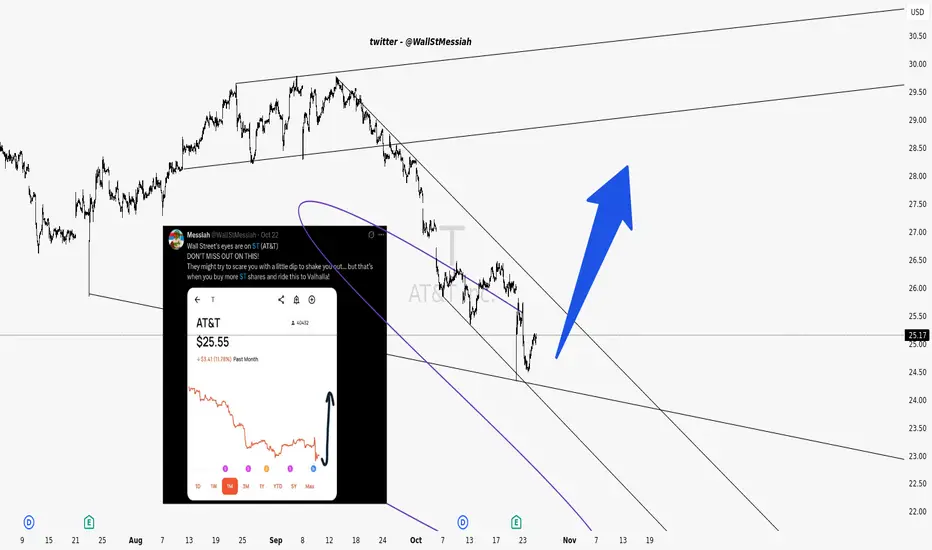
AT&T (T) — Bullish Breakout Setup Forming! Don’t Miss This MoveWall Street’s been sleeping on $T for too long…
After weeks in a clear downtrend, AT&T is showing serious signs of a **reversal setup** within this falling channel.
👀 Watch how price is bouncing off the lower trendline with strong volume support — a classic accumulation signal.
💪 Break above this descending resistance, and we could easily see momentum carry it back toward the **$27–$30 range**.
Remember, fear shakes out weak hands — conviction brings rewards.
NOTE - Chart breakdown inspired by WallStMessiah on twiter
🚀 If you’re watching $T, drop your thoughts below — breakout or fakeout?
S&P 500 Daily Chart Analysis For Week of Oct 24, 2025Technical Analysis and Outlook:
The most recent trading session exhibited significant volatility in the S&P 500 Index, marked by pronounced price fluctuations between the Mean Resistance at 6671 and the Key Resistance at 6753. This range served as a crucial threshold for market participants, prompting a series of rapid buying and selling that influenced the index's overall wild movement. Ultimately, this price action culminated in a breakout above the completed Outer Index Rally at 6768.
At present, the index is situated at the newly established Key Resistance level of 6800, which lies just below the historical high of 6807. This positioning indicates the potential for further upward momentum, as the prevailing trend suggests a well-structured Active Inner Rebound extension toward the Next Outer Index Rally target of 7110.
Conversely, it is imperative to acknowledge the possibility of a sustained, steady-to-lower pullback from the Key Resistance level of 6800 to Mean Support 6740 for the Secondary Primary Up-Trend to continue on its path.
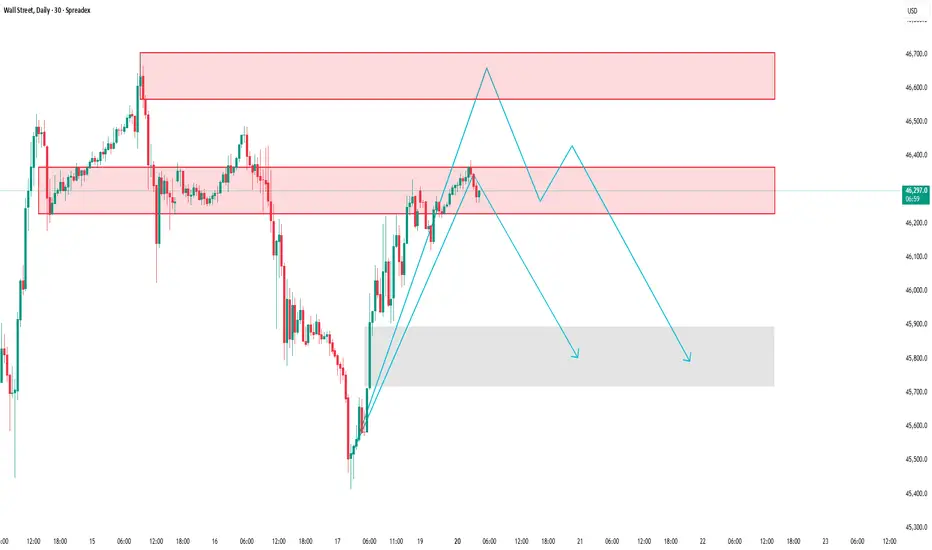
US30: Testing key supply zone, possible pullback ahead
SPREADEX:DJI – Price Reaction at Supply Zone | Possible Short-Term Correction
Timeframe: 30-Minute Chart
Analysis Style: Price Action • Supply & Demand • Market Structure
________________________________________
🧭 Market Context
After a strong rally from the lower demand zone, the Wall Street Index is now approaching a key supply area that previously triggered a sharp downward move.
At this level, sellers are beginning to step in again, and price momentum is starting to fade — suggesting a potential short-term correction ahead.
________________________________________
🧩 Market Structure & Key Zones
🔴 Supply Zone #1: 46,227 – 46,370
→ The first reaction zone, where previous selling pressure started a strong decline.
🔴 Supply Zone #2 (Major Resistance): 46,572 – 46,700
→ A higher zone where strong bearish momentum originated before.
🟢 Demand Zone: 45,900 – 45,700
→ A previous accumulation area that fueled the recent bullish leg — possible support zone if price pulls back.
________________________________________
📊 Current Price Behavior
Price has reached the 46,227 – 46,370 area and is showing signs of buyer exhaustion.
Multiple rejections and slower bullish candles near this level indicate a loss of momentum.
If the short-term bullish structure breaks, the market may shift toward a corrective phase.
________________________________________
📉 Trading Scenario
✅ Primary Scenario (Bearish Reaction Expected):
1. Price might retest 46,229–46,400 once more.
2. Failure to break above this level could lead to a downward “push.”
3. Target zone for the correction: 45,800 – 45,900.
⚙️ Alternative Scenario:
• If price closes clearly above 46,400, the short-term bearish setup becomes invalid.
• In that case, the next resistance to watch lies around 46,600 – 46,700.
________________________________________
💡 Conclusion
The Wall Street Index is currently testing a critical supply zone with visible signs of slowing momentum.
Unless bulls regain control above 46,400, the market may experience a short-term pullback toward the lower demand area.
This analysis is for educational and informational purposes only — not financial advice. Always confirm with your own price action and risk management strategy before making any trading decisions.
Please like and comment below to support our traders. Your reactions will motivate us to do more analysis in the future 🙏✨
Harry Andrew @ ZuperView
Wall Street Weekly Outlook - Week 43 2025 [20.10.- 24.10.2025]Wall Street Weekly Outlook - Week 43 2025
Every week I release a Wall Street Weekly Outlook that highlights the key themes, market drivers, and risks that professional traders are watching.
+Extra lessons:
Any questions? Drop a comment or reach out directly.
Best,
Meikel

S&P 500 Daily Chart Analysis For Week of Oct 17, 2025Technical Analysis and Outlook:
Last week's trading session was marked by significant volatility in the S&P 500 Index, which experienced pronounced price fluctuations following its descent to our established Mean Support level of 6550. This level served as a critical point for market participants, triggering a series of rapid buying and selling activities that contributed to the index's overall gyrations.
At present, the index is positioned just below the newly established Mean Resistance level of 6671, which indicates the potential for further upward momentum, as this trend suggests a Well-built extension to the subsequent Mean Support level of 6550.
Contrariwise, it is essential to acknowledge and be aware of the emergence of the unexpected market drop to the Mean Support 6550, 6485, 6371, and the Key Support level of 6240. Additionally, it's crucial to take note of the Auxiliary Inner Rebounds occurring at these critical points.

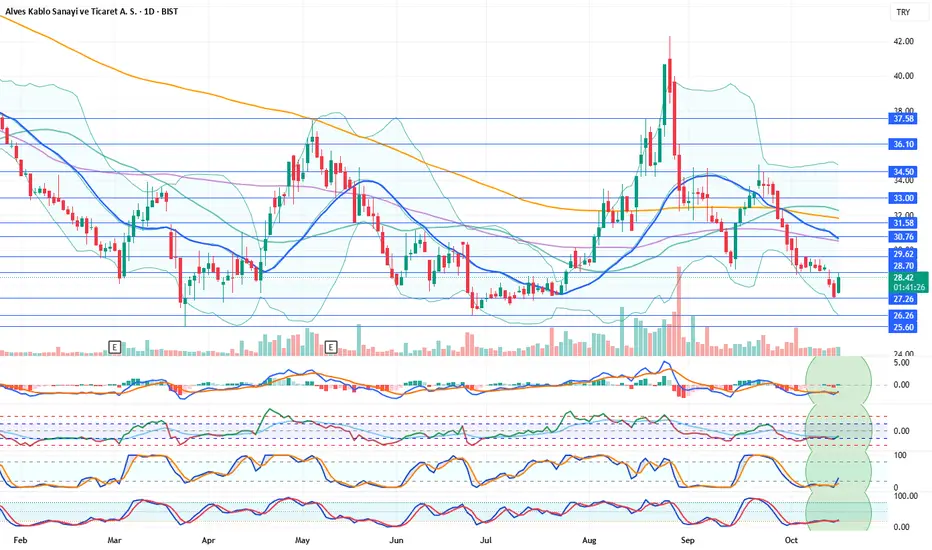
ALVES Stock Analysis & CommentaryALVES Stock Analysis & Commentary
Daily technical indicators are positive. After forming support at 27.26, the stock appears to be recovering from that level. With indicators also showing positive momentum, we believe further recovery may occur. In a potential bullish scenario, the stock could have a chance to test the 21-day moving average (30.68).
Resistance Levels: 28.70 – 29.62 – 30.76 – 31.58
Support Levels: 27.26 – 26.26 – 25.60
We’d appreciate it if you could boost our posts and share them on your social media. 🚀
Legal Disclaimer:
The information, comments, and recommendations contained herein do not constitute investment advice. Investment advisory services are provided only within the framework of an investment advisory agreement to be signed between the investor and authorized institutions such as brokerage firms, portfolio management companies, and non-deposit banks.
The opinions expressed here are personal views and may not be suitable for your financial situation, risk profile, or return preferences. Therefore, no investment decisions should be made based solely on the information and opinions presented on this page.
Bitcoin Bulls Eye Bounce, Though Bears Could Be Lurking AboveUsing correlations with Wall Street indices, I outline why I think Bitcoin could be in for a bounce - though its rally could be limited before new lows are seen.
Matt Simpson, Market Analyst at City Index and Forex.com
