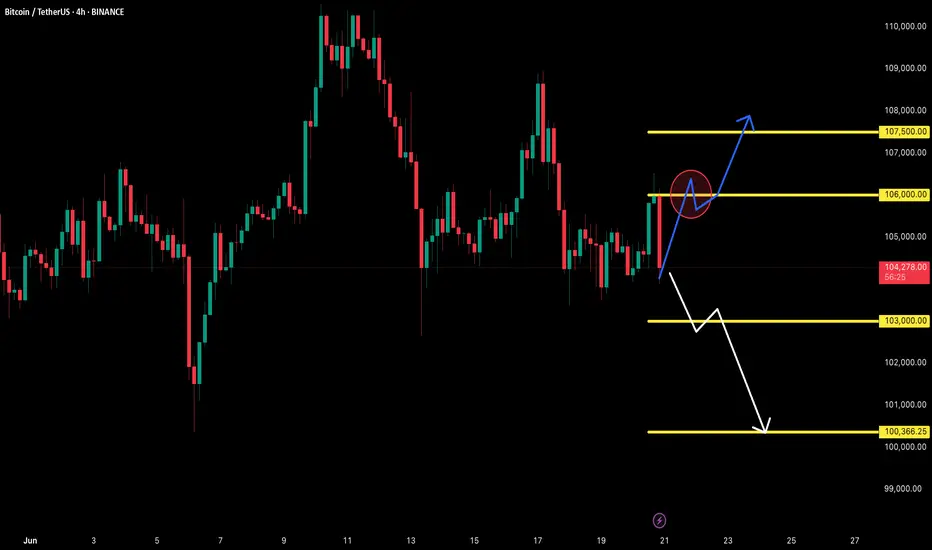
Bitcoin Hits PRZ — Is This the Perfect Short Entry?Bitcoin ( BINANCE:BTCUSDT ) has entered the Potential Reversal Zone (PRZ) after a strong bullish impulse , testing the confluence of Daily Resistance(3) .
In terms of Elliott Wave analysis , the market seems to have completed a complex WXY corrective structure , with the recent rally likely representing the final wave Y . This makes the current zone highly reactive for potential reversal .
I expect Bitcoin to retrace toward the CME Gap($105,075-$105,055) and possibly continue downward toward the Support zone($104,380-$103,060) and Cumulative Long Liquidation levels if the sellers regain momentum .
Cumulative Short Liquidation Leverage: $107,568-$106,601
Cumulative Long Liquidation Leverage: $105,360-$104,784
Cumulative Long Liquidation Leverage: $103,937-$103,217
Note: It is better to look for short positions at the Potential Reversal Zone (PRZ) or if Bitcoin touches $104,780 before reaching PRZ. That is why I chose to label this analysis as ''Short".
Note: If Bitcoin can touch $107,620 , there is a possibility of breaking the resistance lines and increasing further.
Please respect each other's ideas and express them politely if you agree or disagree.
Bitcoin Analyze (BTCUSDT), 1-hour time frame.
Be sure to follow the updated ideas.
Do not forget to put a Stop loss for your positions (For every position you want to open).
Please follow your strategy and updates; this is just my Idea, and I will gladly see your ideas in this post.
Please do not forget the ✅' like '✅ button 🙏😊 & Share it with your friends; thanks, and Trade safe.
Wave Analysis

BITCOIN → Possibility of retesting 100K. Buyer weakeningBINANCE:BTCUSDT.P is in consolidation after the rally stalled due to the exhaustion of the bullish driver. The price updates local lows and starts looking at 100K
Bitcoin is under pressure after the escalation of conflict in the middle east and after the FOMC speech. There is also another observation: large companies, politicians, funds and investors have long and aggressively motivate the crowd to buy, verbally confirming that they bought dozens and hundreds of bitcoins at a time for the balance, but bitcoin is standing still and updating lows. At the same time, various services such as "cryptorank" fix bullish sentiment at the lows. The market either lacks liquidity or something more unpredictable is happening (chart drawing????)
Technically, bitcoin is following the behavior of the SP500 quite strongly, which closes Friday's session quite weak and close to key support, which could trigger a continuation of the decline. Bitcoin won't stay on the sidelines and could also follow the index....
Resistance levels: 104K, 105K, 106K
Support levels: 102K, 100.6K, 97.5K
The price is coming out of the “symmetrical triangle” consolidation breaking the support, thus confirming the bearish mood. After a small correction after a false breakdown of 102500 the price may again return to storm (retest) the level under market pressure, which will only strengthen expectations of further decline. The target is liquidity 100600 - 100K. From 100K rebound and growth is possible.
Regards R. Linda!

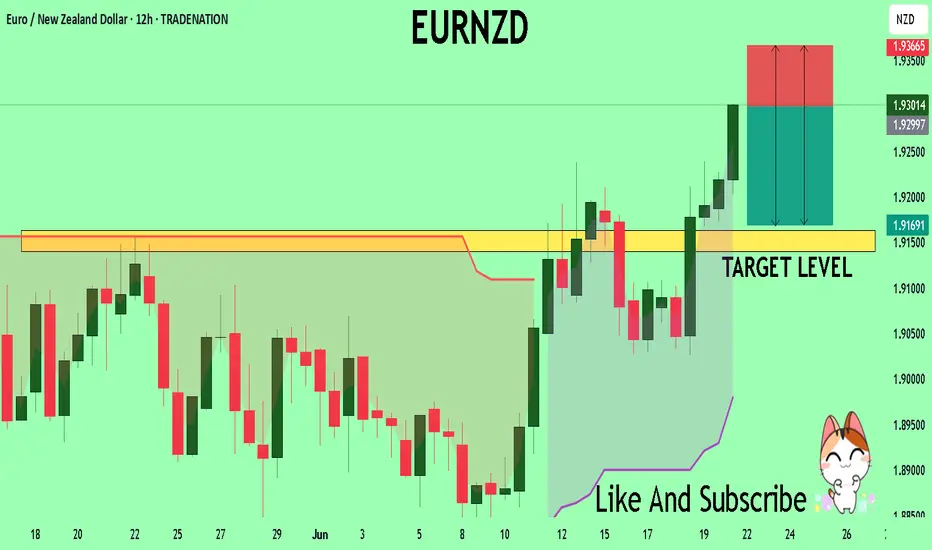
EURNZD Buyers In Panic! SELL!
My dear friends,
EURNZD looks like it will make a good move, and here are the details:
The market is trading on 1.9299 pivot level.
Bias - Bearish
Technical Indicators: Supper Trend generates a clear short signal while Pivot Point HL is currently determining the overall Bearish trend of the market.
Goal - 1.9163
Recommended Stop Loss - 1.9366
About Used Indicators:
Pivot points are a great way to identify areas of support and resistance, but they work best when combined with other kinds of technical analysis
Disclosure: I am part of Trade Nation's Influencer program and receive a monthly fee for using their TradingView charts in my analysis.
———————————
WISH YOU ALL LUCK
#CHFJPY: Last Idea +200 pips, Another 500+ Remanning Hey there!
Our CHFJPY trade is going swimmingly, with a +200 pips move already under our belt. We’re expecting the price to keep climbing and potentially reach 185 or more. Feel free to set your own take profit and stop loss based on your own trading strategy. We’re just sharing this exciting opportunity with you.
Good luck and happy trading! 😊
We really appreciate your unwavering support! ❤️🚀
If you’d like to lend a hand, here are a few ways you can contribute:
- Like our ideas
- Comment on our ideas
- Share our ideas
Cheers,
Team Setupsfx_

Gold: Breakout and Potential Retrace!!Hey Traders, in today's trading session we are monitoring XAUUSD for a selling opportunity around 3,390 zone, Gold was trading in an uptrend and successfully managed to break it out. Currently is in a correction phase in which it is approaching the retrace area at 3,390 support and resistance zone.
Trade safe, Joe.

Gold - Pump to a new all-time high, buy here!GOLD is super bullish, and this trend should continue until around 7000 USD, so another few years! In one of my next analyses, I will tell you why. In this short-term analysis, we want to buy GOLD at the strong support of this blue ascending channel.
On the chart we can see that GOLD has been moving in the ascending parallel channel and recently broke out of the bullish flag on the higher timeframe. The bullish flag was retested on June 9, so we don't need to go down anymore. Btw, that was a great buying opportunity! Soon the price will hit the support trendline of the ascending channel, so prepare your buying orders!
What is the profit target? The first strong resistance is the previous all-time high level. If you want to take profit here, that's definitely reasonable. Always set your profit targets slightly below major levels and resistances. From the Elliott Wave perspective, it is obvious that GOLD is starting something huge here! We are in an impulse wave 3 of 5.
Always use fibonacci extension / retracement to find strong levels on charts. I recommend using only 0.382, 0.618, and 1 levels. When we take a Fibonacci extension tool from wave (1) to wave (2) we can see that the first strong level is at 3490 with the 1:1 Fibonacci extension.
Trading tip at the end: "Develop a trading strategy that aligns with your trading persona and risk tolerance." Leave a comment with your gold prediction, I am curious! Trading is not hard if you have a good coach! This is not a trade setup, as there is no stop-loss or profit target. I share my trades privately. Thank you, and I wish you successful trades!

AUDUSD Analysis – Falling from the Rising WedgeAUDUSD pair broke below an ascending wedge, a bearish reversal pattern.
Clean rejection from 0.6518, with lower highs and new lower lows confirming bearish momentum.
Price is now sitting below former trendline support, retested and respected as resistance.
Bearish target points toward 0.6400–0.6380 zone, aligning with recent swing lows.
Risk invalidation sits above 0.6520, where structure fails.
Technical Bias: Bearish
Target: 0.6400
Stop-loss zone: Above 0.6520
📊 Current Bias: Bearish
🔍 Key Fundamentals Driving AUDUSD
AUD Fundamentals (Weakening):
Australian jobs data was mixed, and wage growth has plateaued.
RBA remains cautious, with expectations for rate cuts later in 2025.
AUD pressured by China growth risks and weak commodity demand.
Geopolitical drag: Australia-China tensions and weak Chinese retail data from 618 Festival dampen AUD outlook.
USD Fundamentals (Resilient):
USD remains bid on risk-off flows, especially after weak global data and ongoing Middle East tensions.
Fed remains reluctant to cut fast despite disinflation signs – supports the USD.
US data is mixed, but rate cut odds are declining (only one expected in 2025 now per dot plot).
⚠️ Risks to This Bearish View
If China announces new stimulus, AUD could rebound sharply.
A dovish surprise from the Fed (e.g. Powell softening in speeches).
Sharp rebound in risk appetite (e.g. tech-led equity rally).
🗓️ Important Events to Watch
🇨🇳 China industrial profits & PMIs
🇦🇺 RBA Meeting Minutes (July preview hints)
🇺🇸 US Core PCE (June 28)
Global risk tone: watch metals, equities, and geopolitical headlines.
🚀 Which Asset Leads?
AUDUSD is lagging other USD pairs, but will likely lead commodity FX downside if China or metals weaken further.
Watch AUDJPY and EURAUD for further confirmation of risk-off flows and Aussie weakness.

GOLD → Consolidation within a falling wedgeFX:XAUUSD is consolidating. A major player is gathering a trading position inside a wedge ahead of distribution. But the main question is: in which direction?
Gold lost ground again on Friday after mixed holiday trading on Thursday. Traders are waiting for new signals from the Fed and monitoring the situation in the Middle East. Interestingly, gold fell as the conflict escalated further (which is not logical overall). The dollar is in a global bearish trend, and traders are waiting for a decision from Powell (who is under pressure from Trump to cut rates).
Technically, if we look at the wedge, we can see how difficult it is for the market to move. The price is stuck inside the consolidation. The intraday movement is very short, with long tails and a very weak reaction to both false breakouts and level break. Large players are building up positions inside the current channel. This may only hint at the possibility of future implementation (distribution).
Resistance levels: 3360, 3396, 3420
Support levels: 3338, 3320, 3302
On D1 - H4, gold is in a countertrend (bullish trend) correction and is testing the trend support + 0.7 Fibo zone. Below, there are fairly strong areas of interest — 3320 and 3302 — which gold may test before rising. However, within the wedge, there is a fairly high probability of a breakout of resistance and the 3360 level, followed by a rally to the liquidity zone at 3396
Best regards, R. Linda!

EUR-NZD Bullish Breakout! Buy!
Hello,Traders!
EUR-NZD keeps growing and
The pair made a bullish breakout
Of the key horizontal level
Of 1.9270 and the breakout
Is confirmed so we are bullish
Biased and we will be
Expecting a further move up
Buy!
Comment and subscribe to help us grow!
Check out other forecasts below too!
Disclosure: I am part of Trade Nation's Influencer program and receive a monthly fee for using their TradingView charts in my analysis.

Technical + Fundamental Alignment: GBPUSD Short in PlayGBPUSD ( FX:GBPUSD ) is moving near the Resistance zone($1.354-$1,350) and has managed to break the Support line .
In terms of Elliott Wave theory , it seems that GBPUSD has completed the Zigzag Correction(ABC/5-3-5) , we can expect the next five bearish waves .
--------------------------------------------------------
Fundamental Analysis
1-Weak UK Economic Data:
Recent reports including Retail Sales, Industrial Output, and PMIs have come in below expectations.
Labour market is softening, and wage growth is decelerating.
2-Dovish Expectations for BoE:
With inflation cooling down, the Bank of England is expected to hold or even cut rates soon, reducing support for the pound.
3-Stronger USD Outlook
Despite some weaker U.S. data, the Fed maintains a hawkish stance. U.S. retail sales and inflation still support the dollar overall.
4-UK Political Risk
Upcoming UK elections on July 4 are adding uncertainty and downside risk to GBP.
--------------------------------------------------------
I expect GBPUSD to attack at least the Support lines based on the above explanation.
Targets: 1.3
1)1.3353 USD =>Risk-To-Reward: 1.51
2)1.3315 USD =>Risk-To-Reward: 2.00
Note: Stop Loss(SL): 1.3549 USD
Please respect each other's ideas and express them politely if you agree or disagree.
British Pound / U.S Dollar Analyze (GBPUSD), 1-hour time frame.
Be sure to follow the updated ideas.
Do not forget to put a Stop loss for your positions (For every position you want to open).
Please follow your strategy and updates; this is just my Idea, and I will gladly see your ideas in this post.
Please do not forget the ✅' like '✅ button 🙏😊 & Share it with your friends; thanks, and Trade safe.

JULY IS THE ALTCOIN SEASON
"We will witness the last rise at 68, and the altcoin season will follow after that. Be ready."

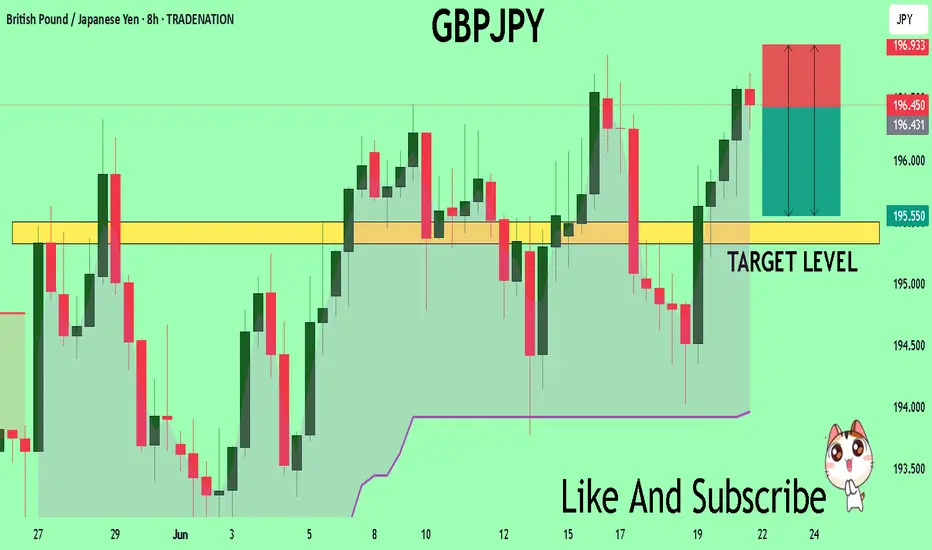
GBPJPY Massive Short! SELL!
My dear subscribers,
This is my opinion on the GBPJPY next move:
The instrument tests an important psychological level 196.43
Bias - Bearish
Technical Indicators: Supper Trend gives a precise Bearish signal, while Pivot Point HL predicts price changes and potential reversals in the market.
Target - 195.50
My Stop Loss - 196.93
About Used Indicators:
On the subsequent day, trading above the pivot point is thought to indicate ongoing bullish sentiment, while trading below the pivot point indicates bearish sentiment.
Disclosure: I am part of Trade Nation's Influencer program and receive a monthly fee for using their TradingView charts in my analysis.
———————————
WISH YOU ALL LUCK
Bitcoin Crash Predicted! Here are the next targets! Bitcoin is crashing as predicted, and here I am showing you the next targets, and the changes in market structure that would make me take profits earlier!
Enjoy and feel free to smash the rocket button if you feel the bearish vibe!

The shift from safe-haven attributes to monetary policy driven!The long-short game of gold prices intensified, the Fed's hawkish signals and the strengthening of the US dollar put pressure on gold prices, and the geopolitical risk premium and inflation expectations formed support. In the short term, the escalation of the Israel-Iran conflict may promote safe-haven buying, but the Fed's policy path and the actual implementation of trade policies will dominate the medium- and long-term trends. Focus on the US policy trends towards Iran, the progress of the Iran nuclear agreement negotiations, and the Fed's inflation response stance in the next two weeks. It is necessary to pay attention to the game between Iran's warnings on third-party intervention and the potential risks of possible US intervention. This uncertainty provides phased support for gold prices.
The intraday trading strategy of gold this trading day, the range and the break need to be paid attention to simultaneously. The current bearish trend continues, the 3385 resistance in the Asian session is effective, and the rebound relies on the 3360-3365 suppression to maintain the high-altitude strategy, and the support below is the 3330-3320 area. Against the background of the continuous downward shift of the center of gravity, 3375-3385 constitutes a short-term key suppression. Before the breakthrough, I suggest maintaining a bearish mindset. Resistance range 3375-3385, support range 3330-3320.
It is recommended to buy gold near 3347 during the day, and take profits in the target range of 3360-3400!
Gold rebounds to the 3360-3365 area and sells. If it breaks through 3365, you can consider covering your position in the resistance area of 3375-3385 and continue to sell. The target is 3340-3320!

Bitcoin hits new uptime milestone!
Bitcoin has traded above $100,000 for more than 40 consecutive days since May 7, a major milestone for the top cryptocurrency, which has also surpassed 6,000 consecutive days of uptime this month.
BTC unaffected by global events
On June 19, Bitcoin recorded more than 40 consecutive days of trading above $100,000, despite uncertainty and heightened geopolitical tensions in the Middle East. According to Coingecko data, May 8 was the last trading day for BTC below $100,000, meaning that as of June 19, it had been above this level for 42 days.
Meanwhile, Blockchair data shows that BTC has been above $100,000 for 43 days, forming a new resistance level, which some technical analysts believe. During this period, BTC hit a new all-time high on May 23, surpassing the milestone previously reached on January 20. As of this writing, the top cryptocurrency is trading just above $104,000, which is familiar territory for BTC in June.
Prior to BTC’s return to six figures in U.S. dollar terms in early May, BTC spent more than 60 days trading below $100,000 amid global market turmoil caused by the trade war sparked by U.S. President Donald Trump’s “reciprocal tariffs.” At the time, BTC’s significant correlation with traditional assets and markets seemed to weaken its claim as a safe haven asset.
However, since dropping below $75,000 on April 7, BTC has trended upward, rising by about 50% to near $112,000 about 45 days later. Since then, BTC has fluctuated between $110,000 and $100,000, with major global events, including Israel’s launch of its attack on Iranian nuclear facilities, seemingly failing to push it below $100,000, according to Coingecko data.
Not only has the flagship cryptocurrency remained above $100,000 for more than 40 consecutive days, it also celebrated a significant operational achievement in June: more than 6,000 days of continuous uptime.
According to Bitbo, the Bitcoin network has been operating uninterruptedly since its inception at 02:54:25 GMT on January 3, 2009. Aside from two isolated incidents in its early history (one in 2010 and one in 2013), this uptime record has remained unimpaired, highlighting the network’s unparalleled resilience and robustness. These recent achievements further solidify BTC’s place as a stable and enduring digital asset and an increasingly established player in the global financial landscape.

Bitcoin Eyes $108K as Momentum Gathers on Lower Timeframes
Bitcoin traded between $105,971 and $106,032 over the past hour, with a market cap of $2.10 trillion and 24-hour volume of $21.88 billion. The price fluctuated between $104,004 and $106,450 over the past 24 hours, reflecting a narrow intraday range consistent with technical uncertainty on larger timeframes.
Analysis of the 4-hour Bitcoin chart shows a weak recovery phase from the recent drop to $103,388. The volume profile shows an ascending candlestick indicating increased interest, accumulation, and momentum. The rounding bottom structure shows a possible shift in short-term sentiment. Buying power is visible in the $105,500 to $106,000 region, especially when $106,500 is breached forcefully.
Bitcoin Price Watch: Bulls Target 108K as Momentum Grows on Lower Timeframes
BTC/USD daily chart on Bitstamp on June 20, 2025.
Technical indicators offer mixed signals. Among oscillators, the Relative Strength Index (RSI), Stochastics, Commodity Channel Index (CCI), Average Directional Index (ADX), and Ultra Oscillator are neutral. However, the Momentum Oscillator shows positive sentiment, while the Moving Average Convergence Divergence (MACD) shows negative reinforcement, highlighting the inherent contradiction in the directional trend. The moving averages (MAs) are generally biased bullish, with most short- to long-term indices and simple moving averages showing positive signals. Notably, only the 30-day simple moving average is contrary to this, with a negative reading.
In conclusion, while the intraday chart shows a constructive tone and provides opportunities for short-term positioning, the broader trend remains directionless with potential bearish risks. Unless Bitcoin reclaims the area above $110,000 with sustained volume, caution is advised. Traders would be wise to maintain tight risk control and focus on intraday momentum trading as the current daily pattern evolves.
Upside view:
If Bitcoin maintains momentum above $106,000 and breaks out of $106,521 convincingly, short-term traders can take advantage of a bullish setup with a target of $108,000 to $109,000. The alignment of buy signals from most moving averages further supports the potential for continued upside provided that the breakout is confirmed by volume and $107,500 is re-reached on a daily close. However, a failure to break out of $107,500 or a fresh sell-off around $106,450 could trigger a pullback to the $103,000 to $100,426 support zone, especially if the volume decreases at this point and the MACD confirms the bearish momentum.
NASDAQ Potential UpsidesHey Traders, in the coming week we are monitoring NAS100 for a buying opportunity around 21,500 zone, NASDAQ is trading in an uptrend and currently is in a correction phase in which it is approaching the trend at 21,500 support and resistance area.
Trade safe, Joe.

AUDCAD BEARISH SETUPThe 4-hour chart for AUD/CAD shows a well-respected bearish descending channel, where price action remains capped below a strong dynamic resistance. Price recently rejected a key resistance zone near 0.8900, signaling a potential continuation to the downside.
Key Observations:
Bearish Channel Intact: Price continues to respect the upper and lower bounds of the descending channel.
Key Resistance Rejection: The pair tested the 0.8900 resistance area and faced immediate rejection (highlighted in red), forming a lower high.
Break of Trendline: A rising trendline from the recent low has been broken, reinforcing bearish pressure.
Support Zone in Sight: If bearish momentum continues, the next major support lies around 0.8780 – 0.8800, offering a possible target area.
Short-term Setup: Minor upward retracement may retest the broken trendline, but unless 0.8900 is breached, the bias remains strongly bearish.
Conclusion:
AUD/CAD remains under bearish control within the descending channel. The recent rejection from the upper boundary and break of the rising trendline suggest a high-probability move toward the 0.8800 support zone. Traders should look for confirmation of lower highs or bearish engulfing patterns to position short.

Inverse Cocoa?Keeping a close eye on this one. Whilst everyone tries to catch the bottom on an ever falling Nasdaq and tech stocks, the market has had far better trades to offer. I traded JDEP as my inverse Coffee play, now I bring to your attention one of the world's leading confectionery companies being affected by cocoa prices. This name is beared the brunt of a cocoa bull run, but as supply and demand equilibrium is at a better balance, this stock could outperform to the upside.
Keep an eye on cocoa, if price plummets I expect Barry Callebaut to outperform. There's no rush to buy this, we are sitting at historic level of support. I'd like to see some consolidation here before jumping into a trade.
Not financial advice.

GBP/JPY - Breakout Brewing📊 GBP/JPY – Breakout Imminent?
Price is testing key resistance at the top of the range within this ascending channel.
We’re now at a critical decision point:
📈 A clean breakout above this supply zone could send us flying toward the 198.945 target – aligning with the channel top.
📉 A rejection, however, could trigger a drop back into demand at 192.352, offering a solid buy zone for continuation.
🧠 Patience is key here — wait for confirmation. Either way, volatility is expected next. Be ready. 🚨

AUDCAD Will Move Lower! Short!
Please, check our technical outlook for AUDCAD.
Time Frame: 9h
Current Trend: Bearish
Sentiment: Overbought (based on 7-period RSI)
Forecast: Bearish
The price is testing a key resistance 0.885.
Taking into consideration the current market trend & overbought RSI, chances will be high to see a bearish movement to the downside at least to 0.879 level.
P.S
The term oversold refers to a condition where an asset has traded lower in price and has the potential for a price bounce.
Overbought refers to market scenarios where the instrument is traded considerably higher than its fair value. Overvaluation is caused by market sentiments when there is positive news.
Disclosure: I am part of Trade Nation's Influencer program and receive a monthly fee for using their TradingView charts in my analysis.
Like and subscribe and comment my ideas if you enjoy them!

USDCAD Analysis – Breaking the Chains, Eyeing 1.38+USDCAD Price broke out from a long descending channel, followed by two bullish continuation flags – classic breakout-retest pattern.
Price is now pushing above 1.3720, aligning with the 38.2% Fib level of the prior drop.
Next upside targets:
🔹 1.3833 (Fib 61.8%)
🔹 1.3913 (Fib 78.6%)
Clear stop level: below 1.3625 (channel breakout support)
Structure Bias: Bullish continuation. Clean breakout + consolidation = probable impulse toward 1.3830/1.39.
📊 Current Bias: Bullish
🔍 Key Fundamentals Driving USDCAD
USD Drivers (Neutral to Bullish):
Fed held rates, dot plot shows only 1 cut in 2025, but Powell's tone leaned dovish.
US Retail Sales + PPI were weak, but safe-haven USD demand persists due to geopolitical risks and equity volatility.
Market reassessing Trump election risk, Fed independence, and inflation stickiness.
CAD Drivers (Bearish):
Oil prices are volatile due to Middle East tensions, but weak demand caps upside.
Canada’s CPI softened, BoC already delivered a dovish cut earlier this month.
CAD under pressure due to dovish BoC outlook and fiscal concerns (gov't budget deficits expanding).
CAD is also suffering from reduced foreign investment flows.
⚠️ Risks to Watch
Oil price spikes (especially if Strait of Hormuz risk escalates) may boost CAD short-term.
A sharp reversal in DXY or Fed commentary shift toward aggressive easing.
Weak US data next week (Core PCE especially) could unwind USD momentum.
🗓️ Upcoming Events to Watch
US Core PCE (June 28) – critical inflation gauge for the Fed
BoC Business Outlook Survey
Oil Inventories + Global energy sentiment
Geopolitical: Israel–Iran updates and Canada’s fiscal signals
🏁 Which Pair Leads the Move?
USDCAD is leading commodity crosses as CAD weakness broadens. Watch USDCAD and GBPCAD for signs of CAD softness before others like AUDCAD/NZDCAD follow.

BTC - Key Battle Between Bulls and Bears – Symmetrical TriangleBitcoin ( BINANCE:BTCUSDT ) is currently consolidating within a Symmetrical Triangle , showing indecision among Bulls and Bears around the Support zone($104,380-$103,060) and just above the 50_SMA (Daily) .
From an Elliott Wave perspective, the current range may represent a WXY corrective structure . The market seems to be waiting for a breakout direction , potentially aiming to complete wave 5 after this correction.
The Monthly Pivot Point($103,300) and the presence of significant Cumulative Liquidation Leverage Zones (both Long and Short ) are key liquidity magnets to watch in the short term .
I expect Bitcoin to re-attack the Support zone($104,380-$103,060) AFTER breaking the lower line of the Symmetrical Triangle Pattern and decline to the targets I have outlined on the chart.
Note: Stop Loss: $106,703 = Worst Stop Loss(SL)
Please respect each other's ideas and express them politely if you agree or disagree.
Bitcoin Analyze (BTCUSDT), 1-hour time frame.
Be sure to follow the updated ideas.
Do not forget to put a Stop loss for your positions (For every position you want to open).
Please follow your strategy and updates; this is just my Idea, and I will gladly see your ideas in this post.
Please do not forget the ✅' like '✅ button 🙏😊 & Share it with your friends; thanks, and Trade safe.
