xauussWe will probably have a minor correction in this direction. We will wait for the trend line to break, if it breaks, the targets will be touched in order.
Wave Analysis

NZDUSD Potential LongsThis is how I'd be looking at NZDUSD for longs, not a high probability setup, considering current bearish structure but good RR makes it worth the risk

GBPAUD - Trading The Range - AGAIN!Hello TradingView Family / Fellow Traders. This is Richard, also known as theSignalyst.
📈GBPAUD has been hovering within a big range.
Last week, as per our previous analysis, GBPAUD rejected the upper bound of the range and traded lower.
This week, GA is retesting the lower bound of the range acting as a support.
As long as the support holds, we will be looking for longs on lower timeframes, targeting the upper bound of the range.
📚 Always follow your trading plan regarding entry, risk management, and trade management.
Good luck!
All Strategies Are Good; If Managed Properly!
~Rich
Disclosure: I am part of Trade Nation's Influencer program and receive a monthly fee for using their TradingView charts in my analysis.

GBPUSD Short tradeCable is actually on the way to sink on the current week. I have my target at the key level 1.340.

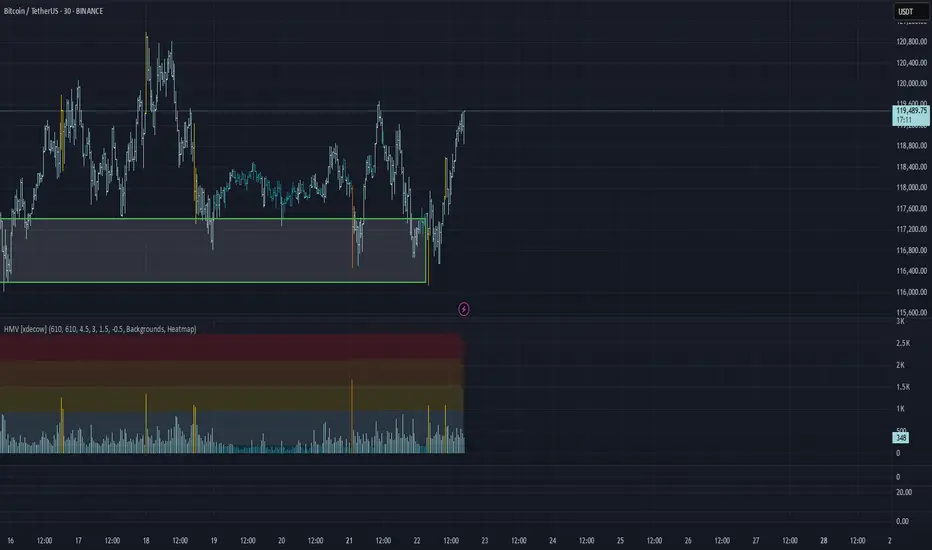
BITCOIN → Consolidation, retest of 120K. Correction of dominanceBINANCE:BTCUSDT , after a rapid rally and touching 123K, rolled back and entered consolidation, giving altcoins a chance. At the same time, Trump signed new crypto laws, but will these laws open new doors?
On June 18, the GENIUS Act was signed. Information can be found in the sources, but there is no direct reference to BINANCE:BTCUSDT.P , except perhaps indirectly: increased confidence in the crypto market, increased liquidity, possible new rules, and pressure on decentralized assets. Bitcoin has not always grown on positive news; more often it has been a deep pullback and liquidation before the momentum.
Technically, Bitcoin is currently consolidating, and I would highlight several key areas: the upper range is 120K-120.9K. The zone between these levels is particularly important, as this is where buyers were previously liquidated and sellers gathered (liquidation is possible).
The bottom is 117K (confirmed) - 116.2K. There is a liquidity pool on the support side.
additional scenario if the market does not reach resistance and decides to form a long squeeze before growth
Theoretically, I am not yet expecting a breakout and growth of Bitcoin. I think that consolidation may continue for some time, especially against the backdrop of a pullback in altcoins and a deep correction in the dominance index.
Resistance levels: 120100, 120850
Support levels: 117000, 116230
Since the opening of the session, the price has been working off the liquidity capture from 117K. There is a reaction - growth, which could bring the price to the zone of interest at 120K. But the question is: will the price hold in the 120K zone? A false breakout of resistance could trigger a correction to 117-116K. Thus, I expect the market to remain in consolidation for some time or even expand the current trading range...
Best regards, R. Linda!

Elliott Wave Analysis – XAUUSD | July 22, 2025
🔍 Momentum Overview
• D1 timeframe: Momentum has entered the overbought zone, signaling a potential reversal within the next 1–2 sessions. That said, the current bullish leg may still extend — it’s important to wait for tomorrow’s D1 candle close for confirmation. Entering overbought territory is a warning that upside momentum is weakening.
• H4 timeframe: Momentum is currently declining. Unless a strong bullish candle closes above 3391 to trigger a reversal, the price is likely to continue moving sideways or downward today.
• H1 timeframe: There are signs of a bullish reversal. If the price holds above 3385 and posts a strong breakout candle above 3391, it could present a short-term buying opportunity.
🌀 Elliott Wave Structure Update
• Price is consolidating within the 3390 – 3402 range — a key zone to monitor closely.
• The 3380 level is a critical threshold, aligned with the 0.382 Fibonacci retracement of Wave (3). A daily close below this level would raise the possibility that the move is part of a correction rather than Wave 4.
• A flat ABC correction is currently unfolding, with the 1.618 extension of Wave A already reached at 3385.
• If price breaks below 3360, it would overlap with the previous Wave 1, invalidating the current impulsive wave count. In that case, we should consider the potential continuation of a larger abcde triangle correction.
🔗 Momentum & Wave Structure Combined
• H1 is showing early signs of a bullish reversal, but H4 momentum remains bearish. Without a strong breakout candle above 3391, price is likely to drift sideways or lower until H4 reaches the oversold zone.
• Conservative approach: Wait for H4 to enter oversold territory before considering any long positions.
• The ideal buy setup would be a bullish reaction from the 3382 – 3380 zone.
📈 Trade Setup
• Buy Zone: 3382 – 3380
• Stop Loss: 3372
• Take Profit 1: 3402
• Take Profit 2: 3412
• Take Profit 3: 3428

DRIFT/USDT After sweeping liquidity below the critical 0.43 zone, DRIFT has spent the past 19 days rebuilding a strong support base, indicating strong buyer absorption. The consolidation structure suggests accumulation is near completion.
Now the price is gearing up for a potential explosive breakout, with signs pointing toward a large impulse candle formation.
First Setup:
A clean 70% move is expected from current levels as the first leg of the rally.
Further targets will be assessed once price reaches the 0.77–0.80 zone, where key resistance and profit-taking activity could emerge.

BTC/USDT Analysis: Rotation Continues
Hello everyone! This is a daily analysis from a trader-analyst at CryptoRobotics.
Yesterday, Bitcoin continued to rotate within a narrow sideways range, and so far, there has been no breakout. We retested the lower boundary of the range and once again saw absorption of market selling at that level.
At the moment, the scenario remains valid — we expect a breakout to the upside. Several factors support this outlook: strong defense at the lows, delta absorption across the entire range, and buyer control on the most recent local upward wave.
A less likely scenario is a dip into the lower buy zone, a liquidity grab, and another attempt to move higher.
Buy Zones:
~$115,000 (zone of initiating/pushing volumes)
$110,000–$107,000 (accumulated volumes)
This publication is not financial advice.
USDJPY Will Fall! Sell!
Take a look at our analysis for USDJPY.
Time Frame: 2h
Current Trend: Bearish
Sentiment: Overbought (based on 7-period RSI)
Forecast: Bearish
The price is testing a key resistance 147.628.
Taking into consideration the current market trend & overbought RSI, chances will be high to see a bearish movement to the downside at least to 146.784 level.
P.S
Overbought describes a period of time where there has been a significant and consistent upward move in price over a period of time without much pullback.
Disclosure: I am part of Trade Nation's Influencer program and receive a monthly fee for using their TradingView charts in my analysis.
Like and subscribe and comment my ideas if you enjoy them!

UXLINK ANALYSIS (8H)From the point where we placed the green arrow on the chart, an expanding triangle began, and the pattern completed at the point where we placed the red arrow.
Now, the price seems to be in a correction, which appears to be either a Diametric or Symmetric pattern. Currently, it looks like we are in wave D of this structure.
We expect a drop from the red box. Demand 1 is a temporary rebuy zone, while Demand 2 is a suitable area for a set-and-forget approach with good gains.
Let's see what happens!
For risk management, please don't forget stop loss and capital management
When we reach the first target, save some profit and then change the stop to entry
Comment if you have any questions
Thank You

BTCUSDTBTCUSDT needs some more correction before we continue the same trend.
Disclosure: We are part of a Trade Nation's influencer program and receive a monthly fee for using their Tradingview charts in our analysis.
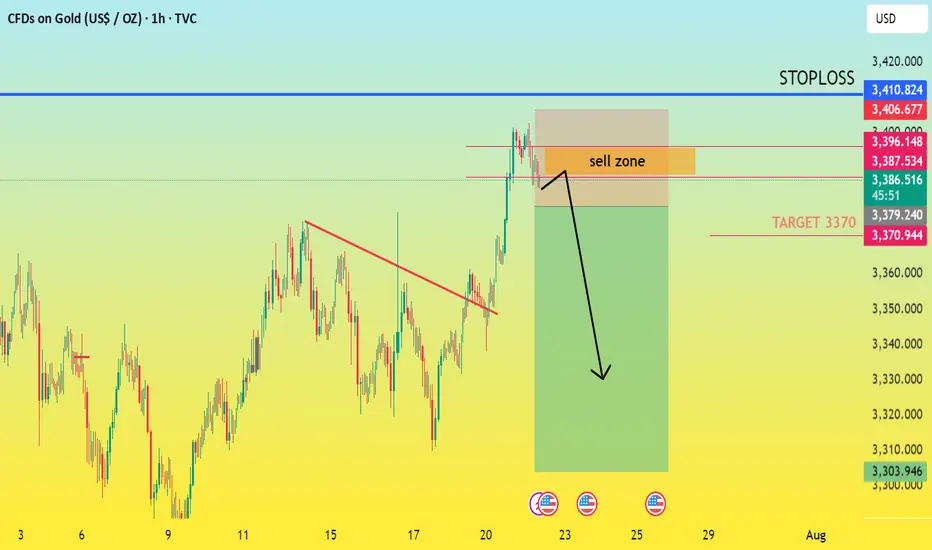
XAUUSD: THE GOLDEN OPPORTUNITY FOR BEARS!FUNDAMENTAL ANALYSIS
Are you ready to capitalize on the impending short-term correction in Gold? XAUUSD is flashing clear sell signals from the 3390 to 3370 zone, setting the stage for a profitable bearish move. Don't miss this chance to ride the downward momentum!
Here's why we anticipate Gold's descent to 3370:
The Ceiling is Here: Key Resistance at 3390-3400
Gold has been grappling with strong resistance in the 3390-3400 area. This level represents a critical juncture where bullish momentum is consistently capped. Multiple attempts to breach this ceiling have been met with selling pressure, indicating a clear supply zone. As long as XAUUSD remains beneath this formidable barrier, the path of least resistance is to the downside
Technical Exhaustion: After a notable rally, Gold is showing signs of being overextended. The recent consolidation around current levels suggests buyer exhaustion and a lack of conviction to push higher. This often precedes a short-term correction to digest recent gains.
Dollar Strength Brewing: While the US Dollar has seen some recent weakness, there are underlying signals that a rebound could be on the horizon. A strengthening Greenback typically exerts downward pressure on dollar-denominated assets like Gold, making it more expensive for international buyers and reducing demand. Keep an eye on the DXY for confirmation.
Targeting the Support Zone: The Path to 3370
Our immediate target for this bearish impulse is the key support zone around 3370. This level is not arbitrary; it aligns with:
Previous Price Action: This level has historically acted as both a support and resistance pivot, making it a significant area of interest for market participants.
Fibonacci Retracement Levels: Depending on the swing high from which we're retracing, 3370 often aligns with a significant Fibonacci retracement level, indicating a probable area for a bounce or temporary halt in the downtrend.
Dynamic Support (e.g., Short-term EMAs): Falling prices are likely to find their first significant bounce around the 50-period Exponential Moving Average (EMA) on shorter timeframes, which often converges around this 3370 level.
Trade with conviction and precision! The bearish short trend in XAUUSD from 3390 offers a compelling opportunity for sellers to target the 3370 support. Prepare to act decisively as the market unfolds.
ENTRY POINT 3390
TARGET 3370
STOPLOSS 3400
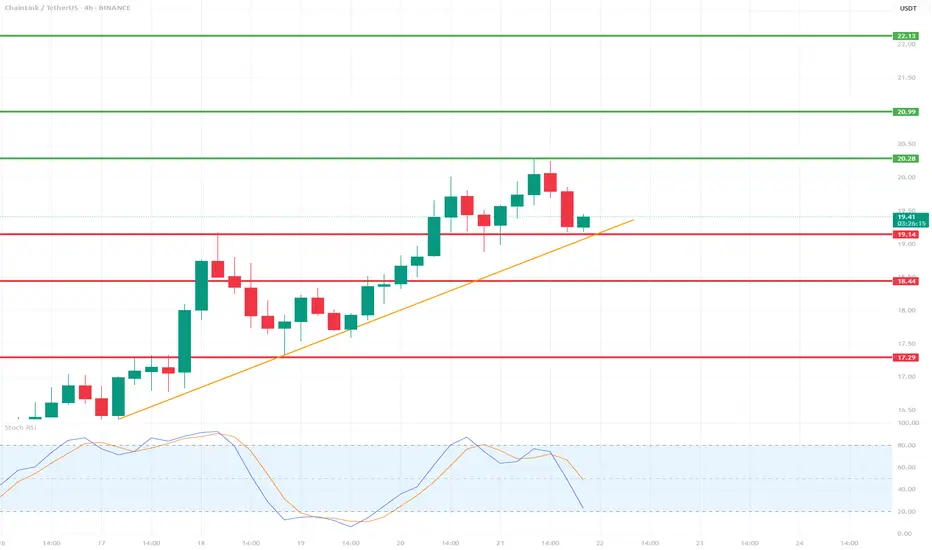
LINK/USDT 4H Chart📉 Indicators and Market Structure:
🔶 Trend:
Current trend: up, as long as it remains above the trend line and the 19.14 USDT level.
Local resistance: 20.28 USDT (recent high).
Next resistances: 20.99 USDT and 22.13 USDT (green lines).
Supports: 19.14 USDT, 18.44 USDT, 17.29 USDT (red lines).
🔷 Stochastic RSI (lower indicator):
Located in the oversold zone (below 20) and starting to reverse upward.
Potential signal of buying pressure if the %K and %D lines cross bullishly.
🧠 Scenarios:
✅ Bullish scenario (trend continuation):
Bounce from the trend line and the 19.14 level → breakout of 20.28 → test of 20.99–22.13.
Confirmation will be a clear bullish candle with high volume and a Stochastic RSI cross up.
❌ Bearish scenario (trend break):
Closing below the trend line and the 19.14 level → correction towards 18.44, and then even to 17.29.
An oversold RSI could support continued declines if a rebound does not occur.
📌 Summary:
Currently, the key level is the trend line and support at 19.14 USDT.
The market is waiting for a reaction – a rebound or a downward breakout.
Stochastic RSI suggests a possible rebound, but candlestick confirmation is needed.
BUY BTCUSD now for 4h time frame bullish trend continuation BUY BTCUSD now for 4h time frame bullish trend continuation ...............
STOP LOSS: 115,836
This buy trade setup is based on hidden bullish divergence trend continuation trading pattern ...
Always remember, the trend is your friend, so whenever you can get a signal that the trend will continue, then good for you to be part of it
TAKE PROFIT : take profit will be when the trend comes to an end, feel from to send me a direct DM if you have any question about take profit or anything...
Remember to risk only what you are comfortable with... trading with the trend, patient and good risk management is the key to success here

CAVA - Setting up good for a runCAVA looks good here, ambiguously looking like a bear flag though.
But if it holds these levels can see a good run upto 100+
Target 1 - 100
Target 2 - 110
Target 3 - 130

GBPUSD CONTINUE?Please be advice what I am writing or making ideas is base only on my understanding on market, were all not the same ideology on how market works. so I am sharing only what I know.
On trading with capital trade only what you can afford to loss.
THis is my view on this pair, I think we see a continuation on the upside to redistribute at higher timeframe.
1.39 for new high. but it would redistribute after this high?
what's your thoughts on this?
THis is not a financial advice.
Trade only at your own understanding.
FOllow for more.
ciaoooooo

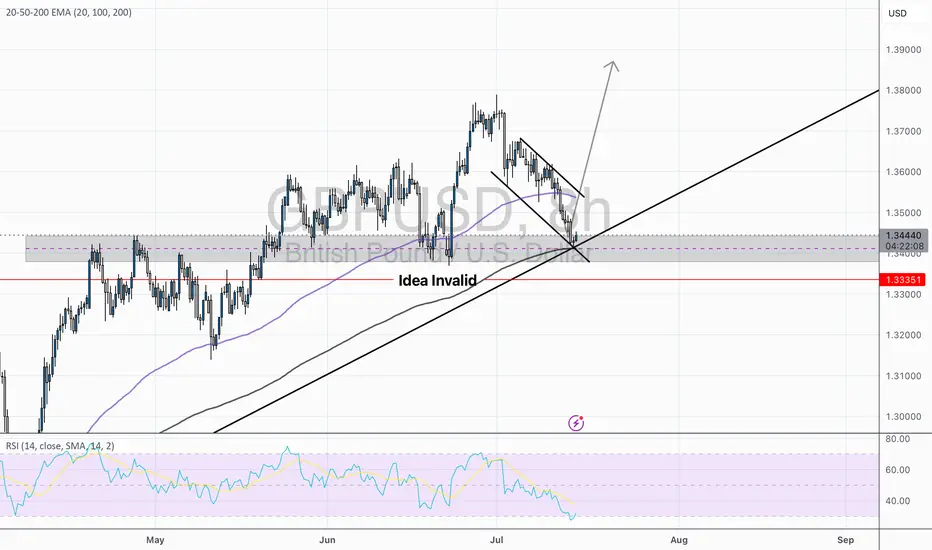
GBP/USD — Potential Bullish Reversal Setup | Long Bias Above Sup🧠 Thesis:
GBP/USD is showing early signs of a potential bullish reversal from a key confluence zone. While price has recently tested short-term descending channel, we’re currently testing a strong ascending trendline support and prior demand zone. This setup offers a favorable long-risk scenario — so long as price remains above 1.3335 (invalid level).
🔍 Technical Breakdown:
Descending Channel: Price has been in a corrective downward channel since early July. This pullback appears orderly and corrective rather than impulsive.
Support Zone: We are seeing strong reactions from the 1.3400–1.3440 area, which aligns with:
Previous consolidation zone (mid-May).
200 EMA on the 4H.
Long-term ascending trendline support (from April lows).
Bullish RSI Divergence: RSI is testing oversold territory (~32) with potential for bullish divergence forming — a classic early signal for a bounce.
EMA Cluster: 50 EMA has been breached but price is testing the 200 EMA as last-resort dynamic support. If held, this further adds to the bullish case.
🧭 Scenarios:
✅ Bullish Bias (Preferred)
If price holds above the trendline support and breaks out of the descending channel, we could see a bullish impulse toward:
🎯 TP1: 1.3600 (prior structure)
🎯 TP2: 1.3770 (trendline extension & fib confluence)
Confirmation trigger: Break and close above 1.3500 resistance (channel breakout).
❌ Invalidation:
A decisive break below 1.3335 (marked in red) invalidates this idea and shifts bias back to bearish — potential deeper pullback toward 1.3200s.
⚠️ Risk Management:
Entry zone: 1.3430–1.3450 (near support)
Stop loss: Below 1.3335
Risk-reward: >2.5:1 on a successful breakout
📝 Conclusion:
This is a classic trend-continuation play with clean structure and a logical invalidation point. The market is offering a textbook “buy-the-dip” scenario off strong multi-timeframe support. Patience is key — wait for confirmation before sizing in.
EUR/USD – Falling Wedge at Major Fibonacci Zone | Bullish ReversAfter a strong mid-June rally, EUR/USD has pulled back into a key fib cluster, showing early signs of reversal from a classic falling wedge pattern — often a precursor to bullish breakouts.
Technical Breakdown:
📉 Descending Trendline
🔍 Fibonacci Confluence:
Price is reacting from the 0.5-0.618 – 0.705 zone (1.16421-1.15969), aligning perfectly with historical demand and the golden zone of the fib retracement.
Just below sits the 0.79 fib (1.15339), which also marks our invalidity level for this idea — a deep but powerful retracement if tested.
💡 RSI:
While still below 50, it has created a hidden bullish divergence between July 12–17, hinting that momentum is flipping back to bulls.
🧠 Educational Insight:
This setup combines Trendlines, Fibonacci retracement theory, and EMA dynamics to build a multi-layered trade thesis — the type of confluence we look for at Wright Way Investments.
Price doesn’t just reverse because it hits a fib level. But when structure, EMAs, and RSI align — the odds increase significantly.
📈 Trade Setup (Idea-Based, Not Financial Advice):
Long Entry Zone: Current area (1.159–1.161), with confirmation above 1.1626
Invalidation: Clean break & close below 1.15339
Target Zones:
🎯 TP1 – 1.1642 (50 fib & retest zone)
🎯 TP2 – 1.1686 (38.2 fib)
🎯 TP3 – 1.1755 (Weekly Resistance)
📌 Summary:
EUR/USD is forming a textbook reversal setup, supported by fib precision and EMA alignment. Patience is key — but the ingredients are here for a strong bullish continuation.

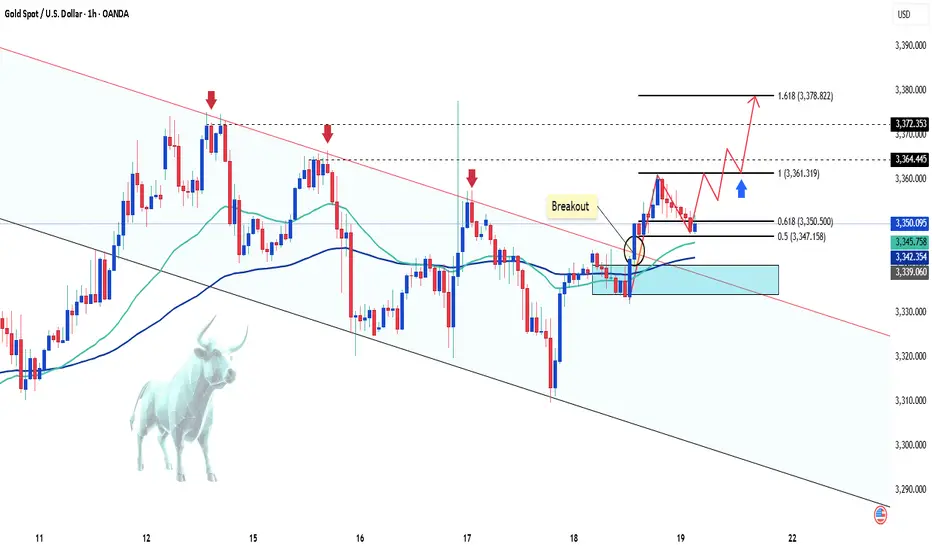
Gold Sees Mild Increase as USD WeakensGold ended Friday's session with a slight increase, regaining the 3350 USD level and recovering over 100 pips by the end of the day.
The weakening of the US Dollar (USD) allowed XAU/USD to rise modestly. Concerns about US President Donald Trump's erratic trade policies and their potential impact on the global economy further supported the precious metal.
In the short term, the technical chart shows gold breaking out of the downward channel and starting an upward wave. The price is currently adjusting at 3350 USD, which coincides with the 0.618 Fibonacci retracement level and the EMA zone, suggesting the potential for further price increases from this level, with targets towards key resistance levels.
Key resistance levels: 3160, 3172, and 3378 USD.
Support zones: 3350, 3340, 3331 USD.
XAUUSD critical area, both sides are possiblecorrection waves are always complicated and messy often changes direction too often, goes up and down in a wide range either triangle, wedge or some sort of zigzag, internal waves usually goes as abc, wxy, wxyxz type of correction waves and it may seem like ended many times in the subwaves. so often confused with many other ideas. i believe correction continues yet criticals levles to watch 3307-3419 brake side will determen the future of gold.
my 3250 target already achieved but i expect another one, shor term targets 3250-3205 mid term targets 3119-3070-3050
daily candle body above 3420 invalidates short ideas.

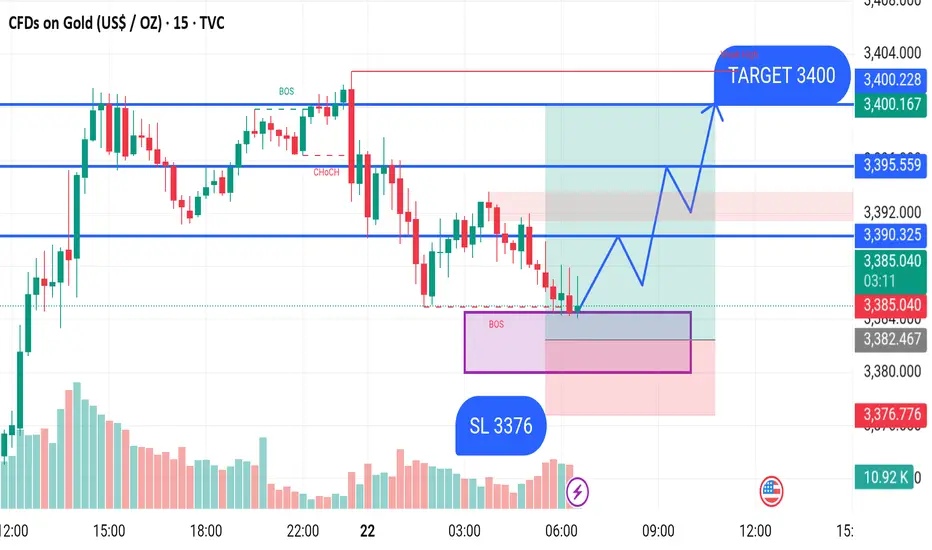
GOLD BUY M15 Gold (XAUUSD) Analysis – 15-Minute Timeframe
Date: July 22, 2025
The chart shows a bullish setup for Gold after a recent market structure shift. The price created a Break of Structure (BOS) followed by a Change of Character (CHoCH) indicating potential bullish momentum.
Currently, price is reacting from a demand zone (highlighted in purple) after a BOS on the lower side, suggesting a possible reversal.
Entry Zone:
Around 3382–3384
Stop Loss (SL):
Below the demand zone at 3376
Target:
3400 (previous swing high / weak high level)
Key Resistance Levels:
3390.32
3395.55
3400.22 (Target zone)
Bias: Bullish
If the price holds above the 3380 support and respects the demand zone, a bullish move toward the 3400 target is expected.
Weekly Stock Pick: ORCL (Update)Hello Traders!
I'm providing an update to the ORCL trade idea from Monday July 21st. Here's what I'm watching:
- Price to open lower from Monday's close
- Rebalancing in the highest daily Bullish Order Block near $239
- A hammer or dojji candle on higher volume
- Potential confluence with the daily 9 ema, trendline support and higher low on the options chart
Cheers,
DTD
__________________________
Financial Risk Disclaimer |
DISCLAIMER: I am not a financial adviser. The videos on my channel are for educational and entertainment purposes only. I'm just showing you guys how I invest and day trade, but remember, investing of any kind involves risk. Your investments are solely your responsibility and not mine. While day trading can bring substantial gains, it can also bring serious losses! So make sure you do your research to fully understand the market before diving in. The possibility exists that you could sustain a loss of some or all of your initial investment, and therefore should not invest money that you can't afford to lose. The fluctuation of the market can work for you or against you. You should carefully consider your investment objectives and experience before deciding to trade in the market. Again, what you invest in is solely your responsibility.

Trump firing Jerome is bullish for $OPEN - Trump firing Jerome is bullish for physical assets like real estate, gold, materials.
- Trump would most likely appoint a FED chair which will lead to lower interest rates.
- Lower Interest rates (Macro tailwinds) + Improving business model (fundamentals) + technical breakout = 🚀
