NZDUSD My Opinion! BUY!
My dear subscribers,
My technical analysis for NZDUSD is below:
The price is coiling around a solid key level - 0.6015
Bias - Bullish
Technical Indicators: Pivot Points High anticipates a potential price reversal.
Super trend shows a clear buy, giving a perfect indicators' convergence.
Goal - 0.6043
My Stop Loss - 0.5999
About Used Indicators:
By the very nature of the supertrend indicator, it offers firm support and resistance levels for traders to enter and exit trades. Additionally, it also provides signals for setting stop losses
Disclosure: I am part of Trade Nation's Influencer program and receive a monthly fee for using their TradingView charts in my analysis.
———————————
WISH YOU ALL LUCK
Wave Analysis

XLM Stellar (XLM) Strategic Partnerships
Stellar boasts a strong network of partnerships with major financial and technology institutions, strengthening its position in cross-border payments and decentralized finance. Here are the most prominent of these partnerships and their impact:
1. Partnerships with Global Financial Institutions
- Mastercard: 🌟
Goal: Integrate Stellar technology into Mastercard Crypto Credit solutions to facilitate secure peer-to-peer transfers.
Impact: Promote acceptance of XLM in everyday transactions and expand its use among consumers.
- Franklin Templeton: 🌟
Goal: Use the Stellar network to manage the US Government's OnChain Fund (assets over $270 million).
Impact: Increase institutional confidence in Stellar as a transparent and low-cost asset management platform.
- MoneyGram: 🌟
Goal: Enable stablecoin transfers (such as USDC) across the Stellar network, while supporting cash withdrawals and deposits at MoneyGram branches globally.
Impact: Expanding financial services in developing regions, particularly Africa and Latin America.
2. Partnerships with technology and payment platforms
- Circle (USDC): 🤖
Goal: Issuing the USDC stablecoin on the Stellar network, enhancing network liquidity and facilitating cross-currency exchanges.
- IBM: 🤖
Goal: Developing the global payment network "WorldWire" using the Stellar core protocol.
- Visa: 🤖
Goal: Supporting Visa cards linked to Stellar wallets, particularly in emerging markets such as Kenya and the Philippines.
3. Partnerships with innovative institutions
- Paxos: 🏬
Goal: Accelerating the adoption of regulated stablecoins for financial institutions via Stellar.
- Deloitte: 🏬
Goal: Developing blockchain solutions to improve the efficiency of financial operations.
- ZettaBlock: 🏬
Goal: Simplify building applications on Stellar through innovative developer tools.
👐 Marketing Strategies and Ecosystem Adoption
Stellar relies on three main pillars to expand its impact:
1. Focus on Financial Inclusion
Emerging Markets:
Stellar targets regions with weak banking sectors (such as Africa) through partnerships with platforms like Tala and Solar, which provide Stellar-based digital wallets.
Incentive Programs:
The Stellar Development Foundation (SDF) offers grants to developers to build payment applications and DeFi projects on the network, such as the Brilliant on Stellar Challenge.
2. Enhancing Decentralized Finance (DeFi) Infrastructure
Upgrading Smart Contracts (Soroban):
Stellar launched the Soroban platform in 2025 to support more complex smart contracts, designed in Rust to ensure security and efficiency.
Cooperation with OpenZeppelin to audit smart contract security.
Attracting Stablecoins:
New stablecoins like USDY (from Ondo) are joining the network to enhance liquidity.
3. Expanding Institutional Partnerships
Leveraging Big Brands:
Stellar uses its partnerships with Mastercard and Franklin Templeton as case studies to convince other institutions to join.
Focusing on Central Bank Digital Currencies (CBDCs):
Stellar partners with governments like Ukraine (via the Stellar Aid Assist program) to efficiently distribute financial aid.
Impact of Partnerships on XLM Price and Adoption
Payment Partnerships: Increased daily trading volume ($256 million), strengthening XLM's position as a bridge for small-value transfers.
Decentralized Finance: Attracting new projects like DEXs and NFTs, transforming Stellar into a full-fledged DeFi platform.
Stablecoins: Increased USDC liquidity on the network, reducing XLM's dependence on market volatility.
Competitive Challenges
Competing with XRP:
Ripple offers similar cross-border payment solutions, but Stellar excels with its broader institutional partnerships and energy efficiency.
Regulatory Fluctuations: Restrictions on stablecoins (such as USDC) may impact network growth. BINANCE:XLMUSD.P

CLSK / 2hAs illustrated on the chart above, NASDAQ:CLSK revealed that wave a of (y) in an expanding leading diagonal, which highly confirms that a relatively deep correction in wave ii (circled) is well underway, as anticipated.
Wave Analysis >> The retracement of wave b should have completed its second subdivision down, and the last one in 5% >> retrace up is now expected. The retracement target >> 9.51
The anticipated decline by 17% as the last subdivision >> wave c of (y) would follow very soon and finally will conclude the entire correction in Minute degree wave ii(circled).
The Retracement Targets >> 7.93 >> 7.84
Trend Analysis >> After the completion of the entire correction in the Intermediate degree wave (2), the trend will turn upward to an impulsive third wave in the same degree.
#CryptoStocks #CLSK #BTCMining #Bitcoin #BTC

RIOT / 2hAs anticipated in the prior NASDAQ:RIOT 's analysis, the expected decline of the diagonal's 5th wave has begun its way down, with just 8% lies ahead.
Wave Analysis >> The leading expanding diagonal in Minor degree wave A, as the first subdivision of the ongoing correction in wave (2), quite well indicates that a relatively deep correction in wave (2) might be thoroughly developed.
Trend Analysis >> The trend is correcting down in the Intermediate degree wave (2), which will take a few weeks to develop.
The retracement targets >> 8.76 >> 8.20 >> 7.93 >> 7.67
#CryptoStocks #RIOT #BTCMining #Bitcoin #BTC

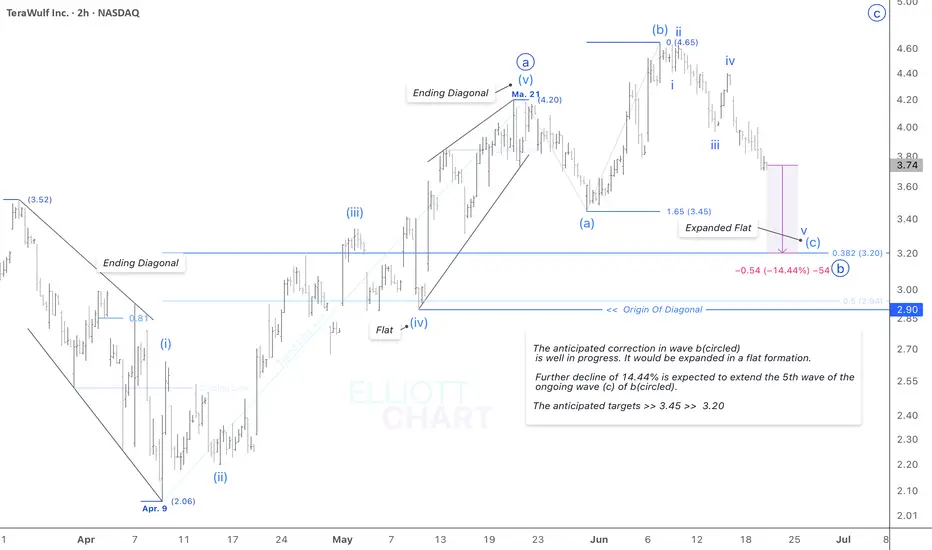
WULF / 2hAccording to the prior NASDAQ:WULF analysis, wave (c) started to extend in its 5th subdivision. It's now anticipated to further decline by 14.44% to complete the expanding flat formation as the entire correction in wave b(circled) over the next week.
The Retracement Targets >> 3.45 >> 3.20
Trend Analysis >> The trend will turn upward soon to a Minute degree impulsive wave c(circled) after completion of correcting down in the same degree wave b(circled).
#CryptoStocks #WULF #BTCMining #Bitcoin #BTC
EUR-CHF Resistance Ahead! Sell!
Hello,Traders!
EUR-CHF keeps growing
But a strong horizontal
Resistance level is ahead
Around 0.9443 so after
The retest we will be
Expecting a local pullback
And a local bearish correction
Sell!
Comment and subscribe to help us grow!
Check out other forecasts below too!
Disclosure: I am part of Trade Nation's Influencer program and receive a monthly fee for using their TradingView charts in my analysis.

NZD-USD Bearish Breakout! Sell!
Hello,Traders!
NZD-USD broke out of the
Rising channel and then made
A bearish breakout of the
Horizontal key level too
Around 0.0602 which is
Now a resistance, then
Made a pullback and retest
And is going down again which
Reinforces our local bearish bias
And we will be expecting a
Further bearish move down
Sell!
Comment and subscribe to help us grow!
Check out other forecasts below too!
Disclosure: I am part of Trade Nation's Influencer program and receive a monthly fee for using their TradingView charts in my analysis.

BTC Experiencing Retracement: Bound for Mid to Lower 90k Range?Bitcoin appears to have officially commenced its retracement.
The yellow-box support zone around 96k-92k may serve as a key level to watch, though a dip as low as 90k wouldn’t be out of the question.
As shown by the provisional Elliott Wave count labeled corrective wave ABC, I interpret this as a short- to mid-term correction. While Wave C can take various forms, this scenario anticipates a typical diagonal triangle structure.

AIRBNB LONGAirbnb to reach ATH in the coming years like previous major tech IPOs (goes down first years then back to ATH).

Oscar Long and StrongI've been long since $11.40, tight stop loss was placed below the demand zone. Strong reaction to the upside, a very good trade on this stock with the earnings release today. If you look at my charts you will understand why I longed this at the golden pocket, one of my favoured trade setups.

Not BullishWhen Carvana finishes this completely manipulated bullrun, it will be devastating. Typically extended 5th waves will correct at a minimum back down to wave 2 of said 5th wave. That means $50.
The stock was in an expanding formation which it broke out from and then failed back into. Very bearish. That is also the same type of pattern that Bitcoin displayed years ago before a major bear market. I think the top is in here, but we'll see.
To get that crash down to $50, something will have to come out in the news most likely about Carvana's stock manipulation and the ghost companies they are using to inflate cash flows. That is purely just a theory though. Perhaps they are squeaky clean and it's totally justified that their stock rose as much as it has, but...I'm not in that camp.
Not to mention all the upper management basically sell their stocks every week. Tens of millions of dollars are being siphoned out by the board and upper management almost every single week. The CEO by himself is cleaning house almost every other day lately. www.sec.gov

Analysis of the latest gold trend on June 20:
1. 🔍 News interpretation
This week, gold continued to pull back, especially in the Asian session on Friday, which once fell to a one-week low, and the overall performance was weak. It was mainly affected by the following key factors:
1. The Fed's policy stance continued to be hawkish (bad news)
This week's FOMC meeting kept interest rates unchanged;
The dot plot shows that there will only be two interest rate cuts by the end of 2025;
And postponed the expectation of further interest rate cuts in 2026-2027;
This move strengthened the expectation of "long-term high interest rates" and formed a systematic suppression on gold prices.
2. The US dollar index fluctuated and fell (short-term bullish)
The US dollar index hit a stage high at the beginning of this week and then fell back;
The correction of the US dollar index provided some support for gold prices and eased downward pressure.
3. Geopolitical and risk aversion factors are still fermenting (limiting the decline)
The situation in the Middle East continues to be tense;
There is uncertainty in the outlook for global trade;
The market's risk aversion demand is still there, becoming an important support for gold prices.
✅ Comprehensive judgment: The hawkish stance of the Federal Reserve dominates the market, and gold is under pressure and falls in the short term; risk aversion provides bottom support for it, and the overall long and short positions are intertwined, with weak fluctuations as the main trend.
2. 📊 Technical trend analysis
1. Overview of the current structure
This week, gold failed to continue its upward trend after reaching 3450;
Friday's intraday decline to the 3342-3345 range just tested the lower edge of the 4-hour upward channel;
The current trend shows a technical pattern of "weak highs - limited rebounds - weak fluctuations".
2. Key technical signals
Cycle Indicator status Interpretation
Weekly MACD dead cross is approaching, medium- and long-term bearish is being confirmed
Daily kinetic energy column turns into a negative line, bullish energy is weakened, bearish is dominant
1 hour fast and slow lines dead cross, located below the 0 axis, short-term selling signal is strengthened
3. Support and resistance analysis
Current support level: 3342 (lower edge of the channel), if it breaks down, the decline may be expanded to 3250;
Upper resistance level: 3368-3378 range (previous rebound high point), with obvious pressure;
If it falls below 3342, the space below will be reopened, and the potential decline may reach 100 US dollars.
III. 🎯 Operation strategy suggestions
The current market is volatile and weak. It is recommended to continue to adopt the strategy of high-short as the main and low-long as the auxiliary to flexibly respond to fluctuations.
✅ Short on rebound 3372–3378 Stop loss above 3385 Target 3335–3320 Trend is bearish, short on pressure
✅ Support light position to try long 3325–3330 Stop loss 3320 Target 3360–3370 Short-term game rebound, fast in and fast out
⚠️ Risk warning: If it falls rapidly and breaks through 3342, it is necessary to quickly adjust the long position and stop going long, and beware of inertial downward break that triggers a deep correction to the 3250 area.
IV. 📌 Focus of the market outlook
Speech by Fed officials and economic data release (expected interest rate direction)
Trends of the US dollar index and US Treasury yields
The impact of the Middle East and global trade situation on risk aversion
Can gold maintain the key technical level of 3342

CYBER/USDTKey Level Zone: 1.300 - 1.320
LMT v2.0 detected.
The setup looks promising—price previously trended upward with rising volume and momentum, then retested this zone cleanly. This presents an excellent reward-to-risk opportunity if momentum continues to align.
Introducing LMT (Levels & Momentum Trading)
- Over the past 3 years, I’ve refined my approach to focus more sharply on the single most important element in any trade: the KEY LEVEL.
- While HMT (High Momentum Trading) served me well—combining trend, momentum, volume, and structure across multiple timeframes—I realized that consistently identifying and respecting these critical price zones is what truly separates good trades from great ones.
- That insight led to the evolution of HMT into LMT – Levels & Momentum Trading.
Why the Change? (From HMT to LMT)
Switching from High Momentum Trading (HMT) to Levels & Momentum Trading (LMT) improves precision, risk control, and confidence by:
- Clearer Entries & Stops: Defined key levels make it easier to plan entries, stop-losses, and position sizing—no more guesswork.
- Better Signal Quality: Momentum is now always checked against a support or resistance zone—if it aligns, it's a stronger setup.
- Improved Reward-to-Risk: All trades are anchored to key levels, making it easier to calculate and manage risk effectively.
- Stronger Confidence: With clear invalidation points beyond key levels, it's easier to trust the plan and stay disciplined—even in tough markets.
Whenever I share a signal, it’s because:
- A high‐probability key level has been identified on a higher timeframe.
- Lower‐timeframe momentum, market structure and volume suggest continuation or reversal is imminent.
- The reward‐to‐risk (based on that key level) meets my criteria for a disciplined entry.
***Please note that conducting a comprehensive analysis on a single timeframe chart can be quite challenging and sometimes confusing. I appreciate your understanding of the effort involved.
Important Note: The Role of Key Levels
- Holding a key level zone: If price respects the key level zone, momentum often carries the trend in the expected direction. That’s when we look to enter, with stop-loss placed just beyond the zone with some buffer.
- Breaking a key level zone: A definitive break signals a potential stop‐out for trend traders. For reversal traders, it’s a cue to consider switching direction—price often retests broken zones as new support or resistance.
My Trading Rules (Unchanged)
Risk Management
- Maximum risk per trade: 2.5%
- Leverage: 5x
Exit Strategy / Profit Taking
- Sell at least 70% on the 3rd wave up (LTF Wave 5).
- Typically sell 50% during a high‐volume spike.
- Move stop‐loss to breakeven once the trade achieves a 1.5:1 R:R.
- Exit at breakeven if momentum fades or divergence appears.
The market is highly dynamic and constantly changing. LMT signals and target profit (TP) levels are based on the current price and movement, but market conditions can shift instantly, so it is crucial to remain adaptable and follow the market's movement.
If you find this signal/analysis meaningful, kindly like and share it.
Thank you for your support~
Sharing this with love!
From HMT to LMT: A Brief Version History
HM Signal :
Date: 17/08/2023
- Early concept identifying high momentum pullbacks within strong uptrends
- Triggered after a prior wave up with rising volume and momentum
- Focused on healthy retracements into support for optimal reward-to-risk setups
HMT v1.0:
Date: 18/10/2024
- Initial release of the High Momentum Trading framework
- Combined multi-timeframe trend, volume, and momentum analysis.
- Focused on identifying strong trending moves high momentum
HMT v2.0:
Date: 17/12/2024
- Major update to the Momentum indicator
- Reduced false signals from inaccurate momentum detection
- New screener with improved accuracy and fewer signals
HMT v3.0:
Date: 23/12/2024
- Added liquidity factor to enhance trend continuation
- Improved potential for momentum-based plays
- Increased winning probability by reducing entries during peaks
HMT v3.1:
Date: 31/12/2024
- Enhanced entry confirmation for improved reward-to-risk ratios
HMT v4.0:
Date: 05/01/2025
- Incorporated buying and selling pressure in lower timeframes to enhance the probability of trending moves while optimizing entry timing and scaling
HMT v4.1:
Date: 06/01/2025
- Enhanced take-profit (TP) target by incorporating market structure analysis
HMT v5 :
Date: 23/01/2025
- Refined wave analysis for trending conditions
- Incorporated lower timeframe (LTF) momentum to strengthen trend reliability
- Re-aligned and re-balanced entry conditions for improved accuracy
HMT v6 :
Date : 15/02/2025
- Integrated strong accumulation activity into in-depth wave analysis
HMT v7 :
Date : 20/03/2025
- Refined wave analysis along with accumulation and market sentiment
HMT v8 :
Date : 16/04/2025
- Fully restructured strategy logic
HMT v8.1 :
Date : 18/04/2025
- Refined Take Profit (TP) logic to be more conservative for improved win consistency
LMT v1.0 :
Date : 06/06/2025
- Rebranded to emphasize key levels + momentum as the core framework
LMT v2.0
Date: 11/06/2025
- Fully restructured lower timeframe (LTF) momentum logic

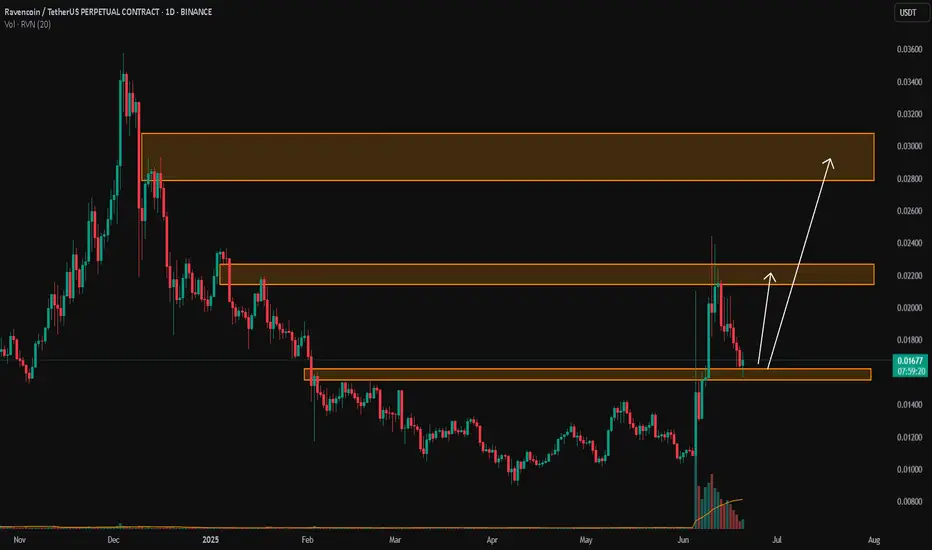
RVN/USDTKey Level Zone: 0.01550 - 0.01620
LMT v2.0 detected.
The setup looks promising—price previously trended upward with rising volume and momentum, then retested this zone cleanly. This presents an excellent reward-to-risk opportunity if momentum continues to align.
Introducing LMT (Levels & Momentum Trading)
- Over the past 3 years, I’ve refined my approach to focus more sharply on the single most important element in any trade: the KEY LEVEL.
- While HMT (High Momentum Trading) served me well—combining trend, momentum, volume, and structure across multiple timeframes—I realized that consistently identifying and respecting these critical price zones is what truly separates good trades from great ones.
- That insight led to the evolution of HMT into LMT – Levels & Momentum Trading.
Why the Change? (From HMT to LMT)
Switching from High Momentum Trading (HMT) to Levels & Momentum Trading (LMT) improves precision, risk control, and confidence by:
- Clearer Entries & Stops: Defined key levels make it easier to plan entries, stop-losses, and position sizing—no more guesswork.
- Better Signal Quality: Momentum is now always checked against a support or resistance zone—if it aligns, it's a stronger setup.
- Improved Reward-to-Risk: All trades are anchored to key levels, making it easier to calculate and manage risk effectively.
- Stronger Confidence: With clear invalidation points beyond key levels, it's easier to trust the plan and stay disciplined—even in tough markets.
Whenever I share a signal, it’s because:
- A high‐probability key level has been identified on a higher timeframe.
- Lower‐timeframe momentum, market structure and volume suggest continuation or reversal is imminent.
- The reward‐to‐risk (based on that key level) meets my criteria for a disciplined entry.
***Please note that conducting a comprehensive analysis on a single timeframe chart can be quite challenging and sometimes confusing. I appreciate your understanding of the effort involved.
Important Note: The Role of Key Levels
- Holding a key level zone: If price respects the key level zone, momentum often carries the trend in the expected direction. That’s when we look to enter, with stop-loss placed just beyond the zone with some buffer.
- Breaking a key level zone: A definitive break signals a potential stop‐out for trend traders. For reversal traders, it’s a cue to consider switching direction—price often retests broken zones as new support or resistance.
My Trading Rules (Unchanged)
Risk Management
- Maximum risk per trade: 2.5%
- Leverage: 5x
Exit Strategy / Profit Taking
- Sell at least 70% on the 3rd wave up (LTF Wave 5).
- Typically sell 50% during a high‐volume spike.
- Move stop‐loss to breakeven once the trade achieves a 1.5:1 R:R.
- Exit at breakeven if momentum fades or divergence appears.
The market is highly dynamic and constantly changing. LMT signals and target profit (TP) levels are based on the current price and movement, but market conditions can shift instantly, so it is crucial to remain adaptable and follow the market's movement.
If you find this signal/analysis meaningful, kindly like and share it.
Thank you for your support~
Sharing this with love!
From HMT to LMT: A Brief Version History
HM Signal :
Date: 17/08/2023
- Early concept identifying high momentum pullbacks within strong uptrends
- Triggered after a prior wave up with rising volume and momentum
- Focused on healthy retracements into support for optimal reward-to-risk setups
HMT v1.0:
Date: 18/10/2024
- Initial release of the High Momentum Trading framework
- Combined multi-timeframe trend, volume, and momentum analysis.
- Focused on identifying strong trending moves high momentum
HMT v2.0:
Date: 17/12/2024
- Major update to the Momentum indicator
- Reduced false signals from inaccurate momentum detection
- New screener with improved accuracy and fewer signals
HMT v3.0:
Date: 23/12/2024
- Added liquidity factor to enhance trend continuation
- Improved potential for momentum-based plays
- Increased winning probability by reducing entries during peaks
HMT v3.1:
Date: 31/12/2024
- Enhanced entry confirmation for improved reward-to-risk ratios
HMT v4.0:
Date: 05/01/2025
- Incorporated buying and selling pressure in lower timeframes to enhance the probability of trending moves while optimizing entry timing and scaling
HMT v4.1:
Date: 06/01/2025
- Enhanced take-profit (TP) target by incorporating market structure analysis
HMT v5 :
Date: 23/01/2025
- Refined wave analysis for trending conditions
- Incorporated lower timeframe (LTF) momentum to strengthen trend reliability
- Re-aligned and re-balanced entry conditions for improved accuracy
HMT v6 :
Date : 15/02/2025
- Integrated strong accumulation activity into in-depth wave analysis
HMT v7 :
Date : 20/03/2025
- Refined wave analysis along with accumulation and market sentiment
HMT v8 :
Date : 16/04/2025
- Fully restructured strategy logic
HMT v8.1 :
Date : 18/04/2025
- Refined Take Profit (TP) logic to be more conservative for improved win consistency
LMT v1.0 :
Date : 06/06/2025
- Rebranded to emphasize key levels + momentum as the core framework
LMT v2.0
Date: 11/06/2025
- Fully restructured lower timeframe (LTF) momentum logic
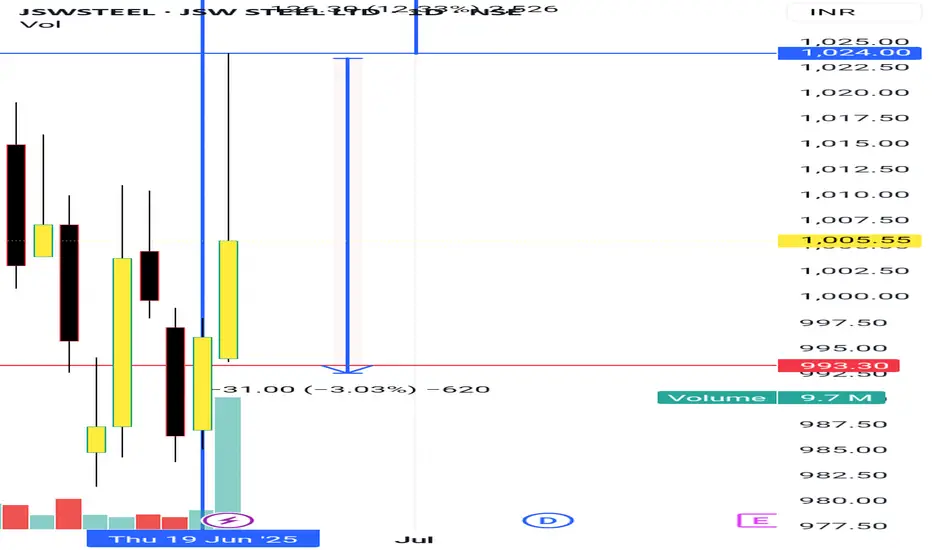
JSW steel
I'm not a SEBI REGISTERED ANYLISIS
just for learning purpose
above the blue line close in D chart candle i will buy and put strictly SL to below red line...once candle close below Red line in D chart...i will close the Trade...
target check the chart
WAIT FOR ENTRY......then after
WAIT FOR TARGET...... or
WAIT FOR STOPLOSS
educational purpose only
oits simple ORB WITH VOLUME BREAKOUT STRATEGY...with small condition apply for selecting the stocks
owt not response for your profit and loss
Eicher Motors
I'm not a SEBI REGISTERED ANYLISIS
just for learning purpose
above the blue line close in D chart candle i will buy and put strictly SL to below red line...once candle close below Red line in D chart...i will close the Trade...
target check the chart
WAIT FOR ENTRY......then after
WAIT FOR TARGET...... or
WAIT FOR STOPLOSS
educational purpose only
oits simple ORB WITH VOLUME BREAKOUT STRATEGY...with small condition apply for selecting the stocks
owt not response for your profit and loss

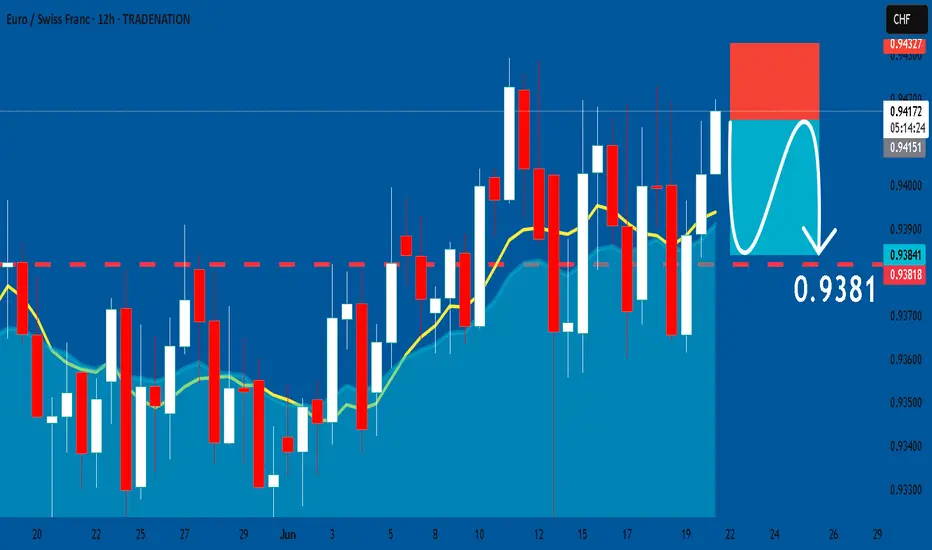
EURCHF: Bearish Continuation & Short Trade
EURCHF
- Classic bearish setup
- Our team expects bearish continuation
SUGGESTED TRADE:
Swing Trade
Short EURCHF
Entry Point - 0.9414
Stop Loss - 0.9432
Take Profit - 0.9381
Our Risk - 1%
Start protection of your profits from lower levels
Disclosure: I am part of Trade Nation's Influencer program and receive a monthly fee for using their TradingView charts in my analysis.
❤️ Please, support our work with like & comment! ❤️

EURUSD Under Pressure! SELL!
My dear friends,
Please, find my technical outlook for EURUSD below:
The price is coiling around a solid key level - 1.1508
Bias - Bearish
Technical Indicators: Pivot Points Low anticipates a potential price reversal.
Super trend shows a clear sell, giving a perfect indicators' convergence.
Goal - 1.1488
About Used Indicators:
The pivot point itself is simply the average of the high, low and closing prices from the previous trading day.
Disclosure: I am part of Trade Nation's Influencer program and receive a monthly fee for using their TradingView charts in my analysis.
———————————
WISH YOU ALL LUCK


US500,DXY, EURUSD & XAGUSD Daily Trade SetupsIn this update we review the recent price action in the SP500, Euro, Dollar & SIlver and identify the next high-probability trade setups and price objectives to target. To review today's video analysis, click here!

Solana Wave Analysis – 20 June 2025
- Solana reversed from support level 141.60
- Likely to rise to the resistance level 163.8
Solana cryptocurrency recently reversed up from the support area located between the strong support level 141.60 (which has been reversing the price from the end of April) and the lower daily Bollinger Band.
The upward reversal from this support zone continues the active intermediate impulse wave (3), which also started from this support area last week.
Solana can be expected to rise to the next resistance level 163.8 (which stopped the previous impulse wave B earlier in June).

EURNZD Will Go Higher From Support! Buy!
Take a look at our analysis for EURNZD.
Time Frame: 1h
Current Trend: Bullish
Sentiment: Oversold (based on 7-period RSI)
Forecast: Bullish
The market is on a crucial zone of demand 1.922.
The oversold market condition in a combination with key structure gives us a relatively strong bullish signal with goal 1.930 level.
P.S
We determine oversold/overbought condition with RSI indicator.
When it drops below 30 - the market is considered to be oversold.
When it bounces above 70 - the market is considered to be overbought.
Disclosure: I am part of Trade Nation's Influencer program and receive a monthly fee for using their TradingView charts in my analysis.
Like and subscribe and comment my ideas if you enjoy them!
