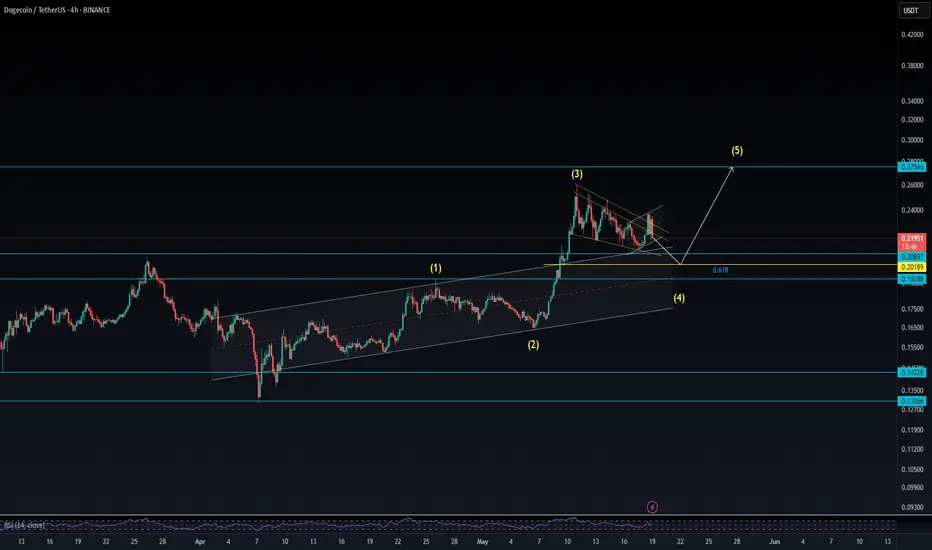
Doge / USDTPrice appears to be correcting within Wave 4, and there's a possibility of a pullback toward the 61.8% Fibonacci retracement level. I'm watching the 0.202 area for any signs of support or a bullish reaction, as it could mark the end of Wave 4 and the beginning of Wave 5.
Wave Analysis
NASDAQ Trade Setup: Bullish Bias, But Waiting for Retrace!✅ NASDAQ Breakdown: Waiting for the Retrace 🎯
I'm currently watching the NASDAQ 🧠, and here's what I'm seeing across multiple timeframes:
📈 Daily & 4H Timeframes show a strong bullish rally with significant momentum. However, in my view, price is overextended and currently trading at a premium.
📉 Although my bias remains bullish, I'm anticipating a retracement into equilibrium—specifically around the 50% to 61.8% Fibonacci zone 🔁. This would offer a more favorable entry based on value.
📊 In this video, I walk you through:
- The overall trend direction
- Where and how we can anticipate a break of market structure for a clean entry
- Why my buy idea is conditional on the 30-minute chart trending down, then flipping bullish via a structure break 🔄
⚠️ Patience is key! The trade setup may play out at various price levels—wait for confirmation from price action, as detailed in the video 🎥.

Spy Road To?Weekly Thesis for SPY
Weekly High: $594.50
Weekly Low: $589.28
Weekly Close: $594.20
52-Week Range: $481.80 – $613.23
Critical Breakdown Level: 581
Why 581 matters:
It sits well below S₃ (585.60) and aligns closely with the 38.2% Fibonacci retracement of the past four-week swing (High 594.50 → Low 566.76), which calculates to roughly 581.10.
A decisive weekly close below 581 would breach both pivot-derived supports and this Fibonacci zone, opening the door to deeper pullbacks toward the May 9 low near $564.34
Potential Sell-Wall at 604
Why 604 is a resistance cluster:
It sits just above R₃ (601.26), a confluence of weekly pivot resistance and likely profit-taking levels.
A series of limit orders tend to cluster near these round-number extensions, forming a “sell wall” that may cap any rally unless broken on strong volume.
4. Strategy & Outlook
Caution advised: SPY must hold above 581 on a weekly close basis. A failure to do so would invalidate the recent up-move and likely lead to a test of lower support zones around 587 and 585, then potentially the mid-560s.
Bullish breakout: Only a sustained weekly close above 604—ideally on above-average volume—would signal renewed upside conviction and pave the way toward the 52-week high at $613+.
Action plan:
Wait for confirmation – don’t enter new longs until either 581 holds convincingly or 604 is cleared.
Use tight risk controls – if deploying swing trades, place stops just below 581 for longs or just above 604 for shorts.
Monitor volume – validate any breakout/breakdown with volume spikes to confirm institutional participation.
Im Waiting On Confirmation as Always Safe Trades & JoeWtrades

GBPAUD: Growth & Bullish Forecast
It is essential that we apply multitimeframe technical analysis and there is no better example of why that is the case than the current GBPAUD chart which, if analyzed properly, clearly points in the upward direction.
Disclosure: I am part of Trade Nation's Influencer program and receive a monthly fee for using their TradingView charts in my analysis.
❤️ Please, support our work with like & comment! ❤️

USDCAD What Next? BUY!
My dear friends,
My technical analysis for USDCAD is below:
The market is trading on 1.3934 pivot level.
Bias - Bullish
Technical Indicators: Both Super Trend & Pivot HL indicate a highly probable Bullish continuation.
Target - 1.3958
About Used Indicators:
A pivot point is a technical analysis indicator, or calculations, used to determine the overall trend of the market over different time frames.
Disclosure: I am part of Trade Nation's Influencer program and receive a monthly fee for using their TradingView charts in my analysis.
———————————
WISH YOU ALL LUCK


MLCF SHORT TRADEMLCF been in recent uptrend since Sep 2024.
It has gone through Buying Climax which shows entry of Late Emotional Buyers, there's no one left to buy. This scenario suggests distribution or downtrend/correction in coming days.
MLCF has also given Shortening of Thrust on the last up leg, which too suggests imminent downtrend/correction.
Volume Distribution Analysis also supports downfall in Buying Volumes
🚨 TECHNICAL SHORT SELL CALL –MLCF🚨
🎯 SHORTSELL ZONE : 73-76
📈 TP 1: Rs. 68
📈 TP2 : Rs. 62
🛑 STOP LOSS: Above Rs. 80 (Daily Close)
📊 RISK-REWARD: High Conviction | 1:4
Caution:
Please close at least 50% position size at TP1 and then follow strict trailing SL to avoid losing incurred profits in case of unforeseen market conditions

XAU/USD 4H Chart Analysis – Wave 5 Setup in PlayHey traders! Just wanted to share this clean Elliott Wave setup I’m tracking on Gold (XAU/USD).
We’ve just completed what looks like a textbook Wave (4) correction, finding support right at the lower boundary of this long-term ascending channel. Price also respected the 38.2% Fibonacci retracement perfectly, lining up around the $3,090 level. That level is acting as a key demand zone right now.
🌀 According to the wave count:
Wave (3) topped out near $3,500
Wave (4) retraced sharply into the channel base
We are now potentially at the launch point for Wave (5) — the final impulse leg
💹 Wave (5) Projection:
Targeting the upper channel boundary, which aligns closely with $3,740–$3,750
This area also completes the measured move and matches key structural confluence
📈 Technical Confluence Supporting the Bullish Bias:
RSI bounced cleanly from oversold territory
Bullish EMA crossover (20/50) is happening right near the bounce zone
We’re also seeing a break of the corrective trend line, suggesting momentum is shifting back in favor of the bulls
📍 Key Levels to Watch:
$3,149: minor pullback area / possible retest
$3,283: Fib 23.6% resistance — needs to be cleared for confirmation
$3,500: Major resistance & previous high — breakout zone
$3,747: Wave 5 target
⚠️ Invalidation Zone:
If price breaks below $3,090, and especially $3,041, I’ll be reassessing the wave count. That would suggest a deeper Wave 4 or a breakdown in bullish structure.
📌 Conclusion:
I’m watching this setup closely. Gold looks poised for a strong upside leg if current levels hold. The structure is clean, momentum is turning, and we’ve got multiple confirmations in place. I’ll be scaling in with proper risk management and looking to ride this potential Wave 5 to new highs.
Drop your thoughts below — are you long on Gold? Let’s talk setups 👇
@WrightWayInvestments
@WrightWayInvestments
@WrightWayInvestments

GBP/USD | Wave 5 Loading?Hey traders 👋,
We're setting up for what could be a textbook Wave (5) breakout on the 4H GBP/USD chart. After a clean corrective pullback to the golden zone (0.618–0.705), bulls are stepping back in. Here’s the technical story:
⚙️ Technical Breakdown:
✅ Elliott Wave Structure:
Wave (4) seems complete following a controlled retracement. If this count holds, Wave (5) should extend us toward 1.34400+ and possibly 1.36300, aligning with fib extensions and previous impulse behavior.
📏 Fib Retracement:
Wave (4) respected the 0.618–0.705 zone perfectly (1.32235–1.32047), a classic launchpad in bullish cycles. Buyers showed strong interest here—textbook bounce material.
📊 EMA Stack (20, 100, 200):
Price is holding above the 100 and 200 EMAs, with the 20 EMA curling upward. If we get a clean cross and hold, that’s further confirmation of bullish continuation.
📉 RSI:
Sitting around 53, giving us enough room to run without immediate overbought pressure. RSI holding above 50 typically aligns with bullish continuation patterns.
🚨 Levels to Watch:
🔑 Entry zone: 1.32200–1.32400 (golden pocket pullback)
🎯 Target zone: 1.34400 ➜ 1.36300 (Fib + Wave 5)
❌ Invalidation: Clean break below 1.31770
🧠 Final Thoughts:
Structure is clean. Momentum is building. Fundamentals aside, this chart is screaming setup potential.
📢 What’s your take on this setup?
Drop your thoughts 👇 and don’t forget to like if you’re bullish too 🟢
@WrightWayInvestments
@WrightWayInvestments
@WrightWayInvestments

Breakout or Rejection? What the Daily Opening Range Really TellsEvery single day, the market makes a choice:
Break out — or reject.
That’s why the opening range — defined by the high and low during the first part of the day — acts like a psychological boundary.
When price breaks out of that range, momentum often follows.
When it fails to break, we get fake moves, consolidations, and traps.
At CMA Technologies, our systems start by defining this key range.
Then, we wait. No prediction. Just price confirmation.
✅ True breakouts often initiate the largest directional moves.
❌ False ones usually fade back into noise.
We encourage every strategy builder to test one simple condition:
"What does the price do after crossing outside of its initial daily range?"
The results will surprise you — especially on high-volatility pairs.
📊 If you're curious, our “Daily Open Range Breakout Bot” is available on our profile now.

US Downgrade, 3-5-10% Pullbacks But Still Bullish on S&PHappy Sunday!!!
US Futures open lower after Friday's close and Moody's downgrade.
Last time this occurred in 2011, the S&P dropped around 10% from the "news."
This is all interesting timing but I'm still liking pullbacks for opportunities to position
bullish in the US indexes (S&P, Nasdaq, Dow)
Because the melt-up continues to run (US/China gap last week and drift higher), I'm trying to stay patient for a pause or pullback
Trump and Bessent are still chirping about Tariffs and a government "detox" so a round of trade war related news may help calm the market's red hot advance post April 7 lows
I'm selling calls on owned positions for income. I'm waiting for more favorable levels to add new positions, but within 3-4% of all time highs for the S&P and Nasdaq I don't think anybody will be surprised to see the all-time highs revisited in the near to medium-term
Let's have a great week - thanks for watching!!!
-Chris Pulver

GBP/USD BUYERS WILL DOMINATE THE MARKET|LONG
GBP/USD SIGNAL
Trade Direction: long
Entry Level: 1.316
Target Level: 1.338
Stop Loss: 1.302
RISK PROFILE
Risk level: medium
Suggested risk: 1%
Timeframe: 12h
Disclosure: I am part of Trade Nation's Influencer program and receive a monthly fee for using their TradingView charts in my analysis.
✅LIKE AND COMMENT MY IDEAS✅

NASDAQ - PULL BACK INITIATED?Good Morning,
Looks like we have continued weakness in the NASDAQ and finally a break in futures showing that a bearish pullback is in affect. Typically not a good time to buy stocks until we are back on the up and up.
ENJOY!


#BTC/USDT#BTC
The price is moving within a descending channel on the 1-hour frame, adhering well to it, and is heading for a strong breakout and retest.
We are experiencing a rebound from the lower boundary of the descending channel, which is support at 103200.
We are experiencing a downtrend on the RSI indicator, which is about to break and retest, supporting the upward trend.
We are looking for stability above the 100 moving average.
Entry price: 103708
First target: 104152
Second target: 104900
Third target: 105900

Next step for ETHThere is a ending diagonal formed from five overlapping waves and now it is preparing to break the bottom of the first wave and then decline again.
*In principle, I am not a supporter of any direction, but I am only giving my point of view, which may be right or wrong. If the analysis helps you, then this is for you. If you do not like this analysis, there is no problem. Just ignore it. My goal is to spread the benefit. I am not one of the founders of the currency.

Possibility of uptrend The price is expected to break through the resistance zone and then continue the uptrend. A break of the red resistance zone will likely lead to a continuation of the uptrend.

#MYRIA/USDT#MYRIA
The price is moving within a descending channel on the 1-hour frame and is expected to break and continue upward.
We have a trend to stabilize above the 100 moving average once again.
We have a downtrend on the RSI indicator, which supports the upward move by breaking it upward.
We have a support area at the lower limit of the channel at 0.0007920, acting as strong support from which the price can rebound.
Entry price: 0.0008467
First target: 0.0009080
Second target: 0.0009642
Third target: 0.0010252


#PYR/USDT#PYR
The price is moving within a descending channel on the 1-hour frame, adhering well to it, and is heading towards a strong breakout and retest.
We are seeing a bounce from the lower boundary of the descending channel, which is support at 1.13.
We are seeing a downtrend on the RSI indicator that is about to be broken and retested, supporting the upward trend.
We are looking for stability above the 100 moving average.
Entry price: 1.165
First target: 1.19
Second target: 1.23
Third target: 1.28


BEAR TIMEExpecting a correction after hitting 107k back down to 97k, where we could see a reaction up as either a correction or a pump to a new ATH before a bigger move down
Not financial advice

XAU/USD 19 May 2024 Intraday AnalysisH4 Analysis:
-> Swing: Bullish.
-> Internal: Bullish.
Analysis and bias remains the same as analysis dated 23 April 2025
Price has now printed a bearish CHoCH according to my analysis yesterday.
Price is now trading within an established internal range.
Intraday Expectation:
Price to trade down to either discount of internal 50% EQ, or H4 demand zone before targeting weak internal high priced at 3,500.200.
Note:
The Federal Reserve’s sustained dovish stance, coupled with ongoing geopolitical uncertainties, is likely to prolong heightened volatility in the gold market. Given this elevated risk environment, traders should exercise caution and recalibrate risk management strategies to navigate potential price fluctuations effectively.
Additionally, gold pricing remains sensitive to broader macroeconomic developments, including policy decisions under President Trump. Shifts in geopolitical strategy and economic directives could further amplify uncertainty, contributing to market repricing dynamics.
H4 Chart:
M15 Analysis:
-> Swing: Bullish.
-> Internal: Bearish.
Analysis and bias remains the same as yesterday's analysis dated 15 May 2025.
In my analysis from 12 May 2025, I noted that price had yet to target the weak internal high, including on the H4 timeframe. This aligns with the ongoing corrective bearish pullback across higher timeframes, so a bearish internal Break of Structure (iBOS) was a likely outcome.
As anticipated, price targeted strong internal low, confirming a bearish iBOS.
While a bullish Change of Character (CHoCH) has printed, I am exercising discretion and not marking it as such, given the shallow nature of the pullback.
Additionally, another bullish CHoCH has printed, with price now trading within a defined internal range. I will continue monitoring this closely, particularly in relation to the depth of pullback.
Intraday Expectation:
Price to continue bullish, react at either premium of internal 50% EQ or M15 demand level before targeting weak internal low priced at 3,120.765
Note:
Gold remains highly volatile amid the Federal Reserve's continued dovish stance and persistent geopolitical uncertainties. Traders should implement robust risk management strategies and remain vigilant, as price swings may become more pronounced in this elevated volatility environment.
Additionally, President Trump’s recent tariff announcements are expected to further amplify market turbulence, potentially triggering sharp price fluctuations and whipsaws.
M15 Chart:
