Marked with “EQH” (Equal Highs), indicating a liquidity area.Chart Elements:
Instrument & Timeframe:
Pair: GBP/USD (British Pound / U.S. Dollar)
Timeframe: 4-hour chart (each candlestick = 4 hours)
Key Zones Highlighted:
Top Green Box (~1.36000–1.36500):
This represents a resistance zone where price has previously struggled to break above.
Marked with “EQH” (Equal Highs), indicating a liquidity area or potential stop-hunt zone.
Bottom Green Box (~1.33500–1.34200):
This is a support zone where price has bounced before.
The price is currently near this support level.
Price Movement Forecast (White Zigzag Line):
Indicates a bullish projection:
Suggests a potential bounce from the current support zone.
A possible rally back towards the resistance zone (~1.36000–1.36500), potentially to grab liquidity above the EQH.
Current Price:
Shown around 1.34656, which is near the bottom support zone.
Candlestick Structure:
Price has recently had a sharp move down into the support zone.
A possible reversal setup is forming based on the projection.
Interpretation:
The chart suggests a bullish scenario for GBP/USD:
The price is expected to hold the support zone.
If buying pressure comes in, the price may rise toward the resistance level to test or sweep the equal highs.
Wave Analysis

Around 3,365 – 3,375. Price is currently reacting from here.✅ Market Structure:
The chart marks HH (Higher High), HL (Higher Low), and FL (Failed Low) which indicates a bullish trend or market trying to maintain bullish structure.
The current price has pulled back into a demand zone (highlighted in green around the 3,365–3,375 range), showing potential bullish reaction.
📌 Key Zones:
Demand Zone: Around 3,365 – 3,375. Price is currently reacting from here.
Supply Zone / Target Zone: Around 3,445+. This is likely the next target area marked for profit-taking.
📈 Expected Price Action:
A projected bullish wave is drawn using a white zig-zag path:
Suggests short-term bullish correction.
Followed by a pullback and continuation to the upside.
Final target: above 3,445, completing a bullish move to the upper supply zone.
💡 Bias:
Bullish, as long as price holds above the current demand zone and continues to form higher lows.
✍️ Suggested Description:
"XAU/USD 4H Analysis: The market is currently reacting from a key demand zone after forming a higher low. If the bullish structure holds, we expect a continuation move towards the 3,445+ supply area. Clean higher highs and higher lows confirm the bullish bias. Awaiting a break and retest of the minor resistance zone for further confirmation."

S&P 500: The Wedge, the Oil, and the Yen
The S&P 500 SP:SPX OANDA:SPX500USD CME_MINI:ES1! AMEX:SPY appears to have completed a rising ending diagonal — a classic reversal structure.
The 6050 zone stands out as strong resistance — notably, no monthly candle has ever closed above this level.
🧭 Minimum correction targets:
filling the weekly FVG
a retest of the 20-week moving average
retracement to the 0.382–0.5 Fibonacci zone from the recent leg
📌 Fundamentals support the downside:
Iran–Israel tensions are pushing oil prices higher → which fuels inflation expectations
Rising CPI in Japan may accelerate the carry trade unwind and lead to a stronger yen OANDA:USDJPY
Seasonality also leans bearish during the summer months
⚠️ Bottom line: momentum is fading. A cooling phase is likely next — time to focus on risk management.

Coca-Cola Wave Analysis – 19 June 2025
- Coca-Cola broke the support zone
- Likely to fall to support level at 68.55
Coca-Cola recently broke the support zone located between the support level 70.35 (which reversed the price twice from May) and the 61.8% Fibonacci correction of the upward impulse 1 from May.
The breakout of this support zone coincided with the breakout of the daily Triangle from April – which accelerated the active correction 2.
Coca-Cola can be expected to fall to the next support level at 68.55 (former monthly low from May and the target for the completion of the active correction 2).

Visa Wave Analysis – 19 June 2025
- Visa broke daily up channel
- Likely to fall to support level at 332.90
Visa recently broke the support zone located between the support level 345,00 (which reversed the price earlier this month) and the 38.2% Fibonacci correction of the upward impulse from the start of April.
The breakout of this support zone coincided with the breakout of the daily up channel from April – which accelerated the active wave 4.
Visa can be expected to fall to the next support level at 332.90 (former minor support from April and the target for the completion of the active wave 4).

A visual comparison of Purple Bitcoin (PBTC) and Bitcoin Cash (BA visual comparison of Purple Bitcoin (PBTC) and Bitcoin Cash (BCH) trends, powered by the Purple Bitcoin Compare Bot.

Hanzo / Nas100 30 Min ( Accurate Tactical Break Out Zones )🔥 Nas100 – 30 Min Scalping Analysis (Bearish Setup)
⚡️ Objective: Precision Breakout Execution
Time Frame: 30-Minute Warfare
Entry Mode: Only after verified breakout — no emotion, no gamble.
👌Bullish After Break : 21710
Price must break liquidity with high volume to confirm the move.
👌Bullish After Break : 21550
Price must break liquidity with high volume to confirm the move.
☄️ Hanzo Protocol: Dual-Direction Entry Intel
➕ Zone Activated: Strategic liquidity layer detected — mapped through refined supply/demand mechanics. Volatility now rising. This isn’t noise — this is bait for the untrained. We're not them.
🩸 Momentum Signature Detected:
Displacement candle confirms directional intent — AI pattern scan active.
— If upward: Bullish momentum burst.
— If downward: Aggressive bearish rejection.
Hanzo / Nas100 30 Min ( Accurate Tactical Break Out Zones )

Nasdaq-100 Wave Analysis – 19 June 2025- Nasdaq-100 reversed from long-term resistance level 22000.00
- Likely to fall to support level 21000.00
Nasdaq-100 index recently reversed down from the major long-term resistance level 22000.00 (which has been steadily reversing the price from the end of last year).
The downward reversal from the resistance level 22000.00 will form the weekly Shooting Star candlesticks reversal pattern if the price closes this week near the current levels.
Given the strength of the resistance level 22000.00 and the overbought weekly Stochastic, Nasdaq-100 index can be expected to fall to the next support level at 21000.00.

FTSE 100 Wave Analysis – 19 June 2025
- FTSE 100 reversed from the resistance zone
- Likely to fall to support level 8700.00
FTSE 100 index recently reversed down from the resistance zone located between the strong resistance level 8900.00 (which stopped the weekly uptrend at the end of February) and the upper daily Bollinger Band.
The downward reversal from this resistance zone stopped the previous impulse wave i of the intermediate impulse wave 3 from May.
Given the strength of the resistance level 8900.00, FTSE 100 index can be expected to fall to the next support level at 8700.00 (the former low of wave 2 from last month).

Gold is showing 5 swing since 15 may - bullishGold is bullish near term with respect to the 09 Jun low in the 1-hour time frame and the 15 May low in the 4-hour time frame,
As gold has shown 3 3-wave down since 22 Apr, then completed 5 swing up, so near-term gold is bullish and can try to go long from the green box area with SL of 15 May low
Entry: 3332-3295
SL: 3260
Target: 3490
For more update, please follow me on X and subscribe to my channel

GBP-NZD Will Go Down! Sell!
Hello,Traders!
GBP-NZD will soon hit
A horizontal resistance
Of 2.2556 and as its a
Strong key level we will
Be expecting a local
Pullback and a move down
Sell!
Comment and subscribe to help us grow!
Check out other forecasts below too!
Disclosure: I am part of Trade Nation's Influencer program and receive a monthly fee for using their TradingView charts in my analysis.

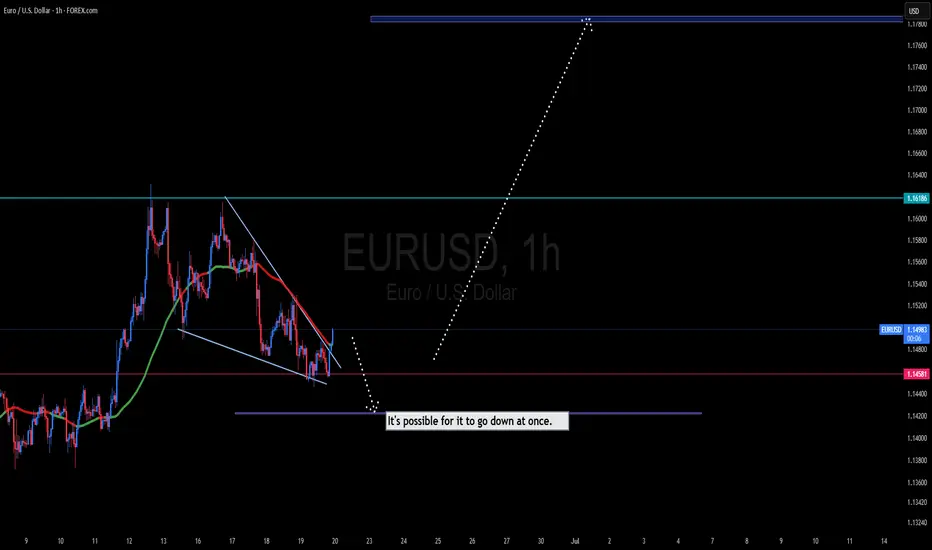
Eurusd 1Hr chart Analaysis EUR/USD is currently in a bullish trend and is expected to reach the 1.17801 – 1.18010 range. A bearish retracement is likely to occur around those levels.
Note: Ongoing tensions in the Middle East could have a significant impact on the market.
EUR-USD Will Keep Growing! Buy!
Hello,Traders!
EUR-USD is trading in an
Uptrend along the rising
Support and the pair will
Soon retest the support
From where we will be
Expecting a bullish rebound
And a bullish continuation
Buy!
Comment and subscribe to help us grow!
Check out other forecasts below too!
Disclosure: I am part of Trade Nation's Influencer program and receive a monthly fee for using their TradingView charts in my analysis.

EURUSD 1Hr chart Analaysis EUR/USD is likely to enter a bearish phase, potentially reaching the 1.14069–1.13389 range. This area is a strong candidate for a potential rebound; however, the pair may continue its downward trend. One of the main driving factors behind this bearish momentum is the ongoing conflict in the Middle East, which is contributing to broader market uncertainty and risk-off sentiment.

SPX500 Market Outlook!We remain bullish on the SPX500.
🔍 Short-Term Expectation:
A potential bottom could form around 2 AM London time on the 4H chart.
📉 Key Support Levels:
• 5904.3
• 5865.1
• 5849.3
📅 Top Projection Dates:
• 25th June
• 4th July
Stay sharp. Structure still favours the bulls. 🐂📊

The Nature of Zones — Reversals, Continuations, and the FlowWe’ve all heard trading terms like Major Trend and Major Counter-Trend levels. These are zones where price either breaks through and continues (Trend Levels) or sharply reverses (Counter-Trend Levels). In the crypto world, these levels are often separated by enormous gaps, due to the nature of the space — as I’ve mentioned in a previous idea: Crypto Charts Whisper—Are You Listening?
Let’s get one thing clear from the start. These levels are not just thin lines that traders casually draw across a chart. They are zones. So, as a skilled trader, anytime someone mentions support or resistance, keep in mind: interact with these as zones, not levels.
Why? The answer lies in the nature of the candlestick itself. Most support and resistance areas — 99% of the time — are defined by candlesticks such as inverted hammers, shooting stars, etc. For instance, in an uptrend near its peak, you’ll often spot an inverted hammer with a rejection wick that’s at least 25–50% of the candle’s body. The longer the wick, the stronger the rejection. In that sense, the high and the close of that candle form the zone. And what better tool to use for this than the rectangle?
Now, to slowly return to our main point — many of you might’ve noticed that zones often change their nature, especially resistance zones. If you’re experienced, you already know: price tends to go higher by nature. So when a counter-trend zone gets broken and price pushes above it, it shifts — it becomes a trend zone. Later, if price retests it from above, it often turns into support, and with another reversal, it can shift again — becoming a counter-trend zone once more.
But my point goes deeper than what you’ll hear in lessons or YouTube videos. Like I said in another post — A Follow-up to “Adjustments for Better Readings & VSA vs BTC” — if it’s already out there, it’s probably old news.
A skilled trader keeps an open mind — merging everything into one system. And it's part of this oneness mindset that elite traders follow, which I want to share now.
So I ask you:
What if the idea of trend and counter-trend zones didn’t just apply to major levels?
What if this concept applied everywhere on the chart?
For me, this isn’t just a question anymore — it’s a fact. A fact that made me a better trader. I won’t lie — before I got good at this, I failed over and over. But I never quit. That’s not the point though. The point is to expand your vision and train yourself to react just like the elite do.
Take double or triple tops/bottoms — standard or rounded. These formations also act exactly like trend and counter-trend zones. And they stay relevant well into the future. Every level is tested at least twice, from both directions. Maybe not immediately, but eventually — across multiple time frames.
And just like that, a level becomes a major zone for future use — especially if you trade across multiple time frames. So be careful: if you’re only looking at the 1-hour chart, you might miss something important that’s playing out on the 3-minute. And that can trigger psychological discomfort... leading to FOMO — and all the mistakes that come with it.
Also remember — double and triple tops/bottoms are zones, not exact lines. Many traders lose trades by a single tick, just because they forget that rule.
Let’s go a bit deeper now.
Think about all the small highs and lows that appear between those tops and bottoms on a 3-minute chart.
How can they help you trade better? The answer goes back to my previous idea: Location, Location, Location — Consistency and Alignment.
I get it — staying observant 24/7 is hard. That’s why institutions and big players work in teams, in shifts. They’re never alone. You shouldn’t be either.
There’s a lot more that could be said about these levels and zones — how they reveal future trend behavior, a flow! even without indicators or VSA. It has to do with how specific highs and lows behave at certain points in time... but let’s leave that for now.
For the outro, remember this:
The real edge isn’t in indicators.
It’s in your ability to catch the flow of price,
And to read strength or weakness through the simple structures within the zones Big Players create — whether visible or hidden.
A chart isn’t a single truth.
It’s a battlefield of conflicting zones and mixed signals.
If this mindset resonates with you and you want to go deeper — whether it’s building confidence or spotting hidden signals early — I work with a small circle of traders, sharing TA privately every day. Feel free to reach out.
Until next time, be well and trade wisely.
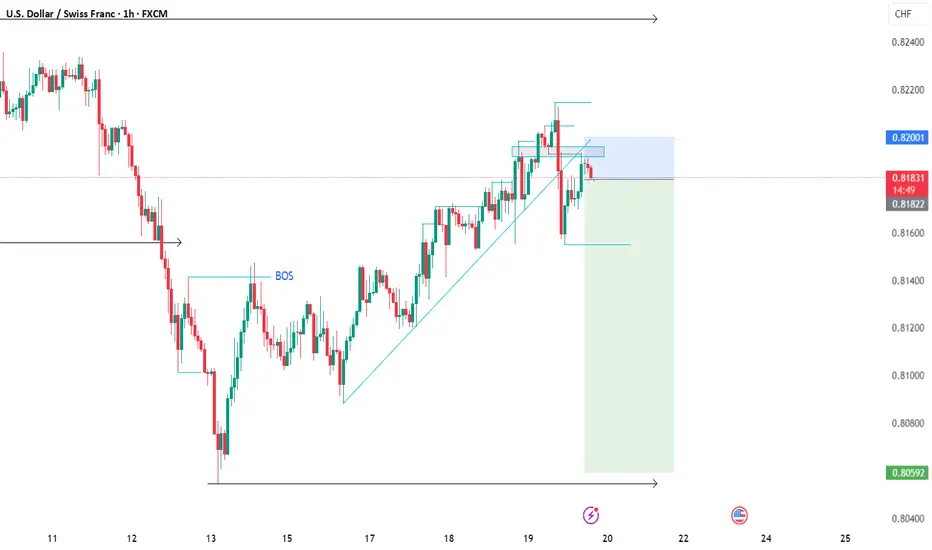
USDCHF SELLWe have officially gotten a change of trend as proven by the transition from a sequence of higher highs and higher lows to a lower low and lower high. Stacked on top of this sequence is a pullback for a retest of a key level confirming our setup.
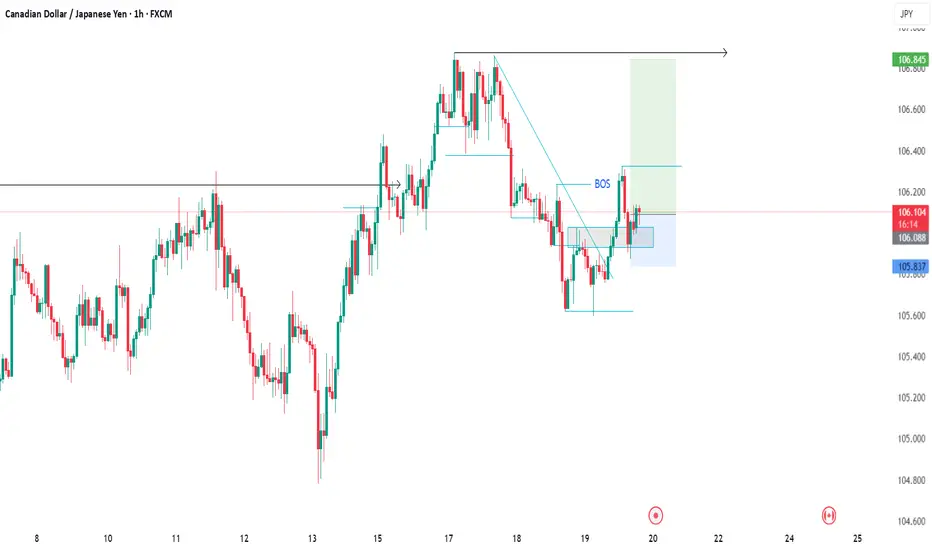
CADJPY BUYWe have transitioned from a downtrend to and up trend as shown by the transition for lower low and lower high to a higher high and potential higher low. we have pulled back to a key level for an entry.
Gold XAUUSD Move 18 June 2025Don't buy/sell this messy gold setup unless there's a clear, confirmed, and clean break— either above 3395 or below 3375.
Too many wicks = too much uncertainty and manipulation.
Investors clearly have no conviction right now.
👉 Wait for a solid candle close above 3395 for longs, or below 3375 for shorts.
Anything in between is just noise — stay out and stay safe.


Gold Hits PRZ with RD-! Time for Bears to Take Over?Gold ( OANDA:XAUUSD ) attacked the Resistance zone ($3,445-$3,406) once again, forming an Ending Diagonal at the top of the structure.
Although price reached the Potential Reversal Zone (PRZ) , the presence of Regular Divergence (RD-) between the last two peaks could indicate the weakening of bullish momentum .
In terms of Elliott Wave theory , we can clearly count a completed 5-wave structure , with an Ending Diagonal pattern . This supports the idea of a major correction starting soon .
I expect Gold to attack the lower lines of Ending Diagonal , and if it breaks, it could drop to at least $3,333 . The Second Target could be the Support zone ($3,451-$3,120) .
Do you think Gold will make a new All-Time High(ATH) again in this rally?!
Note: Stop Loss (SL) = $3,463
Gold Analyze (XAUUSD), 2-hour time frame.
Be sure to follow the updated ideas.
Do not forget to put a Stop loss for your positions (For every position you want to open).
Please follow your strategy; this is just my idea, and I will gladly see your ideas in this post.
Please do not forget the ✅ ' like ' ✅ button 🙏😊 & Share it with your friends; thanks, and Trade safe.

ABC or 12345Just a little deeper to finish the wave count and we're all set. If it stays an ABC, it could mean an expanded flat correction, which wouldn't be good since it would mean we'd go deeper later.

SPX: Elliott Wave indicating corrective phase nearly doneMy Elliott Wave count suggests the S&P 500 ( SP:SPX ) is nearing the completion of its current corrective phase. Price action has been consolidating around the 5980 area, last closing at 5980 on Wednesday.
From an Elliott Wave perspective, this setup implies an uptrend continuation is likely coming in the upcoming days.
Key levels I'm watching:
Immediate Support: 5840-5900 zone. A hold here would confirm strength.
Stronger Support: 5767-5840. A break below this would challenge the immediate bullish count.
Resistance: 6000 (psychological) and the all-time high of 6147.43. A clear break above these levels will validate the next impulse wave.
Volume and market breadth will be crucial confirmations. Let's see how the market reacts!
What are your thoughts on the current SPX wave count? Share below!
Disclaimer: This content is for informational and educational purposes only, and should not be considered financial advice. Trading involves substantial risk and may result in the loss of your capital. Always conduct your own thorough research and consult with a qualified financial professional before making any investment decisions.
