NZDUSD What Next? BUY!
My dear friends,
My technical analysis for NZDUSD is below:
The market is trading on 0.5974 pivot level.
Bias - Bullish
Technical Indicators: Both Super Trend & Pivot HL indicate a highly probable Bullish continuation.
Target - 0.6009
About Used Indicators:
A pivot point is a technical analysis indicator, or calculations, used to determine the overall trend of the market over different time frames.
Disclosure: I am part of Trade Nation's Influencer program and receive a monthly fee for using their TradingView charts in my analysis.
———————————
WISH YOU ALL LUCK
Wave Analysis

EURJPY A Fall Expected! SELL!
My dear subscribers,
EURJPY looks like it will make a good move, and here are the details:
The market is trading on 166.89 pivot level.
Bias - Bearish
Technical Indicators: Both Super Trend & Pivot HL indicate a highly probable Bearish continuation.
Target - 166.57
About Used Indicators:
The average true range (ATR) plays an important role in 'Supertrend' as the indicator uses ATR to calculate its value. The ATR indicator signals the degree of price volatility.
Disclosure: I am part of Trade Nation's Influencer program and receive a monthly fee for using their TradingView charts in my analysis.
———————————
WISH YOU ALL LUCK

KSE-100 UPDATE 19-06-2025KSE100 Analysis Update:
As previously mentioned, the KSE100 index is retesting its recent all-time high breakout level. Currently, the index is moving downwards towards the support zone/block created during the breakout, positioned @ 119200 to 120800. This level is expected to provide immediate support.
*Key Support Levels:*
- *Immediate Support:* 119100 - 120800
- *Next Support:* 115100 - 114000 are the next support levels if it breaks 119200 level
*Trend Line Support:* The index is also taking support from a newly formed trend line (dotted blue), which adds to the likelihood of a rebound from current levels.
*Investor Advice:*
- *Avoid New Buying:* It's advisable to exercise caution and avoid new buying until the index shows clear signs of direction.
- *Strictly Watch Levels:* Monitor key levels closely, including support zones and trend lines, to make informed decisions.
The index's behavior around the current support zone will be crucial in determining its next move.

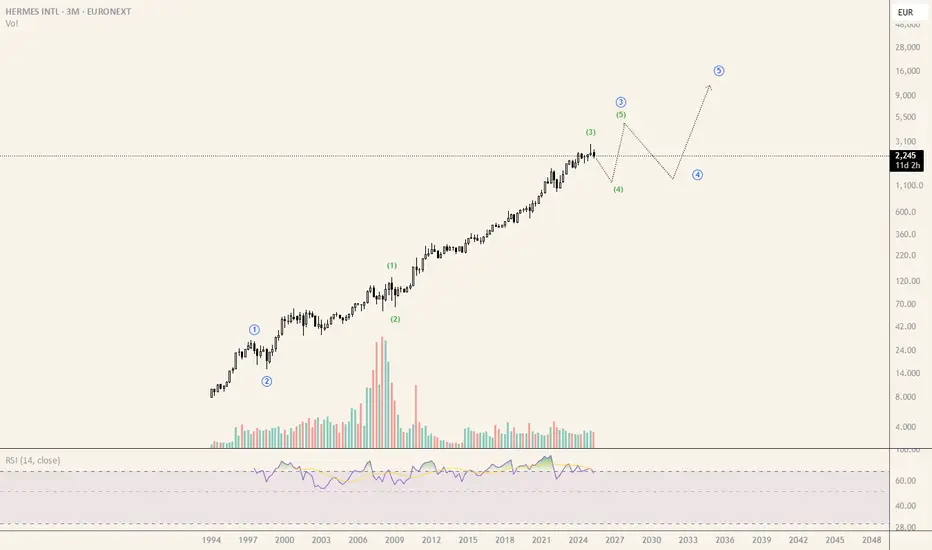
RMS - 3M - Projection over the next yearsHermes , 3 months timeframe
Keep pushing and pushing but i am expecting to the 4 of the 3 back to 1200 over the next years.
Then 5 of the 3 to at least 4600.
Many things can happen until there.
Just for fun :)
GOLD My Opinion! BUY!
My dear friends,
Please, find my technical outlook for GOLD below:
The price is coiling around a solid key level - 3367.9
Bias - Bullish
Technical Indicators: Pivot Points Low anticipates a potential price reversal.
Super trend shows a clear buy, giving a perfect indicators' convergence.
Goal - 3379.6
Safe Stop Loss - 3360.8
About Used Indicators:
The pivot point itself is simply the average of the high, low and closing prices from the previous trading day.
Disclosure: I am part of Trade Nation's Influencer program and receive a monthly fee for using their TradingView charts in my analysis.
———————————
WISH YOU ALL LUCK

The latest gold trend analysis and strategy on June 19:
I. Fundamental analysis
1. Global macro environment:
As a safe-haven asset, gold's price fluctuations are affected by multiple factors, including:
Macroeconomic policies (such as interest rates, inflation expectations)
Geopolitical tensions
Market risk sentiment and capital flows
2. The core factors currently affecting gold trends:
Federal Reserve interest rate decision:
The result of this interest rate decision is in line with market expectations;
But Powell delivered a hawkish speech after the meeting, suppressing the market's optimistic expectations for interest rate cuts this year;
As a result, the price of gold quickly fell from around $3,395 to around $3,362, showing a short-term negative effect;
Overall, the Fed's hawkish stance puts some pressure on gold.
Geopolitical risks (Middle East situation):
The conflict between Israel and Iran continues to escalate, and market risk aversion has increased;
It supports gold and limits its downside space.
Holiday impact:
The U.S. market closed early for the "Juneteenth" holiday;
Market trading volume is expected to shrink, and the volatility may be limited in the short term.
2. Technical analysis
1. Daily analysis:
Brief summary of gold trend this week:
Monday: A sharp drop after a high opening;
Tuesday: A cross positive line was closed, showing a shock correction;
Wednesday: The price of gold continued to fluctuate after the Fed's decision, and the lowest price of gold reached $3,362.
Analysis of key technical indicators and points:
Support level:
$3,362 is the low point of this decline;
This point coincides with the 10-day moving average (3,360), forming a strong support;
If this position is maintained, gold may maintain a volatile trend;
If it falls below, the next support is the 20-day moving average: around 3,350.
Resistance level:
The first resistance is the 5-day moving average: $3,390;
The stronger resistance above is at $3,405, which is a concentrated pressure point;
If it breaks through 3,405, it is expected to rise further to $3,430.
2. 4-hour chart analysis:
The current structure has not changed significantly:
The lower track of the Bollinger band has not opened, the support of 3360 is effective, and the structure is bullish;
But the continuous rebound has not broken through the pressure point of the middle track of the Bollinger band, indicating that the medium-term is still a weak and volatile pattern;
If the short-term gold price can break through the suppression level of 3405 US dollars, it is possible to start a new round of rise, with the target pointing to the high point of 3430 US dollars.
Intraday trading suggestions:
Maintain the "high-altitude and low-multiple" operation idea;
Wait for the price to appear a confirmation signal near the key support or resistance level before entering the market;
Currently, it is recommended to be bullish above the support level of 3360.
III. Operation strategy suggestions (short-term)
1. Short order strategy (high-altitude):
Entry range: 3385-3383 US dollars;
Stop loss: 3390 US dollars;
Target: 3370-3365 US dollars.
2. Long order strategy (low long):
Entry range: 3365-3367 USD;
Stop loss: 3359 USD;
Target: 3375-3385 USD.
IV. Summary
Gold is currently in a long-short game and a weak shock pattern;
The hawkish stance of the Federal Reserve suppresses gold, but geopolitical factors provide support for it;
From a technical perspective, 3360 is the key support point and 3405 is the key resistance point;
Short-term thinking is mainly based on shock thinking, and the operation is recommended to maintain the high-altitude low-multiple strategy in the range;
Follow-up focus:
Whether 3360 is effectively maintained;
Whether 3405 is successfully broken through to confirm the trend direction.

HOW-TO: Trade with HGDA Trade Matrix + Dual Momentum🧭 HOW-TO: Use HGDA Trade Matrix — Dynamic Support/Resistance Zones + Dual Momentum Signals
📊 This explanation is based on the EUR/USD chart on the 1-hour timeframe.
🧱 What Is HGDA Trade Matrix?
HGDA Trade Matrix automatically plots dynamic support and resistance zones derived from the high and low of a reference candle (which you can choose in the indicator settings — e.g., daily, 4H, or 1H).
The indicator calculates these zones using a proprietary ratio model based on price geometry and practical market behavior. It also includes directional guide lines (in yellow) to assist in navigating price behavior between key levels.
🧊 Zone Components:
🟥 Red Zones = Strong resistance areas (sell potential)
🟩 Green Zones = Strong support areas (buy potential)
🟨 Yellow Lines = Midrange guides or balance zones, highlighting decision areas
These levels update in real-time as price progresses, but remain anchored to the selected timeframe's reference candle — providing structure without noise.
🕓 How to Choose the Timeframe:
✅ Select Daily Candle (D) in settings → Get a full-day market structure that stays fixed for intraday analysis.
✅ Select Hourly Candle (H1) → Get real-time adaptive zones perfect for active monitoring and short-term trading.
📉 Trading Signals: BUY & SELL
The indicator includes automatic BUY and SELL labels that are generated using two momentum filters:
✅ MACD:
Buy: MACD crosses above signal line while below the zero line
Sell: MACD crosses below signal line while above the zero line
✅ Stochastic:
Buy: %K crosses above %D while avoiding overbought traps
Sell: %K crosses below %D while avoiding oversold traps
💥 Strong signals occur when both MACD and Stochastic agree, confirming a high-conviction entry.
🧪 Real Chart Example:
On June 14, a BUY signal appears at the lower green zone → suggesting reversal off dynamic support.
Price rallies to the red zone by June 17 → SELL signal confirms overbought condition.
On June 18, price dips again into the green zone → multiple BUY signals suggest rebuilding support.
This shows how the zones guide structure, while the signals confirm entries with real momentum.
🎯 How to Trade It:
Select your timeframe (daily or hourly) based on your style.
Wait for price to approach a zone — especially green or red.
Watch for BUY/SELL signal labels.
Confirm with candle action (e.g., rejections, wicks, engulfing).
Use next zone as your target, and zone failure as stop-loss reference.
Use built-in alerts to catch Strong Buy/Sell setups automatically.
🧬 What Makes It Original:
HGDA Trade Matrix is not a basic S/R indicator — it's a structured system that:
Adapts to market shifts
Balances geometry with momentum
Filters noise using dual-confirmation logic
It’s suitable for both intraday and swing traders who need actionable structure + smart entry timing.
📩 Access:
This is an Invite-Only tool. Message us directly to request access or trial.

AEFES2! — 1DEe observed an all-time high on July 17, 2025. Since then, the market appears to be undergoing an ABC corrective pattern. Based on the wave structure and proportions, it seems we are currently in the final leg of this correction.
Two potential target zones, both in terms of price and timing, are marked with yellow lines on the chart. In my view, there is a high probability that the correction will conclude before June 18. However, if the final leg deepens further than expected, the completion of this corrective phase could be extended into September.
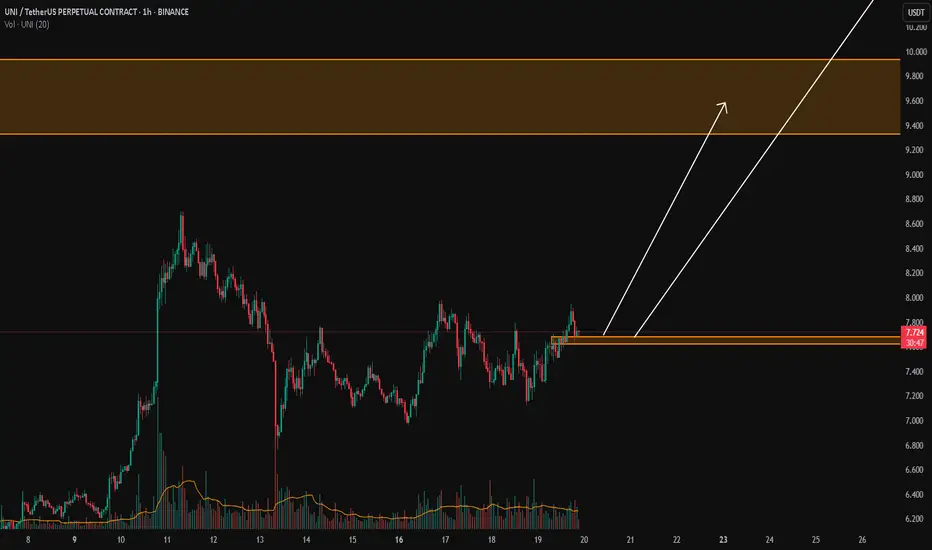
UNI/USDTKey Level Zone: 7.620 - 7.680
LMT v2.0 detected.
The setup looks promising—price previously trended upward with rising volume and momentum, then retested this zone cleanly. This presents an excellent reward-to-risk opportunity if momentum continues to align.
Introducing LMT (Levels & Momentum Trading)
- Over the past 3 years, I’ve refined my approach to focus more sharply on the single most important element in any trade: the KEY LEVEL.
- While HMT (High Momentum Trading) served me well—combining trend, momentum, volume, and structure across multiple timeframes—I realized that consistently identifying and respecting these critical price zones is what truly separates good trades from great ones.
- That insight led to the evolution of HMT into LMT – Levels & Momentum Trading.
Why the Change? (From HMT to LMT)
Switching from High Momentum Trading (HMT) to Levels & Momentum Trading (LMT) improves precision, risk control, and confidence by:
- Clearer Entries & Stops: Defined key levels make it easier to plan entries, stop-losses, and position sizing—no more guesswork.
- Better Signal Quality: Momentum is now always checked against a support or resistance zone—if it aligns, it's a stronger setup.
- Improved Reward-to-Risk: All trades are anchored to key levels, making it easier to calculate and manage risk effectively.
- Stronger Confidence: With clear invalidation points beyond key levels, it's easier to trust the plan and stay disciplined—even in tough markets.
Whenever I share a signal, it’s because:
- A high‐probability key level has been identified on a higher timeframe.
- Lower‐timeframe momentum, market structure and volume suggest continuation or reversal is imminent.
- The reward‐to‐risk (based on that key level) meets my criteria for a disciplined entry.
***Please note that conducting a comprehensive analysis on a single timeframe chart can be quite challenging and sometimes confusing. I appreciate your understanding of the effort involved.
Important Note: The Role of Key Levels
- Holding a key level zone: If price respects the key level zone, momentum often carries the trend in the expected direction. That’s when we look to enter, with stop-loss placed just beyond the zone with some buffer.
- Breaking a key level zone: A definitive break signals a potential stop‐out for trend traders. For reversal traders, it’s a cue to consider switching direction—price often retests broken zones as new support or resistance.
My Trading Rules (Unchanged)
Risk Management
- Maximum risk per trade: 2.5%
- Leverage: 5x
Exit Strategy / Profit Taking
- Sell at least 70% on the 3rd wave up (LTF Wave 5).
- Typically sell 50% during a high‐volume spike.
- Move stop‐loss to breakeven once the trade achieves a 1.5:1 R:R.
- Exit at breakeven if momentum fades or divergence appears.
The market is highly dynamic and constantly changing. LMT signals and target profit (TP) levels are based on the current price and movement, but market conditions can shift instantly, so it is crucial to remain adaptable and follow the market's movement.
If you find this signal/analysis meaningful, kindly like and share it.
Thank you for your support~
Sharing this with love!
From HMT to LMT: A Brief Version History
HM Signal :
Date: 17/08/2023
- Early concept identifying high momentum pullbacks within strong uptrends
- Triggered after a prior wave up with rising volume and momentum
- Focused on healthy retracements into support for optimal reward-to-risk setups
HMT v1.0:
Date: 18/10/2024
- Initial release of the High Momentum Trading framework
- Combined multi-timeframe trend, volume, and momentum analysis.
- Focused on identifying strong trending moves high momentum
HMT v2.0:
Date: 17/12/2024
- Major update to the Momentum indicator
- Reduced false signals from inaccurate momentum detection
- New screener with improved accuracy and fewer signals
HMT v3.0:
Date: 23/12/2024
- Added liquidity factor to enhance trend continuation
- Improved potential for momentum-based plays
- Increased winning probability by reducing entries during peaks
HMT v3.1:
Date: 31/12/2024
- Enhanced entry confirmation for improved reward-to-risk ratios
HMT v4.0:
Date: 05/01/2025
- Incorporated buying and selling pressure in lower timeframes to enhance the probability of trending moves while optimizing entry timing and scaling
HMT v4.1:
Date: 06/01/2025
- Enhanced take-profit (TP) target by incorporating market structure analysis
HMT v5 :
Date: 23/01/2025
- Refined wave analysis for trending conditions
- Incorporated lower timeframe (LTF) momentum to strengthen trend reliability
- Re-aligned and re-balanced entry conditions for improved accuracy
HMT v6 :
Date : 15/02/2025
- Integrated strong accumulation activity into in-depth wave analysis
HMT v7 :
Date : 20/03/2025
- Refined wave analysis along with accumulation and market sentiment
HMT v8 :
Date : 16/04/2025
- Fully restructured strategy logic
HMT v8.1 :
Date : 18/04/2025
- Refined Take Profit (TP) logic to be more conservative for improved win consistency
LMT v1.0 :
Date : 06/06/2025
- Rebranded to emphasize key levels + momentum as the core framework
LMT v2.0
Date: 11/06/2025
- Fully restructured lower timeframe (LTF) momentum logic
June 12, 2025 Historical Comparison Analysis [Wave Analysis]No one knows tomorrow but what if???
Here, we have a historical comparison between December 07, 2020 to June 13, 2022, and January 22, 2024 to present day.
December 07, 2020 to November 08, 2021:
• Uptrend
• Flag (retracement)
• Uptrend continuation
• Range
• Downtrend
• Range (W or Double bottom pattern)
• Uptrend
• Flag (retracement)
• Uptrend continuation
November 08, 2021 to June 13, 2022:
• Downtrend
• Flag (retracement)
• Downtrend continuation
January 22, 2024 to May 19, 2025:
• Uptrend
• Flag (retracement)
• Uptrend continuation
• Range
• Downtrend
• Range (W or Double bottom pattern)
• Uptrend
May 19, 2025 to present day:
• .......
JUST WHAT IF HISTORY REPEATS ITSELF

HOW-TO: Trade Gold Using HGDA Fusion Zones .🧬 HOW-TO: Trade Gold Using HGDA Fusion Zones — Adaptive Price Lanes + Dual Momentum Signals
📊 Example shown: Gold (XAUUSD) — 4H Chart
🔍 What Are HGDA Fusion Zones?
HGDA Fusion Zones is an adaptive technical analysis tool that builds five dynamic price bands derived from the last 20 candles (default). These zones act as evolving support and resistance levels based on the most recent highs and lows, forming a layered roadmap of price behavior.
🧭 Structure of the Zones
Each zone is color-coded and represents a distinct technical level:
🟥 Upper Red Zones: Overbought / Extension Areas
🟩 Lower Green Zones: Oversold / Accumulation Areas
🟨 Middle Yellow Zone: Equilibrium / Decision Point
The farther the price moves from the yellow midline, the more likely it is to revert — unless momentum confirms continuation.
📈 How Price Moves Through Zones
Price usually moves impulsively from the green zones (bottom) up toward the red zones (top).
A break of a level with momentum often means price is targeting the next zone above or below.
Failure to break a level typically results in a retracement.
All zones self-adjust with each new candle, adapting to volatility and evolving market structure in real-time.
⚙️ Dual Momentum Signal Engine
The indicator includes a smart signal system using MACD and Stochastic filters to enhance entries.
✅ Signal Types:
BUY: Triggered when either MACD crosses up or Stochastic crosses up
SELL: Triggered when either MACD crosses down or Stochastic crosses down
STRONG BUY: When both MACD & Stochastic align upward
STRONG SELL: When both indicators align downward
🎯 Momentum Filters:
MACD: Only active when crossing with proper positioning relative to the zero line
Stochastic: Avoids generating signals in extreme overbought/oversold zones — reducing noise
This layered confirmation helps filter out false signals and improves timing precision.
🧪 Chart Example Highlights:
June 1: BUY signal near lower green → leads to rally into upper red
Mid-June: SELL signal near red zone → followed by downside correction
June 19: BUY signal forms at lower green → possible new accumulation
This combination of adaptive zones and momentum signals creates a structured trading model for both swing and intraday strategies.
🛠️ How to Use It:
Watch price interaction near green or red zones
Wait for a signal (BUY/SELL) to confirm direction
Add candlestick analysis (rejections, engulfing, etc.)
Use alerts to catch STRONG signals automatically
Target: next level in the zone hierarchy
Stop: break below/above zone boundary or midline failure
🔒 Access & Trial
HGDA Fusion Zones is an Invite-Only Script, engineered for traders who want structure, adaptability, and filtered precision.
💡 Free trial access is available for testing.
📩 Send a direct message on TradingView to request access.

EURUSD ||| Elite traders see the trap
EUR/USD 4H 🔍 – Greenfire Forex Outlook
🟦 Rising channel structure spotted
🔸 Liquidity zones mapped
🟪 Buyer blocks identified (1.137 & 1.117)
📉 Let price dive deeper into the trap...
📈 Then catch the reversal with precision.
This is not a prediction, it's a reaction plan based on price behavior.
🔥 Structure + Zones + Patience = Greenfire Setup
.
#EURUSD #SmartMoneyConcepts #ForexAnalysis #ElliottWave #SMC #PriceAction #ForexIndia #4HChart

OTEUM EXPERT CALL: EUR/USD – June Finale Setup We’re eyeing the last intramonth swing of June, expected to bleed into early July. Our playbook: let the market cough up one final risk-off spike on the Iran headlines 🌪️📰, then scoop up positions in the value zone (red box) for the next bullish leg 🚀.
Patience first, trigger later 🕰️🎯—wait for price to hit the sweet spot, load up, and ride the firework into summer. Stay nimble; geo-shock headlines can flip the board fast ⚠️.
#EURUSD #Intramonth #RiskOff #ValueHunt #OTEUM

OTEUM EXPERT CALL: EUR/USD – June Finale Setup We’re eyeing the last intramonth swing of June, expected to bleed into early July. Our playbook: let the market cough up one final risk-off spike on the Iran headlines 🌪️📰, then scoop up positions in the value zone (red box) for the next bullish leg 🚀.
Patience first, trigger later 🕰️🎯—wait for price to hit the sweet spot, load up, and ride the firework into summer. Stay nimble; geo-shock headlines can move the board fast ⚠️.

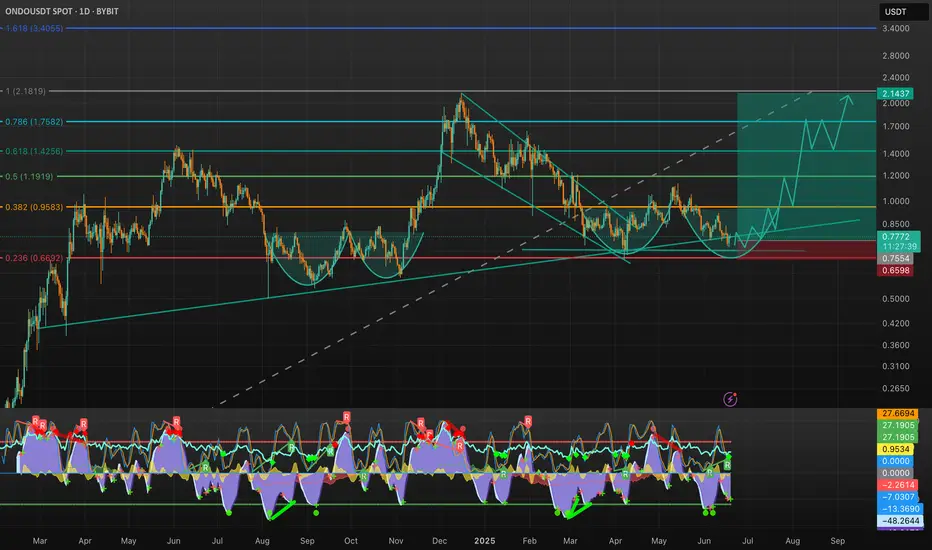
ONDO | Potential Long Setup | Technical Structure + MarketCipherThe chart speaks clearly:
✅ Falling wedge breakout supported by higher lows
✅ A potential cup-and-handle continuation forming
✅ Bullish divergence on Market Cipher B, signaling momentum reversal
🔍 Trade Setup Details:
Entry Zone: 0.76 – 0.78
Stop Loss: Daily close below 0.66
Target Area: 2.14 – 2.18 (aligned with 0.618 Fib and measured wedge target)
Risk/Reward: 1:4+
Market Cipher B shows similar structure to previous cycle bottoms: green dot + momentum turning up
⚠️ Caution Note:
While the setup is technically clean, macro volatility (FOMC decisions, BTC dominance shifts) can heavily influence the outcome.
If the market environment aligns, this is a textbook bullish setup.
If not, discipline on stop-loss is essential.
🧠 Plan the trade. Trade the plan. Leave emotion out.
#ONDO #AltcoinSetup #CryptoAnalysis #MarketCipher #TechnicalAnalysis #SmartMoney #ONDOUSDT #CryptoTrading
XAUUSD: Market Analysis and Strategy for June 19Gold technical analysis
Daily chart resistance 3450, support below 3338
Four-hour chart resistance 3400, support below 3338
One-hour chart resistance 3375, support below 3350
Fundamentally, the geopolitical situation has eased. The market was affected by the Fed's decision this week to keep interest rates unchanged and not cut interest rates, which weakened the bullish momentum and buyers took profits, leading to a decline.
From the current trend analysis, the support below focuses on the four-hour level 3338 and the one-hour level 3350 support. The upper pressure focuses on the suppression near the daily level 3450, and the short-term long-short strength and weakness dividing line 3400. Keep the high-selling and low-buying range operation during the day.
Sell: 3375near SL: 3380
Sell: 3350near SL: 3355
Buy: 3338near SL: 3333

#Bitcoin Update - 19.06.2025🚨 #Bitcoin Update – 19.06.2025 🚨
For the first time after FOMC, Bitcoin is showing an unusual calm – and yes, that’s pretty strange, especially considering the ongoing tensions in the Middle East. But let's break it down clearly and from my point of view. 👇
🔹 Arrow #2 remains a crucial resistance level. Price *did* break above it, but there was no strong confirmation or momentum – it got rejected and pulled back.
🔸 Currently, Bitcoin is stuck in a range, moving between Arrow #2 and Arrow #4 (marked by black lines). This range-bound behavior might continue for a while unless we get a strong breakout.
🌟 Now, pay close attention to the yellow lines under Arrow #3 and Arrow #5 – these are key support zones. As long as these hold, bullish sentiment remains intact.
✅ Also, Arrow #6 (black line) is the last strong support – only if this breaks, we can start talking about a potential bearish move or at least a deeper retest.
📈 In my opinion, we might see another attempt to break the All-Time High (ATH) very soon. Price still looks bullish, and as long as we hold above Arrow #6, there’s no clear sign of weakness.
🎯 Summary:
* Market is calm but not dead.
* Still bullish unless Arrow #6 breaks.
* Range between Arrow #2 & Arrow #4 continues.
* Eyes on next ATH attempt! 🚀
🧠 Stay patient. Stay focused.
📊 Next up: ETH and Bitcoin Dominance analysis coming soon – make sure you follow so you don’t miss the update!
\#Crypto #BTC #Trading #BitcoinAnalysis #CryptoUpdate #BTCUSDT


GOLD Will Go Down From Resistance! Short!
Please, check our technical outlook for GOLD.
Time Frame: 1h
Current Trend: Bearish
Sentiment: Overbought (based on 7-period RSI)
Forecast: Bearish
The price is testing a key resistance 3,373.02.
Taking into consideration the current market trend & overbought RSI, chances will be high to see a bearish movement to the downside at least to 3,354.03 level.
P.S
Overbought describes a period of time where there has been a significant and consistent upward move in price over a period of time without much pullback.
Disclosure: I am part of Trade Nation's Influencer program and receive a monthly fee for using their TradingView charts in my analysis.
Like and subscribe and comment my ideas if you enjoy them!

EURUSD Will Go Lower! Sell!
Here is our detailed technical review for EURUSD.
Time Frame: 1h
Current Trend: Bearish
Sentiment: Overbought (based on 7-period RSI)
Forecast: Bearish
The market is trading around a solid horizontal structure 1.148.
Taking into consideration the structure & trend analysis, I believe that the market will reach 1.143 level soon.
P.S
Please, note that an oversold/overbought condition can last for a long time, and therefore being oversold/overbought doesn't mean a price rally will come soon, or at all.
Disclosure: I am part of Trade Nation's Influencer program and receive a monthly fee for using their TradingView charts in my analysis.
Like and subscribe and comment my ideas if you enjoy them!

AUDUSD Will Go Down! Short!
Take a look at our analysis for AUDUSD.
Time Frame: 4h
Current Trend: Bearish
Sentiment: Overbought (based on 7-period RSI)
Forecast: Bearish
The market is testing a major horizontal structure 0.646.
Taking into consideration the structure & trend analysis, I believe that the market will reach 0.643 level soon.
P.S
The term oversold refers to a condition where an asset has traded lower in price and has the potential for a price bounce.
Overbought refers to market scenarios where the instrument is traded considerably higher than its fair value. Overvaluation is caused by market sentiments when there is positive news.
Disclosure: I am part of Trade Nation's Influencer program and receive a monthly fee for using their TradingView charts in my analysis.
Like and subscribe and comment my ideas if you enjoy them!

GBPCAD Will Move Higher! Long!
Please, check our technical outlook for GBPCAD.
Time Frame: 12h
Current Trend: Bullish
Sentiment: Oversold (based on 7-period RSI)
Forecast: Bullish
The market is approaching a key horizontal level 1.842.
Considering the today's price action, probabilities will be high to see a movement to 1.855.
P.S
We determine oversold/overbought condition with RSI indicator.
When it drops below 30 - the market is considered to be oversold.
When it bounces above 70 - the market is considered to be overbought.
Disclosure: I am part of Trade Nation's Influencer program and receive a monthly fee for using their TradingView charts in my analysis.
Like and subscribe and comment my ideas if you enjoy them!

EURGBP - Bullish No More!Hello TradingView Family / Fellow Traders. This is Richard, also known as theSignalyst.
📈 EURGBP has been overall bullish trading within the rising channel marked in blue. And it is currently retesting the upper bound of the channel.
Moreover, the orange zone is a strong weekly resistance.
🏹 Thus, the highlighted red circle is a strong area to look for sell setups as it is the intersection of the upper blue trendline and resistance.
📚 As per my trading style:
As #EURGBP is around the red circle zone, I will be looking for bearish reversal setups (like a double top pattern, trendline break , and so on...)
📚 Always follow your trading plan regarding entry, risk management, and trade management.
Good luck!
All Strategies Are Good; If Managed Properly!
~Rich
Disclosure: I am part of Trade Nation's Influencer program and receive a monthly fee for using their TradingView charts in my analysis.
