Gold Price Reacts Strongly at 3,350.During the trading session on June 19, gold (XAUUSD) experienced significant volatility, breaking below the short-term support zone around 3,370 USD/oz and sharply dropping to an intraday low of approximately 3,350 USD/oz. This support level had been tested multiple times in previous sessions and has often led to price rebounds.
Following the sharp decline, buying pressure emerged, as shown by a strong reversal candlestick accompanied by a volume spike — indicating that buyers are stepping in at this attractive price zone.
Technical Breakdown – 15-Minute Chart
Chart type: XAUUSD, 15-minute timeframe
Support zone: 3,350 (tested and showing reaction)
Nearby resistance: 3,365 – 3,370
Volume: Surged at the bottom, suggesting buying interest.
Pattern: Signs of a temporary bottom (bullish pin bar + supporting volume).
Suggested Trading Strategy
Based on today’s price action and chart structure, consider:
Short-term buy around 3,351 – 3,353 with a stop loss below 3,348.
Take profit targets: 3,365 – 3,372.
Extended strategy: If EMA5 crosses up and locks above 3,370, extend targets to 3,388 – 3,395 during the US session.
Conclusion: 3,350 is Acting as the Final Support Wall
Today’s session shows that sellers are still in control, but technical reactions around 3,350 have formed a strong defense. If price continues to hold this level and volume remains positive, a short-term rebound is highly likely.
However, traders should manage positions with flexibility as the broader trend still leans bearish — only a break and hold above 3,370–3,380 could signal a clearer trend reversal.
Wave Analysis

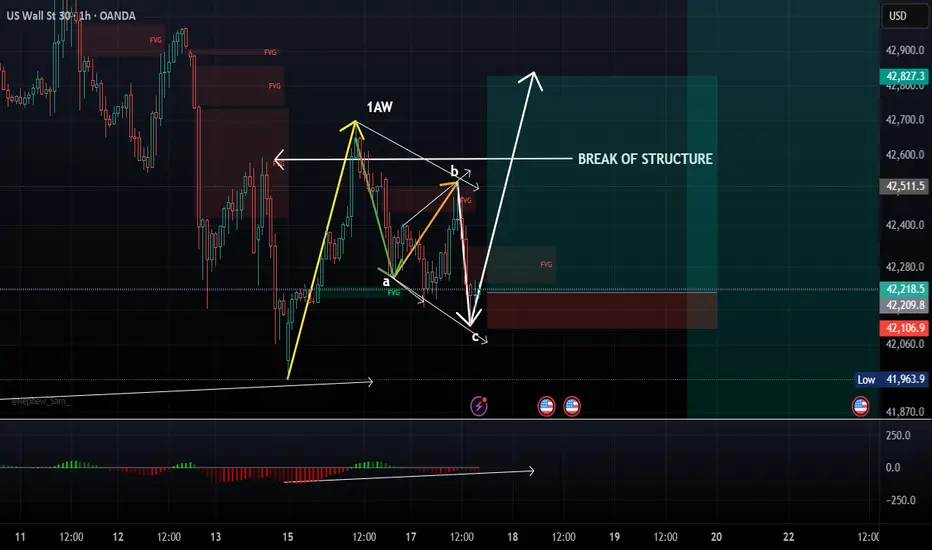
US30/DJ30 Long/buy 1:6Reason for buy:
VERY SIMILAR STRUCTURE TO GOLD!!!!!
1. Break of structure
2. Regular flat in play with a complete corrective structure (a,b,c)
3. NO MACD divergence shows strong moment upwards
4. Impulsive move (1AW) indicates a strong move upwards will continue
5. Liquidity at the top (TP area)
Entry: CMP (Current market price)
Stop loss :42086
Take Profit: At own discretion...OPEN!
Strategy/ies: Engulfing candle on 15/1HR TF
Losses are part of the game...don't be too hard on yourself!
Bearish Wolfewave 2-4 line breakThis could also be seen as a riding wedge break which is a sell signal.
Patterns usually shows up in fractals.
Ideal target is the 1-4 line.
However, patterns could fail.
Do your own due diligence.
Earlier targets are there for higher probability of taking a profit.

Alkem- Healthy Correction, Strong Base – Poised for Final wave!ALKEM LABORATORIES – Weekly Elliott Wave View
The chart presents a clear 5-wave Elliott impulse in progress. Wave 4 appears to be completed or near completion, resting at the golden 0.618 Fib level of Wave 3. The broader uptrend remains intact inside the long-term channel.
Key Levels:
Support: ₹4,475 – ₹3,956
Resistance: ₹5,272, ₹6,439, ₹6,700, and ₹8,407 (Wave 5 projection)
RSI at 40.58 indicates consolidation but signs of bullish divergence are emerging. A strong bounce from current support could trigger Wave 5 toward new highs.
Bias: Bullish | Awaiting Wave 5 Initiation

TATA- ko"bye-bye"bolna mana hain!!The structure suggests a completed Wave 4 correction at 0.5–0.618 Fibonacci retracement, setting up for the final Wave 5 leg. A bullish reversal is underway, supported by improving RSI and rising volume.
Key Levels:
Support: ₹603, ₹500, ₹465
Resistance: ₹725 (Fib), then new highs
RSI at 42.6 shows early bullish momentum. A weekly close above ₹725 could confirm Wave 5 ignition toward potential new highs.
Bias: Bullish | Wave 5 in Progress

US OIL bullish rally !Technically, the $71-$74 range appears to be a reasonable short-term consolidation zone, provided no significant escalation in Iran tensions occurs. However, given the high likelihood of worsening tensions, USOIL may retest $80 and potentially even surpass $80 and can touch 86$, driven by geopolitical developments.
TVC:USOIL
entered @70$. SL 68.3$
partially booking @80
Holding rest till 85$ with Trailing SL

GBP/USD the mid-chart region confirms continued bearish momentumClear downtrend with a series of lower highs and lower lows.
Bearish break of structure (BOS) visible around the mid-chart region confirms continued bearish momentum.
Price Channel:
Price is respecting a descending parallel channel, indicating a controlled downtrend.
---
2️⃣ Supply & Demand Zones
Supply Zone Identified (Top Right):
Marked with a rectangular box; price previously reversed aggressively from this zone.
Acts as a strong institutional selling area.
Demand Zone (Lower Left):
Price has entered or is approaching a high-probability demand area, where buyers are likely to step in.
---
3️⃣ Entry Setup
Entry Highlighted:
A potential short entry (sell trade) is plotted just below the supply zone, with stop-loss above the previous structure high.
Risk-Reward Ratio:
Displayed trade setup shows a well-calculated R:R, favoring reward over risk.
SL: Tight and above supply
TP: Extends deep into the green demand zone below
---
4️⃣ Key Observations
Liquidity Sweeps:
Possible liquidity grab above a previous high before the drop, classic smart money trap.
Break & Retest Confirmation:
Market shows a break and retest pattern of structure, reinforcing short bias.
Imbalance/FVG (Fair Value Gap):
There appears to be an imbalance (unfilled orders) that price is revisiting to mitigate.
---
5️⃣ Indicators & Tools
Price Action-Based Analysis:
Minimal reliance on indicators—pure structure, zones, and smart money concepts dominate.
TradingView Tools:
Trendlines, zones, and entry/exit markings used professionally.
---
🎯 Conclusion – Trader’s Edge
This is a textbook smart money concept (SMC) and price action trade setup:
Bearish bias is clearly respected.
High-probability short from a supply zone aligned with structure, liquidity, and imbalance.
Clean and calculated execution strategy visible, showing top-tier technical discipline.

MSFT - 4th wave correction due then 5th wave to follow?One of the few charts that offers an 'easier' Elliott Wave count for US equities in the present market. This count suggests that we are presently in wave 3 of a 5th of a 5th wave (if that makes sense) and could be due a 4th wave correction any time soon. This count would also expect a shallow 4th wave correction due to wave 2 being deep before continuing higher to complete wave 5.


GOLD - At CUT n REVERSE Region? Holds or not??#GOLD .. perfect move as per our analysis and now market just at his CUT N REVERSE region, that is around 3367-68 to 3370-71
Keep close that region because that is our ultimate region of the week and month.
Only holdings of that region means you can see again bounce for now otherwise not.
NOTE: we will go for cut n reverse below that region on confirmation.
Good luck
Trade wisely

GOLD Rising Support Ahead! Buy!
Hello,Traders!
GOLD is trading in an uptrend
So despite the price is going
Down now we will be expecting
A strong rebound and a move up
After the price hits the
Rising support below
Buy!
Comment and subscribe to help us grow!
Check out other forecasts below too!
Disclosure: I am part of Trade Nation's Influencer program and receive a monthly fee for using their TradingView charts in my analysis.

Dow Futures (YM) Elliott Wave View: Wave 4 Correction UnderwayThe rally in Dow Futures (YM) that began from the April 7, 2025 low remains intact. It is unfolding as a five-wave impulse pattern according to Elliott Wave analysis. Starting from that low, wave 1 peaked at 39,649. A corrective pullback in wave 2 followed which found support at 36,922. The Index then resumed its upward trajectory in wave 3, which itself subdivides into five smaller-degree waves. As shown on the 1-hour chart below, wave 3 reached its high at 43,316. The market is now experiencing a pullback in wave 4.
Wave 4 is taking shape as a double three structure, a corrective pattern characterized by multiple sub-waves. From the wave 3 high, wave (a) declined to 42,518, followed by a wave (b) rally that topped at 42,944. The subsequent wave (c) dropped to 42,223, completing the first leg of the double three, labeled wave ((w)). The Index then rallied in wave ((x)), peaking at 43,069. Then it turns lower in wave ((y)), which also unfolds as a double three. Within this structure, wave (w) ended at 42,424, and a corrective wave (x) rally concluded at 42,860. The Index is now expected to extend lower in wave (y) of ((y)), targeting the 41,297–41,972 range. This decline should finalize wave 4, setting the stage for a potential wave 5 rally to new highs.

DXY – U.S. Dollar Faces Downside RiskAfter a period of strength driven by its safe-haven appeal, the DXY is showing signs of weakness as doubts emerge over the true resilience of the U.S. economy. Recent data — including retail sales, industrial production, and consumer sentiment — have all fallen short of expectations, raising the likelihood that the Fed may pivot to a more dovish stance sooner than anticipated.
As a market analyst closely monitoring capital flows, I believe the dollar is gradually losing its edge. With risk appetite improving and capital rotating into the euro and other risk assets, the DXY is likely to remain under pressure in the near term.
Current outlook: Bearish bias, especially if the Fed softens its tone and weak U.S. data persists.
The market is waiting for confirmation — but the pressure is already building.

Oscar Health Bullish Continuation Oscar Health has broken out of a long descending wedge and is now resuming its broader bullish channel trend. With volume surging and smart money signals appearing near key supports, the chart targets a 94% measured move to $26.76, with the possibility of continuation toward $50.00 if trend strength persists.
A strong bullish structure remains valid as long as price stays above $13.68.

CLSK / 2hNASDAQ:CLSK has revealed that wave a in an expanding leading diagonal. So the retracement of wave b may remain in progress.
The anticipated decline by 17% as the last subdivision >> c of (y) will follow soon and finally would conclude the entire correction in Minute degree wave ii(circled).
Trend Analysis >> After the completion of the entire correction, the trend will turn upward to an impulsive third wave in the same degree.
The Retracement Targets >> 7.93 >> 7.84

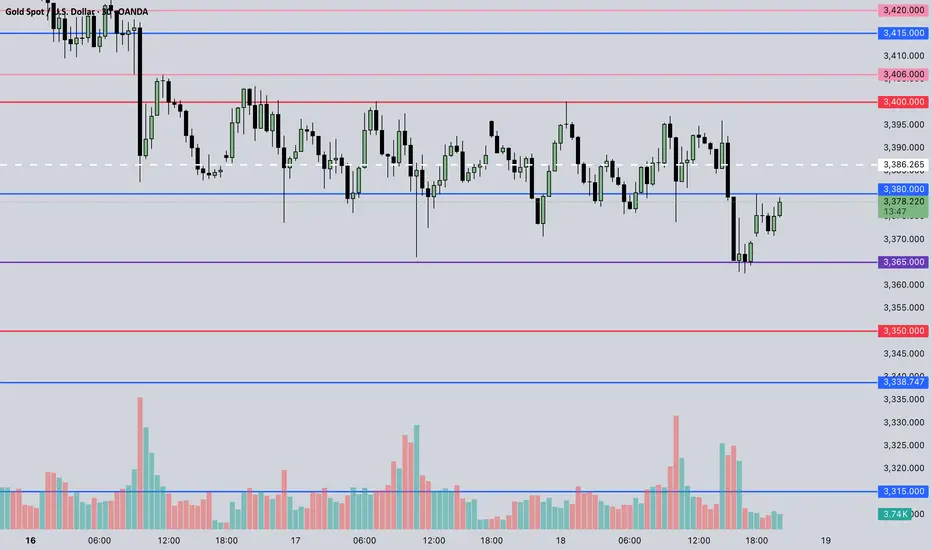
June 19, 2025 - XAUUSD GOLD Analysis and Potential OpportunitySummary:
Gold continues to trade within the 3365–3400 range without a decisive breakout.
Today’s strategy: Sell near resistance, buy near support while the range holds.
If price holds above 3386, bullish momentum may gradually strengthen.
🔍 Key Levels to Watch:
• 3420 – Resistance
• 3406 – Range top
• 3400 – Psychological level
• 3396 – Resistance
• 3386 – Bull-bear divider
• 3380 – Resistance
• 3371 – Support
• 3365 – Intraday key support
• 3350 – Midpoint support
📉 Intraday Strategy:
1. SELL if price breaks below 3365 → watch 3360, then 3355, 3350, 3346
2. BUY if price holds above 3386 → watch 3391, then 3396, 3400, 3403
👉 If you found this useful, please drop a like! Your support lets me know whether there’s demand for a post on how I enter and place stops — still planning to release it soon!
Disclaimer: Personal view, not financial advice. Trade with discipline and manage your risk.
USDCAD – Bullish Reversal After Completed Wave 5 and AO DivergenAnalysis:
The USDCAD daily chart shows a textbook completion of an Elliott Wave 12345 sequence. Wave (5) has just completed, supported by clear bullish divergence on the Awesome Oscillator (AO) – a classic signal suggesting exhaustion of bearish momentum.
What strengthens the bullish reversal bias is the presence of a bullish engulfing candle at the end of Wave (5), right at a key structural low. This candle formation, combined with the divergence, provides strong evidence that a corrective wave (likely Wave A or a larger reversal) may be underway.
🔍 Key Confluences:
Wave 5 ends in a falling wedge structure.
AO shows higher low on Wave 5 compared to Wave 3 → Bullish Divergence.
Bullish engulfing candle confirms momentum shift.
Price action breaking out of the wedge pattern.
🎯 Trade Plan:
I am waiting for a pullback toward the breakout zone to find an optimal buy entry. The ideal entry would be a retest of the bullish engulfing candle low or broken wedge resistance, turning into support.
📈 Targets:
Initial short-term target: ~1.3850 (previous Wave 4 region).
Mid-term potential: ~1.4050 depending on structure development.
🛑 Invalidation:
A daily candle closing back below the low of the bullish engulfing will invalidate the bullish outlook.

XAUUSDBuy bias
Reasons might include:
*Market Uncertainty: Investors often turn to gold when there’s fear or instability.
*Technical Signals: Charts may show patterns suggesting upward movement.
*Demand for Safety: In times of tension or bad economic news, gold is seen as a safe place to hold value.

RIOT / 2hNASDAQ:RIOT
The rise of 2.9% today may have completed a 4th wave correction in the leading diagonal wave A. So, a swift decline of 11% is expected to follow as the diagonal's 5th wave.
Wave Analysis >> The leading expanding diagonal in Minor degree wave A, as the first subdivision of the ongoing correction in wave (2), indicates that a relatively deep correction in wave (2) might be developed.
Trend Analysis >> The trend is correcting down in the same degree wave (2), which will take a few weeks to develop downward.
The retracement targets >> 8.76 >> 8.20 >> 7.93 >> 7.67
#CryptoStocks #RIOT #BTCMining #Bitcoin #BTC

UX2! Uranium Futures OutlookExpecting a continuation higher on COMEX:UX2! uranium futures, looking for a wave 5 in red to unfold.

A bullish breakout from the descending channel is anticipated.Chart Breakdown
🔻 Price Action & Structure:
The market is currently trending downward within a descending channel, marked by two parallel white trendlines.
The current price is around 1.14797, with visible lower highs and lower lows, indicating a short-term bearish trend.
🔄 Projected Move:
A bullish breakout from the descending channel is anticipated.
The white projected path shows:
A dip toward the demand zone (highlighted in teal-green) around 1.13400–1.13800.
A reversal from that zone, forming higher highs and higher lows.
A move toward the upper liquidity zone, labeled EQH (Equal Highs) around 1.16000, suggesting a target for buy-side liquidity.
🧠
EQH = Equal High Liquidity
:
The EQH zone marks an area where previous highs are equal or nearly equal — a common target for price manipulation or stop-hunting.
It’s expected that the market will sweep this area for liquidity before possibly reversing or continuing.
💡 Interpretation:
The setup reflects a liquidity-based strategy using smart money concepts.
Bearish short-term → bullish medium-term outlook.
Potential trade idea: Wait for price to tap the lower demand zone, then look for entry confirmation (e.g., bullish engulfing or Ch0CH) to ride toward EQH.
