The chart illustrates a recent downtrendChart Overview
⚙️ Price Action:
The chart illustrates a recent downtrend, followed by consolidation near the current level of $104,933.
A bullish reversal structure is forming, marked by the label “Ch0CH” (Change of Character), which suggests a potential trend shift from bearish to bullish.
🧠
Liquidity Concept
:
The chart highlights a horizontal line labeled “Equal High Liquidity” around the $108,800 level.
This area suggests a liquidity pool where stop orders might be resting above the equal highs.
Market makers may drive price toward this area to collect liquidity before reversing or continuing.
📈
Projected Price Path
:
A white dotted line projects a possible bullish move:
First, a minor retracement or accumulation phase.
Then, an upward impulse aiming to take out the equal highs near $108,800.
🧩 Interpretation:
This chart implies a bullish outlook based on:
Break in bearish structure (Ch0CH).
Liquidity draw above equal highs.
Anticipation of smart money concepts (e.g., liquidity sweeps, inducement moves).
Wave Analysis

WULF / 2hNASDAQ:WULF 18% market sell-off in almost a couple of weeks has developed a five-wave sequence in the impulsive wave (c), which would likely now extend in its 5th subdivision.
So, a further decline of 17% is anticipated to extend the wave (c) of an expanding flat formation as the entire correction in wave b(circled).
The Retracement Targets >> 3.45 >> 3.20
#CryptoStocks #WULF #BTCMining #Bitcoin #BTC

USDCAD Wave Analysis – 18 June 2025- USDCAD broke daily down channel
- Likely to rise to the resistance level at 1.3730
USDCAD currency pair recently broke the resistance trendline of the daily down channel from the start of May.
The breakout of this down channel follows the earlier upward reversal from the pivotal support level 1.3545 coinciding with the lower daily Bollinger Band.
USDCAD currency pair can be expected to rise to the next resistance level at 1.3730 (former strong support from May).

Gold Wave Analysis – 18 June 2025
- Gold reversed from resistance level 3445.00
- Likely to fall to support level 3300.00
Gold recently reversed with the Bearish Engulfing from the resistance level 3445.00, which is the lower border of the resistance area which has been reversing the price from April.
The resistance level 3445.00 was further strengthened by the upper daily Bollinger Band.
Given the strength of the resistance level at 3445.00 and the bearish divergence on the daily Stochastic indicator, Gold can be expected to fall to the next support level at 3300.00 (the low of the previous minor correction ii).

GBPNZDprice is reaching main support/OB area, price will likely reverse either HH or just for downtrend correction because price is still downtrend.. all htf showing reversal on bearish side but price is still in uptrend on htf so this is just idea for correction... use proper risk

2025-06-18 - priceactiontds - daily update - daxGood Evening and I hope you are well.
comment: Market has not traded above prior day’s high for 9 sessions. Can we do 10 and accelerate down? I would love it but it’s getting a bit unlikely without a better pullback. I can not see bulls coming back from this tbh but I have been wrong about this before. Bears need a big breakout below and accelerate down. Bulls some higher highs to continue sideways between 23000/24000.
current market cycle: broad bull channel on the weekly chart. Daily chart is in a trading range 23000 - 24500
key levels: 23000 - 24000
bull case: Any higher high will do and could lead to couple of legs up for 24000. Whole story because right now they don’t have any arguments besides having support around 23300 and bears unable to make meaningful lower lows. Time-wise we have been going down for 9 sessions and at some point bulls will give up hope and we flush down if they don’t reverse strongly over the next 1-2 sessions.
Invalidation is below 23000.
bear case: Clear target for bears is 23000 and leaving behind a decent gap 23700-24000. They are favored since we are only printing lower highs. Bears have to keep it below 23400 or risk hopeful bulls buying for 23505 which was last week’s close and if we close this week above it, it will be a weekly bull bar and likely a doji. That’s neutral and good for bulls. For this to go down, bears have to print a weekly bar closing on it’s low and below prior support.
Invalidation is above 23500.
short term: Neutral around 23300 but I think we can do 23000 this week. Don’t bet on the breakout before it happens. Shorts closer to 23500 are likely good, unless strong bulls overwhelm the bears tomorrow.
medium-long term from 2025-06-15: Bull trend has most likely concluded. Long term shorts are fine. Stop has to be at least 24508. I see it 70% or more that we will see 22000 before end of August.
trade of the day: Selling anything close to 23400 and buying anything at 23300. The early pump before EU open was a nasty bull trap but shorts with stop above yesterday’s high 23567 were the obvious trade.

EUR-NZD Will Go Down! Sell!
Hello,Traders!
EUR-NZD made a retest
Of the horizontal resistance
Level of 1.9100 and made a
Nice pullback so we are bearish
Biased and we will be expecting
A further bearish move down
Sell!
Comment and subscribe to help us grow!
Check out other forecasts below too!
Disclosure: I am part of Trade Nation's Influencer program and receive a monthly fee for using their TradingView charts in my analysis.

Bitcoin Crash to $93k is Progressing Well! But be Careful Now!I have explained the price action of Bitcoin, shared my insights on what will happen next, and updated my previous idea on $BTC!
Smash the rocket button if you feel the Bitcoin bearish vibe!

Intel - The rally starts!Intel - NASDAQ:INTC - creates a major bottom:
(click chart above to see the in depth analysis👆🏻)
For approximately a full year, Intel has not been moving anywhere. Furthermore Intel now trades at the exact same level as it was a decade ago. However price is forming a solid bottom formation at a key support level. Thus we can expect a significant move higher.
Levels to watch: $25.0
Keep your long term vision!
Philip (BasicTrading)

Nasdaq - This starts the next +50% rally!Nasdaq - TVC:NDQ - might break out soon:
(click chart above to see the in depth analysis👆🏻)
Despite the quite harsh correction of about -25% which we saw in the beginning of 2025, the Nasdaq is clearly heading for new all time highs. It sounds almost incredible but if the Nasdaq breaks above the current confluence of resistance, a breakout rally of +50% will follow thereafter.
Levels to watch: $21.500, $33.000
Keep your long term vision!
Philip (BasicTrading)

USDCHF UPDATE Usdchf has pulled back to our Fibonacci level for an entry to the sell side. We await to the reaction of the market. The trade just became active and can be entered with the parameters as shown in the picture above

EURO/USD a sharp bearish move is anticipated.Key Technical Elements
1. Market Structure
BOS (Break of Structure):
Clearly marked where price breaks a previous high, indicating a shift in market structure.
Order Block:
A bullish order block is highlighted after the BOS, where price later retests — showing smart money interest.
Demand Zone:
A prior demand zone helped fuel the breakout to the upside earlier on the chart.
2. Resistance & Supply Area
A resistance zone is marked at the top (approx. 1.16067), where price previously reversed.
A red short-entry zone (supply area) indicates a potential sell zone where price could react.
3. Support Zones
Immediate Support around 1.1500
Deeper Support around 1.13995
These levels are potential take-profit zones or retracement targets.
---
Trade Idea Highlighted
Entry Zone: Around 1.15579 (current price)
Bearish Expectation:
Price is expected to rally slightly into the red zone (supply).
After rejection from this area, a sharp bearish move is anticipated.
Targets:
First Support Zone (~1.1500)
Second Deeper Support (~1.13995)
---
Professional Commentary
This setup reflects a Smart Money Concept (SMC) strategy:
It uses order blocks, BOS, and liquidity zones to anticipate market direction.
The trader anticipates a lower high formation near resistance and a continuation to the downside.
Good use of confluence between structure, supply/demand, and support/resistance.

Amd - This is just the beginning!Amd - NASDAQ:AMD - perfectly plays out:
(click chart above to see the in depth analysis👆🏻)
Despite the harsh drop of about -65% which we have been witnessing starting back in 2024, Amd remains bullish. Just three months ago, Amd retested a textbook confluence of support. We saw bullish confirmation, the bottom is in and Amd will rally significantly from here.
Levels to watch: $200, $300
Keep your long term vision!
Philip (BasicTrading)

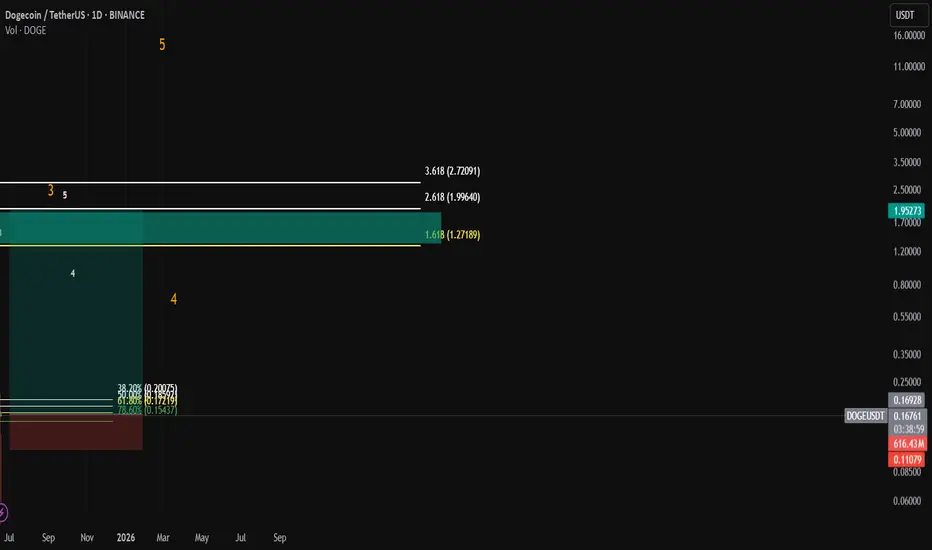
DOGE/USDT trade planThe chart shows a completed WXY correction followed by a triangle (ABCDE), marking the end of the larger correction at Wave 2.
Currently, Wave 3 is underway, with potential to enter the explosive sub-wave 3 of 3 soon. it will be the runner don't forget this coin
32RR trade setup
Entry Zone (Buy Area):
Between 0.154 – 0.172 USDT
Supported by:
61.8% Fib retracement: 0.172
78.6% Fib retracement: 0.154
Strong structural support from previous breakout zones.
🟥 Stop Loss (SL):
Below 0.110 USDT
A break below this invalidates the bullish impulse wave count.
TP1 ~$1.27
TP2 ~ $1.99
TP ~ $2.72
⚠️ Risk Note: Not financial advice. Use proper risk management
XAUUSD İmpulsive wave continuationWe have started our next impulsive wave. Elliot Wave is not some magic tells us future but eliminating all the possibilities while market pricing fundementals and clear patterns. so when we have left with only very limitided posibilities we know how to position ourselves.
here is one of thoose handful of options left in the hand. short term targets : 3469-3531

XAUUSDHolding buy side. it s been staying in the range of 38.2 and 61.8 fibo levels. it will need to h1 candle body brake 3401.

XAUUSD Next Move up and wait for another setupSince this last correction from 3460 to 3368 i was considering upwards double zigzag or an impulse wave and small posibilty of ending diagonal. when i looked into smaller time frame counts and also this delaying correction moves with interesting fibonacci levels i am convinced to that maybe we are in an ending diagonal. so what i am going to do is i will full tp all my positions at 3445-3450 area and watch for another setup. if this is an ending diagonal we might see another big impulse correction wave towards 3100-2950, and if this is a double zigzag or an impulse we can buy after clear upbrake candles. so it s better to take tp and watch until it becomes more clear for safety.
target 3445.

Hanzo / Gold 30 Min ( Accurate Tactical Break Out Zones )🔥 Gold – 30 Min Scalping Analysis (Bearish Setup)
⚡️ Objective: Precision Breakout Execution
Time Frame: 30-Minute Warfare
Entry Mode: Only after verified breakout — no emotion, no gamble.
👌Bullish After Break : 3412
Price must break liquidity with high volume to confirm the move.
👌Bearish After Break : 3372
Price must break liquidity with high volume to confirm the move.
☄️ Hanzo Protocol: Dual-Direction Entry Intel
➕ Zone Activated: Strategic liquidity layer detected — mapped through refined supply/demand mechanics. Volatility now rising. This isn’t noise — this is bait for the untrained. We're not them.
🦸♂️ Tactical Note:
The kill shot only comes after the trap is exposed and volume betrays their position.
Hanzo / Gold 30 Min ( Accurate Tactical Break Out Zones )

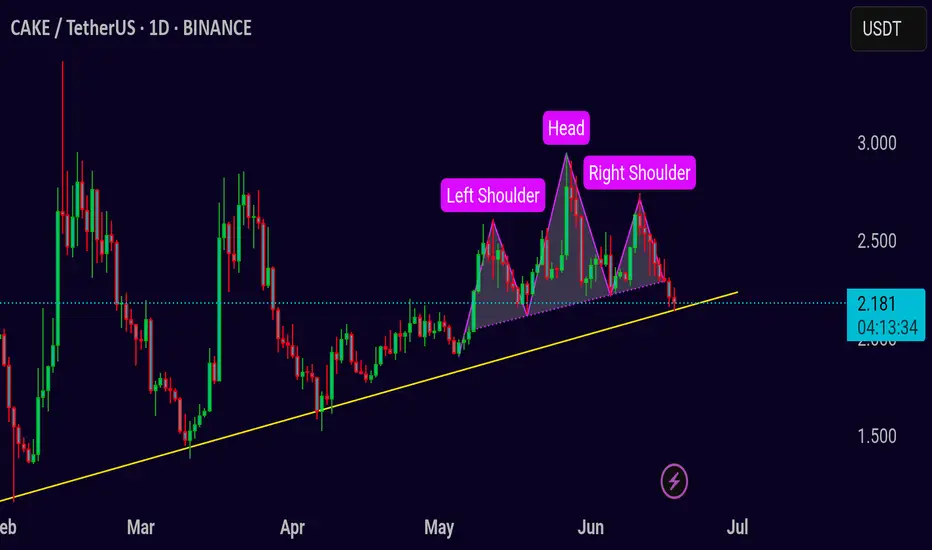
CAKE/USDT – Head & Shoulders Breakdown in Play Pair: CAKE/USDT 💱
Timeframe: 1D 📅
Pattern: Head and Shoulders Top 🧠
CAKE is developing a clear head and shoulders pattern on the daily chart, often seen as a bearish reversal setup. Price is currently testing the neckline support around 2.18, which also aligns with an ascending trendline. A breakdown here could trigger downside continuation.
Bearish scenario ❌
If CAKE closes below the neckline and trendline (under 2.15–2.10):
🎯 Target 1: 1.85
🎯 Target 2: 1.55
🛑 Stop loss: above 2.45 (right shoulder top)
Bullish reclaim ✅
If bulls defend the neckline and reclaim 2.35 with strong volume, the pattern may invalidate and lead to a rally.
⚠️ Volume confirmation is key — wait for a clean break and retest for confirmation.
Bitcoin Cash BCH price analysisMore than 3 months have passed since the publication of the previous idea for #BCH, and the price itself has shown an increase of +40%
◆ Slowly but surely growing
◆ Does not react to the price fall CRYPTOCAP:BTC (for those who don't know, #BCH is the first CRYPTOCAP:BTC fork and probably the only one that survived. Then there were 8-10 more of them in 2017-2018... but hey...)
◆ It has been moving in its own direction for more than a year, when OKX:BCHUSDT is cheaper than $300, it is actively bought back by someone.
We have slightly revised the growth target for #BitcoinCash, but why not consider this asset as a long-term investment from $350-400 to $900 and $1250
_____________________
Did you like our analysis? Leave a comment, like, and follow to get more

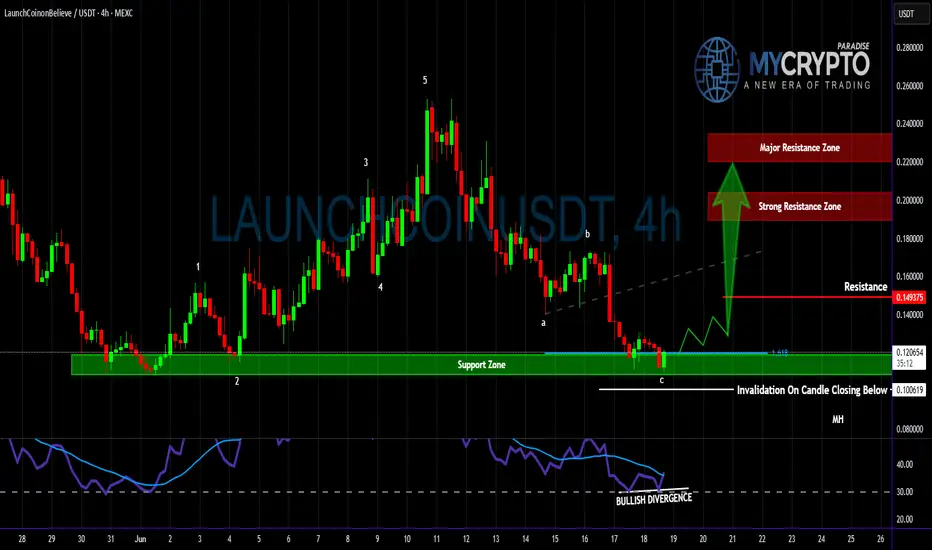
Wave C Complete — Time for the Real Move on LaunchCoin?Yello, Paradisers! Is #LaunchCoin about to reverse from its brutal downtrend? After completing a probable ABC correction right at key support, the conditions are setting up for a potential bounce — but only for those patient and prepared.
💎#Launchcoinusdt ,We’re most likely looking at the final leg of a Zig-Zag correction pattern, with wave C landing precisely within a well-defined support zone between 0.1006 and 0.1060. This zone has held up well so far, and there’s a clear bullish divergence forming on the RSI, which statistically increases the probability of a short-term reversal from this level.
💎The structure suggests we’re near a local bottom, but follow-through is essential. A sustained reclaim of the 1.618 Fibonacci extension level could act as a confirmation trigger for further upside. If that occurs, we expect price to approach the next resistance at 0.1493, followed by a strong resistance zone between 0.1900–0.2000, and eventually the major resistance around 0.2200–0.2350.
💎However, invalidation remains clear: any 4-hour candle closing below 0.1006 would reduce the probability of this bounce playing out and shift the bias back toward further downside. Until then, the setup remains valid and tradable for those who follow a structured and disciplined approach.
Paradisers! we are playing it safe right now. If you want to be consistently profitable, you need to be extremely patient and always wait only for the best, highest probability trading opportunities.
MyCryptoParadise
iFeel the success🌴
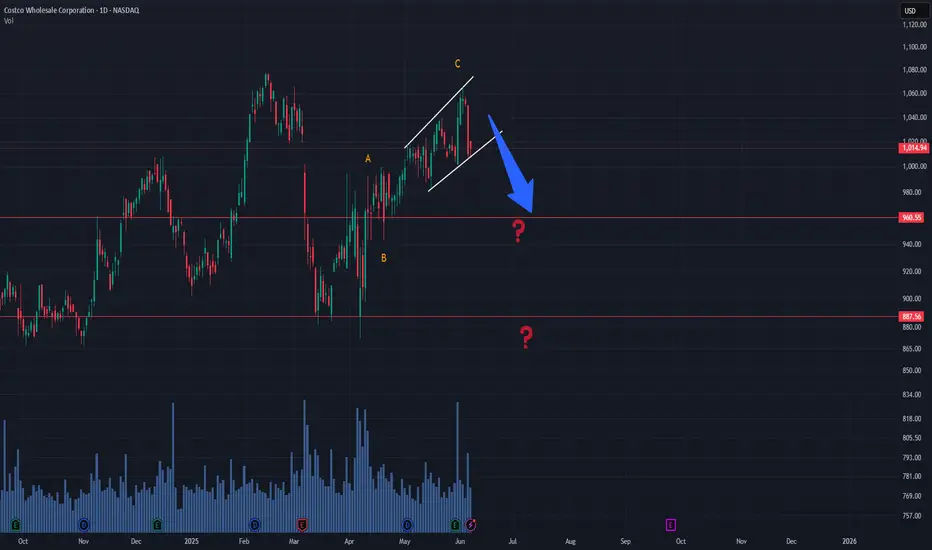
COST ABC Structure CompletedThe ABC correction may have completed, with the final C leg forming inside a diagonal structure. A sharp drop started from $1,066. Traders should wait for a potential corrective reaction before entering a short position.
It's important to note that as long as the diagonal channel remains intact, the zigzag structure can still extend. A clear break below the diagonal would confirm bearish continuation toward the $960 zone.
GBPUSD Will FOMC and BOE Drive the Next Move?GBPUSD Will FOMC and BOE Drive the Next Move?
GBPUSD completed a bearish harmonic pattern near the end of May, signaling downside potential.
Despite multiple attempts to decline, rising geopolitical tensions in the Middle East and the FED’s reluctance to cut rates have kept price movements in check.
The pair repeatedly tested the 1.3600 resistance zone, but finally moved down by nearly 160 pips yesterday.
With the FOMC Interest Rate decision today and BOE’s rate announcement tomorrow, the market could see a rebound ahead of FOMC for a larger correction, potentially setting up for a decline tomorrow.
While this remains an assumption for now, as long as the harmonic pattern remains valid, further downside remains a possibility.
You may find more details in the chart!
Thank you and Good Luck!
❤️PS: Please support with a like or comment if you find this analysis useful for your trading day❤️
Disclosure: I am part of Trade Nation's Influencer program and receive a monthly fee for using their TradingView charts in my analysis.
