AUDUSD Analysis – Falling from the Rising WedgeAUDUSD pair broke below an ascending wedge, a bearish reversal pattern.
Clean rejection from 0.6518, with lower highs and new lower lows confirming bearish momentum.
Price is now sitting below former trendline support, retested and respected as resistance.
Bearish target points toward 0.6400–0.6380 zone, aligning with recent swing lows.
Risk invalidation sits above 0.6520, where structure fails.
Technical Bias: Bearish
Target: 0.6400
Stop-loss zone: Above 0.6520
📊 Current Bias: Bearish
🔍 Key Fundamentals Driving AUDUSD
AUD Fundamentals (Weakening):
Australian jobs data was mixed, and wage growth has plateaued.
RBA remains cautious, with expectations for rate cuts later in 2025.
AUD pressured by China growth risks and weak commodity demand.
Geopolitical drag: Australia-China tensions and weak Chinese retail data from 618 Festival dampen AUD outlook.
USD Fundamentals (Resilient):
USD remains bid on risk-off flows, especially after weak global data and ongoing Middle East tensions.
Fed remains reluctant to cut fast despite disinflation signs – supports the USD.
US data is mixed, but rate cut odds are declining (only one expected in 2025 now per dot plot).
⚠️ Risks to This Bearish View
If China announces new stimulus, AUD could rebound sharply.
A dovish surprise from the Fed (e.g. Powell softening in speeches).
Sharp rebound in risk appetite (e.g. tech-led equity rally).
🗓️ Important Events to Watch
🇨🇳 China industrial profits & PMIs
🇦🇺 RBA Meeting Minutes (July preview hints)
🇺🇸 US Core PCE (June 28)
Global risk tone: watch metals, equities, and geopolitical headlines.
🚀 Which Asset Leads?
AUDUSD is lagging other USD pairs, but will likely lead commodity FX downside if China or metals weaken further.
Watch AUDJPY and EURAUD for further confirmation of risk-off flows and Aussie weakness.
Wave Analysis

EURNZD: Bearish Setup in Play?EURNZD Faces Resistance Within Defined Range – Bearish Setup in Play?
EURNZD appears to be forming a range-bound trading structure, with key levels defined between 1.9050 and 1.9230.
Yesterday, price action tested the upper boundary at 1.9230, where it encountered strong resistance.
If the pair fails to break above this level and sustains trading below it, bearish momentum could build throughout the day.
While the setup carries some risk due to the range environment, it offers potential for downside movement.
Intraday targets: 1.9150; 1.9100 ; 1.9050
You may find more details in the chart!
Thank you and Good Luck!
❤️PS: Please support with a like or comment if you find this analysis useful for your trading day❤️
Disclosure: I am part of Trade Nation's Influencer program and receive a monthly fee for using their TradingView charts in my analysis.

USDCAD Analysis – Breaking the Chains, Eyeing 1.38+USDCAD Price broke out from a long descending channel, followed by two bullish continuation flags – classic breakout-retest pattern.
Price is now pushing above 1.3720, aligning with the 38.2% Fib level of the prior drop.
Next upside targets:
🔹 1.3833 (Fib 61.8%)
🔹 1.3913 (Fib 78.6%)
Clear stop level: below 1.3625 (channel breakout support)
Structure Bias: Bullish continuation. Clean breakout + consolidation = probable impulse toward 1.3830/1.39.
📊 Current Bias: Bullish
🔍 Key Fundamentals Driving USDCAD
USD Drivers (Neutral to Bullish):
Fed held rates, dot plot shows only 1 cut in 2025, but Powell's tone leaned dovish.
US Retail Sales + PPI were weak, but safe-haven USD demand persists due to geopolitical risks and equity volatility.
Market reassessing Trump election risk, Fed independence, and inflation stickiness.
CAD Drivers (Bearish):
Oil prices are volatile due to Middle East tensions, but weak demand caps upside.
Canada’s CPI softened, BoC already delivered a dovish cut earlier this month.
CAD under pressure due to dovish BoC outlook and fiscal concerns (gov't budget deficits expanding).
CAD is also suffering from reduced foreign investment flows.
⚠️ Risks to Watch
Oil price spikes (especially if Strait of Hormuz risk escalates) may boost CAD short-term.
A sharp reversal in DXY or Fed commentary shift toward aggressive easing.
Weak US data next week (Core PCE especially) could unwind USD momentum.
🗓️ Upcoming Events to Watch
US Core PCE (June 28) – critical inflation gauge for the Fed
BoC Business Outlook Survey
Oil Inventories + Global energy sentiment
Geopolitical: Israel–Iran updates and Canada’s fiscal signals
🏁 Which Pair Leads the Move?
USDCAD is leading commodity crosses as CAD weakness broadens. Watch USDCAD and GBPCAD for signs of CAD softness before others like AUDCAD/NZDCAD follow.

The shift from safe-haven attributes to monetary policy driven!The long-short game of gold prices intensified, the Fed's hawkish signals and the strengthening of the US dollar put pressure on gold prices, and the geopolitical risk premium and inflation expectations formed support. In the short term, the escalation of the Israel-Iran conflict may promote safe-haven buying, but the Fed's policy path and the actual implementation of trade policies will dominate the medium- and long-term trends. Focus on the US policy trends towards Iran, the progress of the Iran nuclear agreement negotiations, and the Fed's inflation response stance in the next two weeks. It is necessary to pay attention to the game between Iran's warnings on third-party intervention and the potential risks of possible US intervention. This uncertainty provides phased support for gold prices.
The intraday trading strategy of gold this trading day, the range and the break need to be paid attention to simultaneously. The current bearish trend continues, the 3385 resistance in the Asian session is effective, and the rebound relies on the 3360-3365 suppression to maintain the high-altitude strategy, and the support below is the 3330-3320 area. Against the background of the continuous downward shift of the center of gravity, 3375-3385 constitutes a short-term key suppression. Before the breakthrough, I suggest maintaining a bearish mindset. Resistance range 3375-3385, support range 3330-3320.
It is recommended to buy gold near 3347 during the day, and take profits in the target range of 3360-3400!
Gold rebounds to the 3360-3365 area and sells. If it breaks through 3365, you can consider covering your position in the resistance area of 3375-3385 and continue to sell. The target is 3340-3320!

BTC - Key Battle Between Bulls and Bears – Symmetrical TriangleBitcoin ( BINANCE:BTCUSDT ) is currently consolidating within a Symmetrical Triangle , showing indecision among Bulls and Bears around the Support zone($104,380-$103,060) and just above the 50_SMA (Daily) .
From an Elliott Wave perspective, the current range may represent a WXY corrective structure . The market seems to be waiting for a breakout direction , potentially aiming to complete wave 5 after this correction.
The Monthly Pivot Point($103,300) and the presence of significant Cumulative Liquidation Leverage Zones (both Long and Short ) are key liquidity magnets to watch in the short term .
I expect Bitcoin to re-attack the Support zone($104,380-$103,060) AFTER breaking the lower line of the Symmetrical Triangle Pattern and decline to the targets I have outlined on the chart.
Note: Stop Loss: $106,703 = Worst Stop Loss(SL)
Please respect each other's ideas and express them politely if you agree or disagree.
Bitcoin Analyze (BTCUSDT), 1-hour time frame.
Be sure to follow the updated ideas.
Do not forget to put a Stop loss for your positions (For every position you want to open).
Please follow your strategy and updates; this is just my Idea, and I will gladly see your ideas in this post.
Please do not forget the ✅' like '✅ button 🙏😊 & Share it with your friends; thanks, and Trade safe.

WC: 23.46 Target: 1800-2400 MOASS: 47k-100K: Cycles & MomentumLet me start by saying that I still do not think the 20 Week Cycle Theory has been invalidated
We are only a couple weeks in on what is again a 20 WEEK CYCLE
With that in mind based on the cycle view displayed, at this point, I have to assume this cycle will be similar to the last cycles in that the price appreciation should take place aligned with the GREEN vertical lines...which corresponds with the end of July/ beginning of Aug timeframe
The question is what does the price action look like in the meantime?
A lot of that depends on what the broader market looks like and what levels hold on GME
I do not have a crystal ball
For what its worth I have additional buys set to trigger at 21.50 and 22 with a tight stop loss in case of any moves lower
Ok now lets talk momentum
GME is obviously vary volatile and extremely beholden to the options market
I have been working for months behind the scenes on fine tuning my custom indicators to provide a stable view of increases/ decreases in momentum..and have now reached that point
On the below indicator view , generally speaking, if all 3 Histograms are GREEN and ABOVE the ZERO LINE then price is showing HIGH BULLISH MOMENTUM...and vice versa for Selling Momentum
So with that said as you see GME is still showing a lot of weakness and until we see the bullishness conditions mentioned above I expect price action to be somewhat muted
GOOD TRADING TO YOU ALL

BTC SidewaysBTC is in a distribution phase for a while now.
Sideways for the rest of the year.
My average selling price is ~103.000$.
It was a nice ride.
I am out of this! ✌

Bearish Elliot Idea on daily timeframeHere is a elliot wave count bearish Idea on the 1 day timeframe, retract to tap liquidity between 410-420 as a B then break daily trend line and continue down to 0.618/0.786 fib levels
ALTCOIN LINKUSDT FORECAST EYES ON 4-7JULY!"Wait until July 4–7. Do not trade next week, as it will be similar to the previous one.
I think Monday will be bearish, followed by bullish days on Tuesday, Wednesday, and Thursday. On Friday, the top will likely be set—then start shorting for the following week."

APPLE The Target Is DOWN! SELL!
My dear friends,
APPLE looks like it will make a good move, and here are the details:
The market is trading on 200.92 pivot level.
Bias - Bearish
Technical Indicators: Supper Trend generates a clear short signal while Pivot Point HL is currently determining the overall Bearish trend of the market.
Goal - 198.42
About Used Indicators:
Pivot points are a great way to identify areas of support and resistance, but they work best when combined with other kinds of technical analysis
Disclosure: I am part of Trade Nation's Influencer program and receive a monthly fee for using their TradingView charts in my analysis.
———————————
WISH YOU ALL LUCK

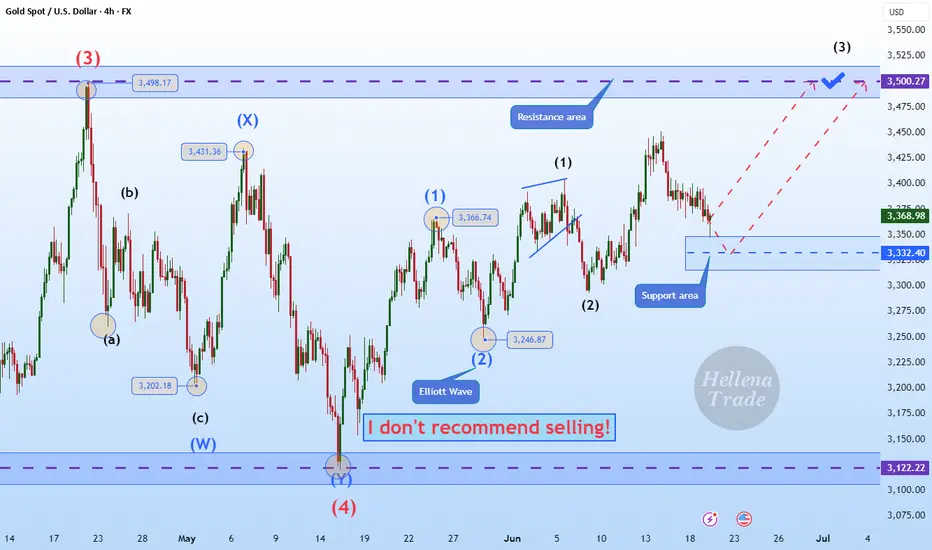
Hellena | GOLD (4H): LONG to resistance area of 3500 (Wave 3).Colleagues, the correction did take place and was quite deep, as I wrote earlier.
However, I am leaving my target unchanged—the resistance area and the maximum of wave “3” of the higher order at 3500.
The waves remain in their previous places, because none of the rules of wave analysis have been violated.
Manage your capital correctly and competently! Only enter trades based on reliable patterns!
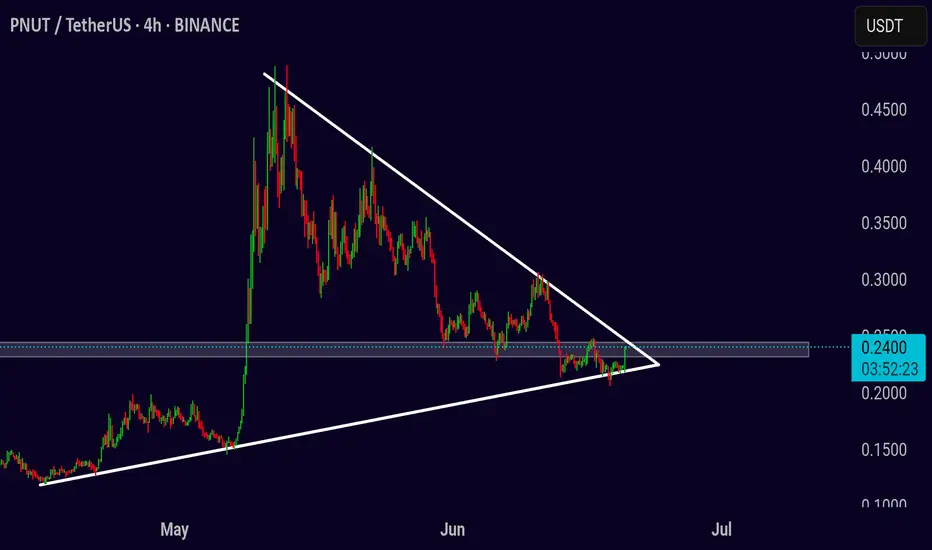
PNUT/USDT – Breakout Watch from Symmetrical TrianglePNUT/USDT – Breakout Watch from Symmetrical Triangle
Chart pattern: Symmetrical Triangle
Timeframe: 4-Hour
Published: June 20, 2025
PNUT/USDT is nearing the apex of a symmetrical triangle that has been forming over several weeks. The price is tightening between rising support and descending resistance, indicating a breakout is likely approaching soon.
Price is currently testing the upper boundary near 0.24. A breakout from this level with strong volume may trigger a bullish move, while rejection could keep price inside the range a little longer.
Bullish scenario
Entry: 4H close above 0.245 with volume
Target 1: 0.28
Target 2: 0.33
Stop-loss: Below 0.22
Bearish scenario
Entry: Break below 0.215
Target 1: 0.18
Target 2: 0.14
Stop-loss: Above 0.24
Wait for confirmation before acting — momentum will likely follow once the triangle breaks.
GOLD - 1H TFHere are the 2 zones I'll be looking to add additional entries. Waiting for Wave 2 completion & a push up.
Zone 1 - Current CMP
Zone 2 - $3,338 - $3,332
Could even look for 'sell to buy' trades, depending on your risk appetite and risk management.

ETH ~Expansion done.Based on 3marketphase.
(contraction-expansion-trend, I learned this concept from dayya trading post)
ETH is at the box range.
(triangle-2024 August to October)
Plus, there is throwing-over with double-top (1week candle scale).
This means ethereum is at the end of contraction phase and it has high potential to trend phase. But I bet there is one more break-out from low before trend phase.
Keep an eye on all of break-out movements.

Bitcoin Volatile After Fed Governor Hints at July Rate Cut!
Waller made these comments in an interview with CNBC on Friday, just two days after the Federal Reserve voted to keep interest rates unchanged for the fourth time in a row. Waller's dovish comments boosted Bitcoin, but only briefly.
Perhaps the constant insults from US President Donald Trump are finally having an effect, as Federal Reserve Governor Christopher Waller hinted at a rate cut "as early as July" in an interview with CNBC on Friday.
Crypto and stock markets initially rallied on the news, with Bitcoin climbing to over $106,000, but the cryptocurrency has retreated to $104,000 as of press time. Market performance was mixed, with the Dow up 0.16%, while the S&P 500 and Nasdaq fell 0.26% and 0.64%, respectively. Crypto markets also underperformed, initially rising 0.47% before falling 0.13% at the time of writing.
Trump has been making fun of Federal Reserve Chairman Jerome Powell for weeks, calling him a "dumb," "stupid," and "dumb" for not cutting rates. The president even coined the nickname "Too Late," accusing Powell of being slow to move and not moving fast enough to lower rates. But now, at least according to Waller, the president may soon see the rate cut he has been calling for, possibly as soon as next month.
"I think we're in a position where we could do that, and it could be as early as July," Waller said, referring to a potential rate cut. "That would be my view, and whether the committee would agree to it is another matter."
Bitcoin is currently hovering around $104K, trading between $103,932.09 and $106,539.38 over the past 24 hours. The current price represents a slight loss of 0.05% on the day, and a 1.22% drop over the past week.
Trading volume rose 1.54% to $42.65 billion, showing continued interest from market participants. Bitcoin's total market capitalization fell slightly to $2.07 trillion, down 0.06% from the previous day. Despite its choppy performance, BTC's market cap share rose slightly to 64.94%, indicating a slight increase in funds outflow from other cryptocurrencies.
Meanwhile, BTC futures open interest increased by 0.90% to $700.9 billion, which could mean increased speculation in the derivatives market. A total of $40.03 million in long positions were liquidated in the past 24 hours, painting a picture of overly aggressive bull market participants. At the same time, $22.61 million in short positions were also liquidated, totaling $62.64 million since yesterday.

Bitcoin (BTC/USDT) – Bearish Breakdown in Play (4H)BTC has lost key support at $103,573 on the 4-hour timeframe, breaking down from the recent consolidation zone. The rejection from the lower highs and weakening RSI suggest more downside pressure ahead.
Technical Breakdown:
Support Broken: $103,573 (now acting as resistance)
Current Price: $102,246
Next Key Support Zones:
$101,410 (short-term bounce zone)
$97,340 – critical horizontal support
$93,343 – potential deeper flush area
Resistance to Watch:
$103,573 (retest = short opportunity)
$105,807 (major rejection zone)
Short Setup (Signal Style):
Short Entry: ~$103,500 (if retested)
Stoploss: Above $105,800
Targets:
TP1: $101,400
TP2: $97,300
TP3: $93,300
Final Note:
Trend remains bearish below $103.5K. Bulls need to reclaim that level fast or further downside becomes likely.
Not financial advice. DYOR.

TESLA SHORT SELL ANALYSIS – JUNE 21, 2025 (NASDAQ 100 | S&P 500)Technical Analysis/Short Sell Call: TESLA (U.S STOCK)
Current Status: Tesla recently reached a high of $368 in an uptrend within a larger downtrend. However, it broke down the trend line (marked in red dashed lines) and made a downward spike. Volumes suggest the stock is expected to continue its downward momentum.
Technical Outlook: The breakdown of the bullish trend line and the formation of a downward spike indicate potential further decline. Additionally, a bearish excess line formed around $330. Given the current technical setup, Tesla seems like a good candidate for a short trade or exiting any previous long trades.
🚨 TECHNICAL SHORT SELL CALL – TESLA 🚨
Short Sell Level 1: $322 (Current Price)
Short Sell Level 2: $331
Short Sell Level 3: $335
Targets:
TP 1: $310
TP 2: $293
TP 3: $281
Stop Loss:
Above $345 on closing basis
Risk Reward: 1:7
Caution: Please sell in 3 parts within the selling range. Close at least 50% of your position at TP1 and trail the stop loss to protect profits in case of unforeseen market conditions.

Another drop for SPX500USDHi traders,
Last week SPX500USD broke the low of the previous week just as I've said in my outlook. After that it went up again. This pair is still in a bigger correction down.
So next week it could drop again into the direction of the bullish Weekly FVG.
Let's see what the market does and react.
Trade idea: Wait for a small correction up on a lower timeframe to trade short term shorts to the previous Weekly lows.
If you want to learn more about trading FVG's & liquidity sweeps with Wave analysis, then please make sure to follow me.
This shared post is only my point of view on what could be the next move in this pair based on my technical analysis.
Don't be emotional, just trade your plan!
Eduwave

GOLD → Continuation of the global trend... To 3350?FX:XAUUSD is testing trend support within a correction. Against a complex fundamental backdrop (the Middle East, Fed comments, Trump's desire to lower rates), the price may continue to rise.
The price of gold rose from a weekly low of $3,363 on Thursday thanks to increased demand for safe-haven assets following reports of possible US strikes on Iran. Markets are ignoring the Fed's hawkish decision to maintain its tight policy and rate forecasts. Traders are waiting for new signals from the Middle East, given the risk of increased volatility due to low liquidity in connection with the US holiday.
Technically, a bullish wedge pattern is forming as part of the correction. The breakdown of the pattern's support did not lead to a decline, but a return of prices and a breakout of resistance could trigger growth after liquidity returns.
Resistance levels: 3373, 3403, 3420
Support levels: 3349, 3320
Before growth, a retest of the trend support or the 3350 zone is possible. However, if the price goes above 3375 and the bulls hold their ground above this level, then we can expect growth to continue within the trend.
Best regards, R. Linda!

LONG WEEKFor me the bias is bullish for next week and beyond.
Weekly support tapped and 3500 is next big restance for a PB.
Then ATH.
Good area to look for swing longs, possible longtime runners.

BTCUSDTHello traders. Wishing each of you a great weekend ahead!
Even though it's the weekend, I’ve spotted a sell opportunity on the BTCUSDT pair and decided to share it with you. However, we should also keep in mind that weekend markets tend to have lower volume. That said, I will still proceed with this trade based on my own risk parameters and trading strategy.
🔍 Trade Details
✔️ Timeframe: 30-Minute
✔️ Risk-to-Reward Ratio: 1:2
✔️ Trade Direction: Sell
✔️ Entry Price: 103815.32
✔️ Take Profit: 102640.12
✔️ Stop Loss: 104402.06
🕒 If the trade does not continue with strong momentum, I will keep the position open only until 23:00 today. Otherwise, I will close it either in profit or at a loss depending on the price action.
🔔 Disclaimer: This is not financial advice. I’m simply sharing a trade I’ve taken based on my personal trading system, strictly for educational and illustrative purposes.
📌 Interested in a systematic, data-driven trading approach?
💡 Follow the page and turn on notifications to stay updated on future trade setups and advanced market insights.

Gold prices rebounded after the Fed meeting!
The trend of gold on Friday is still in line with my analysis. I will inform you that gold is mainly rebounding from the bottom on Friday. Don't chase the low position. As a result, gold hit the lowest level of 3340 and then fluctuated upward, reaching the highest level of 3374. It can be said that the market on Friday was not big, and it was mainly range-bound. We also went long at 3343-3345 and 3347-3353 many times, all of which ended with profit. Although there was no sudden increase of dozens of dollars, it was relatively satisfactory for Friday's market. I believe that friends who follow me can see that we will continue to go long next week. After all, the rebound trend on Friday still needs to continue next week. If your current gold operation is not ideal, I hope my article can help your investment. Welcome to communicate!
From the 4-hour analysis chart, the support below is around 3340-3345, and the short-term resistance above is around 3380-3385. Focus on the suppression of the 3408-3415 line. The overall trend remains unchanged, and the main tone of retracement and long participation remains unchanged. In the middle position, watch more and do less, and follow orders cautiously, and wait patiently for key points to enter the market. I will remind you of the specific operation strategy during the trading session, so please pay attention to it in time.
Gold will go long at the 3345-3353 line, with the target at the 3380-3383 line, and the break will look at the 3408-3415 line;

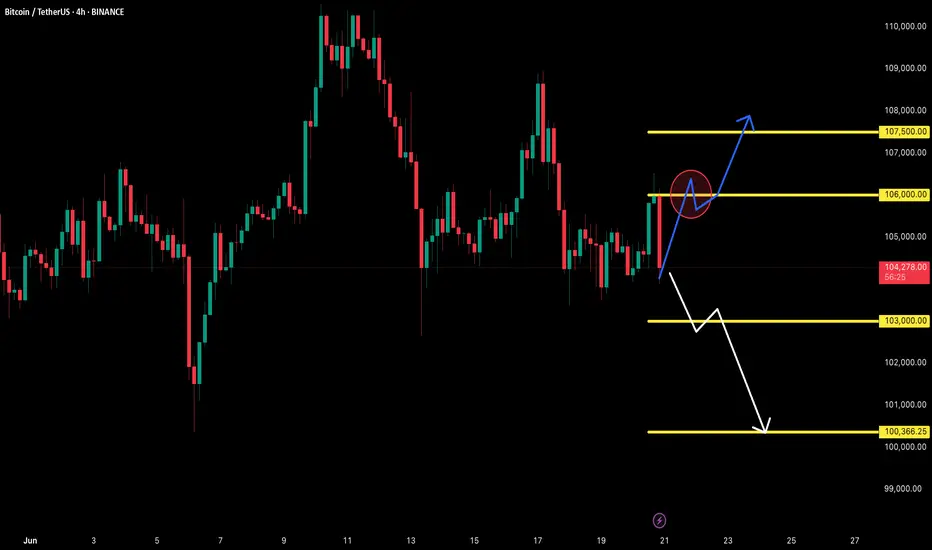
Bitcoin Eyes $108K as Momentum Gathers on Lower Timeframes
Bitcoin traded between $105,971 and $106,032 over the past hour, with a market cap of $2.10 trillion and 24-hour volume of $21.88 billion. The price fluctuated between $104,004 and $106,450 over the past 24 hours, reflecting a narrow intraday range consistent with technical uncertainty on larger timeframes.
Analysis of the 4-hour Bitcoin chart shows a weak recovery phase from the recent drop to $103,388. The volume profile shows an ascending candlestick indicating increased interest, accumulation, and momentum. The rounding bottom structure shows a possible shift in short-term sentiment. Buying power is visible in the $105,500 to $106,000 region, especially when $106,500 is breached forcefully.
Bitcoin Price Watch: Bulls Target 108K as Momentum Grows on Lower Timeframes
BTC/USD daily chart on Bitstamp on June 20, 2025.
Technical indicators offer mixed signals. Among oscillators, the Relative Strength Index (RSI), Stochastics, Commodity Channel Index (CCI), Average Directional Index (ADX), and Ultra Oscillator are neutral. However, the Momentum Oscillator shows positive sentiment, while the Moving Average Convergence Divergence (MACD) shows negative reinforcement, highlighting the inherent contradiction in the directional trend. The moving averages (MAs) are generally biased bullish, with most short- to long-term indices and simple moving averages showing positive signals. Notably, only the 30-day simple moving average is contrary to this, with a negative reading.
In conclusion, while the intraday chart shows a constructive tone and provides opportunities for short-term positioning, the broader trend remains directionless with potential bearish risks. Unless Bitcoin reclaims the area above $110,000 with sustained volume, caution is advised. Traders would be wise to maintain tight risk control and focus on intraday momentum trading as the current daily pattern evolves.
Upside view:
If Bitcoin maintains momentum above $106,000 and breaks out of $106,521 convincingly, short-term traders can take advantage of a bullish setup with a target of $108,000 to $109,000. The alignment of buy signals from most moving averages further supports the potential for continued upside provided that the breakout is confirmed by volume and $107,500 is re-reached on a daily close. However, a failure to break out of $107,500 or a fresh sell-off around $106,450 could trigger a pullback to the $103,000 to $100,426 support zone, especially if the volume decreases at this point and the MACD confirms the bearish momentum.