GBPUSD Will FOMC and BOE Drive the Next Move?GBPUSD Will FOMC and BOE Drive the Next Move?
GBPUSD completed a bearish harmonic pattern near the end of May, signaling downside potential.
Despite multiple attempts to decline, rising geopolitical tensions in the Middle East and the FED’s reluctance to cut rates have kept price movements in check.
The pair repeatedly tested the 1.3600 resistance zone, but finally moved down by nearly 160 pips yesterday.
With the FOMC Interest Rate decision today and BOE’s rate announcement tomorrow, the market could see a rebound ahead of FOMC for a larger correction, potentially setting up for a decline tomorrow.
While this remains an assumption for now, as long as the harmonic pattern remains valid, further downside remains a possibility.
You may find more details in the chart!
Thank you and Good Luck!
❤️PS: Please support with a like or comment if you find this analysis useful for your trading day❤️
Disclosure: I am part of Trade Nation's Influencer program and receive a monthly fee for using their TradingView charts in my analysis.
Wave Analysis

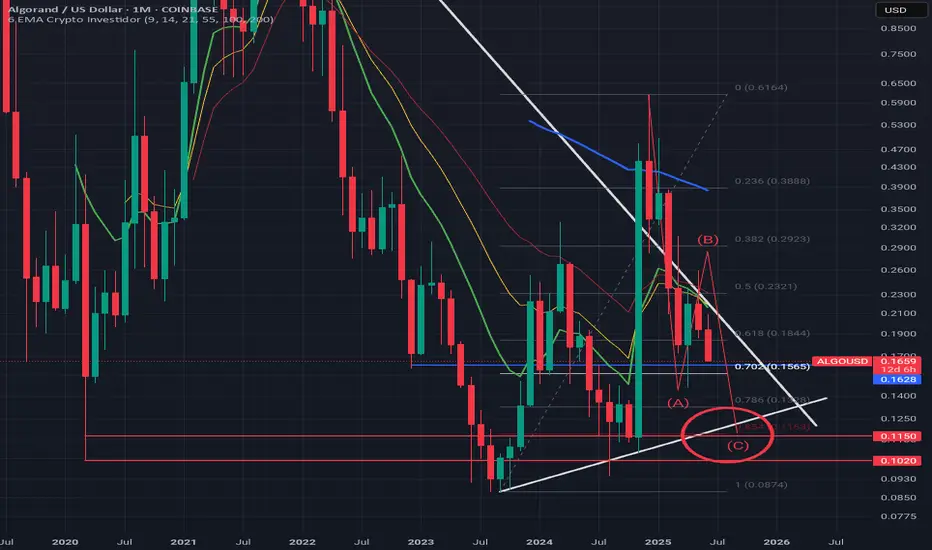
$0.10 inbound. BUY OpportinityIMO, were going to backtest the 2020 lows, and complete the ABC correction/C Leg down to the 0.854FIB and wick down into the $0.10s if you can catch a falling knife and go LONG!!!
USD/JPY – Bearish Symmetrical Triangle Break Incoming?USD/JPY is currently consolidating within a well-defined symmetrical triangle, respecting both the ascending and descending trendlines with clean touches. This structure typically precedes a volatile breakout, and the technical confluence here favors a bearish resolution.
🔍 Technical Breakdown:
Price failed to hold above the 0.5 Fib level of the recent swing high at 145.377, getting rejected by both the 200 EMA and the triangle resistance zone.
Currently testing the 0.382 retracement (144.607) — a break here opens the door for a drop to the 0.236 level (143.653) and potentially deeper into previous demand.
Volume compression and EMA clustering further support an imminent breakout move.
📐 Bearish Confluences:
Rising wedge/symmetrical triangle pattern showing exhaustion.
Strong rejection at the equilibrium of the range.
EMAs acting as dynamic resistance.
Major fib cluster from previous bearish leg aligning with triangle apex.
🎯 Targets:
TP1: 143.653 (0.236 Fib)
TP2: 142.111 (local low)
TP3: 140.347 (-0.27 Fib extension, full measured move of triangle)
❌ Invalidation:
Clean break above 145.526 (mid-structure + fib zone) would neutralize the setup.
💬 Market Context: Watch closely for a breakout confirmation. Smart money may sweep short-term liquidity before a decisive drop. Stay nimble, and remember — structure always tells the story.

Time to speculate with DOGEI'm not going to surprise anyone by saying that CAPITALCOM:DOGEUSD is a highly speculative asset with little to no fundamental backing. However, from a technical standpoint, it’s offering a very interesting opportunity.
A few years ago, DOGE formed a double bottom pattern that, after a long struggle, finally reached its target, delivering spectacular returns. Right now, the price is trading around the breakout level of that same pattern and is also sitting right on the red trendline support.
This setup presents a chance to buy in a zone with strong rebound potential, a tight stop loss, and a risk‑to‑reward ratio that could easily be 10 to 1.
Taking on that risk seems worthwhile given DOGE’s massive upside potential, especially with memecoin season likely around the corner, as Bitcoin’s post‑halving rally looks set to wind down later this summer.

XAU/USD – Wave 3 in Motion?We’re currently monitoring what appears to be a textbook Elliott Wave 1-2 structure, with Wave (2) bottoming near $3,293. Price has since pushed up and consolidated above the 0.5–0.382 retracement zone, holding firm at key EMAs and structure.
🔍 Key Technical Highlights:
Wave (1): Clean impulsive structure.
Wave (2): Corrective decline finding strong support at $3,293.
Current consolidation suggests accumulation before potential Wave (3) breakout.
Confluence of Fib extensions & upper trendline project Wave (3) towards $3,484, aligning with the -0.27 extension.
🧠 What I’m Watching:
Break and retest of the $3,400–$3,415 level (0.236 Fib) to confirm bullish continuation.
Holding above $3,372–$3,390 (the golden pocket and 0.5/0.382 zone) is key to maintaining the bullish bias.
A clean break below $3,353 invalidates this immediate structure.
📈 Bias: Bullish
🎯 Next target: $3,484
⛔️ Invalidation: Break below $3,350
💬 Let me know your thoughts. Are we about to ride Wave 3, or will gold give us one more dip before lift off?

GBPUSD - One More Leg for Bears to Take Over!Hello TradingView Family / Fellow Traders. This is Richard, also known as theSignalyst.
📈GBPUSD has been overall bullish trading within the rising broadening wedge pattern marked in red.
However, it is currently approaching the upper bound of the wedge acting as an over-bought zone.
And the $1.365 - $1.375 is a strong resistance zone.
🏹 Thus, the highlighted red circle is a strong area to look for sell setups as it is the intersection of resistance and upper red trendline acting as a non-horizontal resistance.
📚 As per my trading style:
As #GBPUSD approaches the red circle zone, I will be looking for bearish reversal setups (like a double top pattern, trendline break , and so on...)
📚 Always follow your trading plan regarding entry, risk management, and trade management.
Good luck!
All Strategies Are Good; If Managed Properly!
~Rich
Disclosure: I am part of Trade Nation's Influencer program and receive a monthly fee for using their TradingView charts in my analysis.

QQQ Put level 513 The main reason it has been two regetetion on two levels it on a down trend for short term.
And with the wars that is Happening and the market are closed on thursday we dont know what is going to happend friday.

Great Depression 2.0 Starting in 2030?Looking at the Dow Jones, we can see clear cycles forming on this index. I believe we could see one more major run on the Dow between now and 2030, followed by a repeat of the Great Depression. I could easily be wrong, but the charts suggest this is a very real possibility.
So, between now and our potential top in 2030, we have an opportunity to make a significant amount of money in markets like crypto.
As always, stay profitable.
– Dalin Anderson

EURCAD BUY SETUPWe have transitioned from a downtrend to and up trend as shown by the transition for lower low and lower high to a higher high and potential higher low. we have pulled back to a key level for an entry.

AGL LONG TRADE 18-06-2025 Second Strike"AGL Buy Call for Second Strike
AGL previously traded in a bearish channel (pink) and reached a low of 39.3, marking a selling climax. After reversing, the stock broke out of the channel and formed a bullish pipe pattern. A subsequent corrective bearish channel (blue) has given way to a bullish setup, with the recent formation of a bullish structure offering a safe entry point.
🚨 TECHNICAL BUY CALL – AGL🚨
Buying Levels:
1. 57.38 (Current Price)
2. 55.1
3. 54
Targets:
TP1: 59.9
TP2: 66.1
TP3: 71.2
Stop Loss: Below 51 Day closing basis
Risk-Reward Ratio: 3
Caution: Please buy in 3 parts within the buying range. Close at least 50% of your position at TP1 and trail the stop loss to protect profits in case of unforeseen market conditions.
If you find this idea helpful, please boost and share it!
📢 Disclaimer: Do not copy or redistribute signals without prior consent or proper credit to The Chart Alchemist (TCA).

AUDCAD SHORTThe sell is coming once the mkt reach the resistance consolidation band aera, and at that aera there is also monthly S/R/PP AERA THERE!!! And the BOLLINGER BAND will act as a "DYNAMIC RESISTANCE AERA TOO", so watch out for a "Price Action and Bearish Candlestick Revers Pattern" on the 1h/4h TF to go short/sell

B/$The latest breakout of the top will give a good pullback, which is currently developing.
I think we will see a price below $100,000 again.


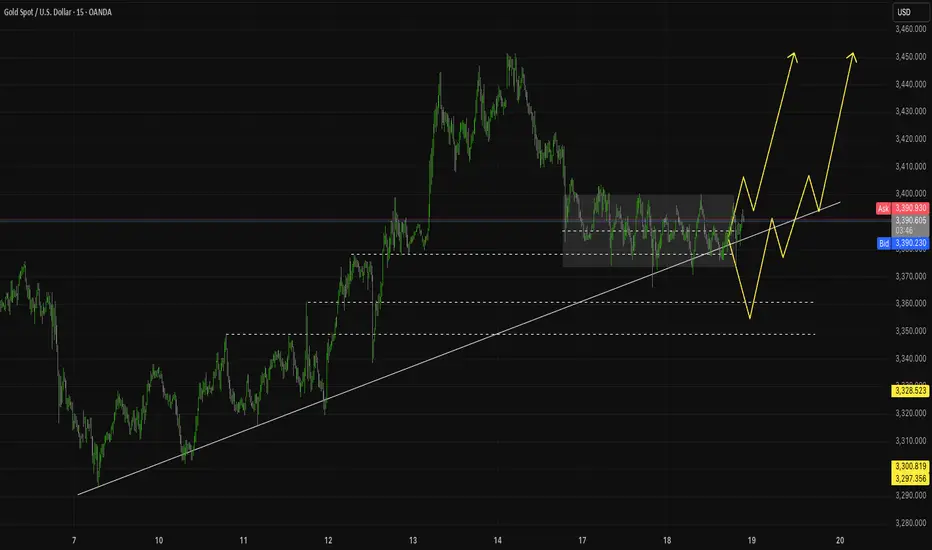
Bullish on Gold and expecting an upside move.Based on the 15-minute chart (screenshot attached), I see two possible bullish paths forming:
Path 1 (Fast Way):
Price breaks out directly from this consolidation zone and pushes higher quickly.
Path 2 (Slow Way):
Price dips into the lower support areas or Manipulation before reversing and heading up.
Both scenarios point toward upside targets around 3,450.
Hanzo / Nas100 30 Min ( Accurate Tactical Break Out Zones )🔥 Nas100 – 30 Min Scalping Analysis (Bearish Setup)
⚡️ Objective: Precision Breakout Execution
Time Frame: 30-Minute Warfare
Entry Mode: Only after verified breakout — no emotion, no gamble.
👌Bullish After Break : 21840
Price must break liquidity with high volume to confirm the move.
👌Bullish After Break : 21930
Price must break liquidity with high volume to confirm the move.
👌Bearish After Break : 21755
Price must break liquidity with high volume to confirm the move.
☄️ Hanzo Protocol: Dual-Direction Entry Intel
➕ Zone Activated: Strategic liquidity layer detected — mapped through refined supply/demand mechanics. Volatility now rising. This isn’t noise — this is bait for the untrained. We're not them.
🩸 Momentum Signature Detected:
Displacement candle confirms directional intent — AI pattern scan active.
— If upward: Bullish momentum burst.
— If downward: Aggressive bearish rejection.

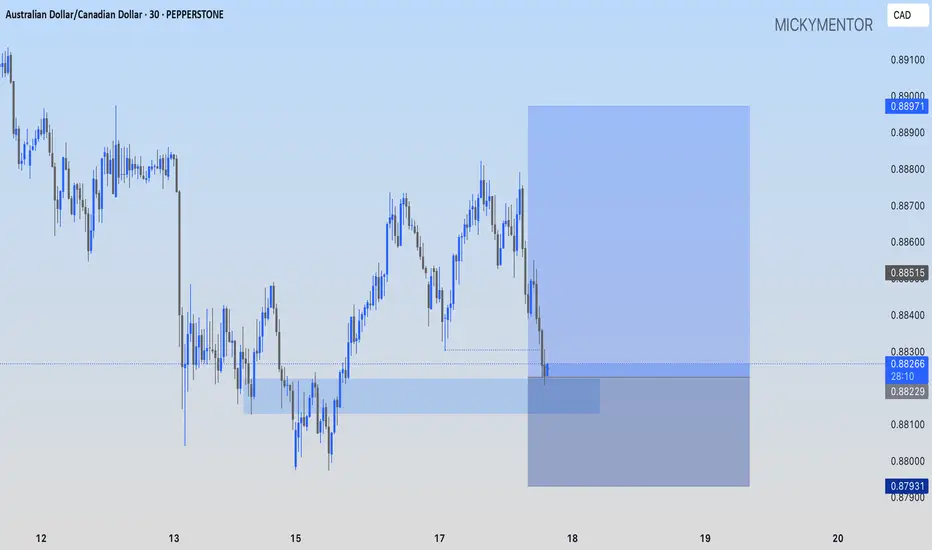
AUDCAD: A GOOD BUY OPPORTUNITY PEPPERSTONE:AUDCAD I'm going long at current market price, targeting 0.88971
Today, the Federal Reserve is the key to breaking the deadlock!
📌 Core driving events
Yesterday, as the market believed that the possibility of direct U.S. involvement in the conflict had increased, tensions intensified again, and the market was once worried about possible attacks during the Asian session. Although it did not happen in the end, it is said that the next 24 to 48 hours will be a critical period. This wave of tension triggered widespread "risk aversion" operations in the market, but interestingly, gold did not react strongly. The market remained cautious before the Fed's interest rate decision was released, and the slight increase in risk appetite in the stock market also put pressure on gold prices.
📊Comment analysis
At present, the technical side of gold has been showing a bearish trend, but as of now, the market has not fallen below yesterday's closing low of 3364, and the upper side has been under pressure from the resistance of 3405. Long and short positions are wandering in this range, and the breakthrough market will either break through at the end of the day, and the current trend uses sideways trading to exchange time and space, and has not fallen below the support below, so there is a high probability that it will go up.
In the current tense market, it is more necessary to open a position near the high and low points to make a better game. At the same time, from historical experience, the impact of the Middle East geopolitical crisis on gold has three stages and has entered the second stage. The uncertainty of the global economy, the intensification of trade frictions and the rise in inflation expectations may provide structural support for gold. Therefore, if it does not break near 3364 today, it will be bullish first!
💰Strategy Package
Gold: More near 3368-70, defend the 3364 line, and look up to the 3397-3405 line. If it breaks 3405 upward, it will further impact 3422 and even the previous high, but if it breaks below 3364, the long single position will be adjusted out and it will no longer be bullish for the time being!
⭐️ Note: Labaron hopes that traders can properly manage their funds
- Choose the number of lots that matches your funds

Trading Game of the Day 18-JUNE-2025The Trading Plan:-
1-the main trend on D-TF is bullish
2-PDA:-D-fvg and the target is the swing high
3-Rejection Block on D-TF
4-Rejection candles on the H4 from the D-FVG
5-The price is already moving sideway for 2 days so there is accumulation
6-the trading is on lower timeframe with MS between the high and low of the trading range
Thank you

Amazon: Continuing to RiseWith Amazon’s recent climb, prices are edging closer to the top of wave (1) in magenta. However, there is still a bit of upside potential in the short term before wave (2) makes its corrective move. Our primary scenario does not anticipate a new low below $160.50. Instead, we expect wave (3) in magenta to eventually surpass resistance at $242.52. Under our alternative scenario, there is a 30% chance we could see new lows below $160.50. In this case, wave alt.B in beige would have peaked at $242.52, prompting us to focus on a magenta downward impulse.
📈 Over 190 precise analyses, clear entry points, and defined Target Zones - that's what we do.

ANTM LONG TRADEANTM LONG TRADE
After marking an all-time high of 70, ATM plummeted to 7.56 in March 2015. Since then, the stock traded within a range (7.4 - 16.2) for over a decade, marked by a pink channel. Recently, the stock broke out of this long-term range with a change in character to the bullish side, accompanied by sufficient volume distribution. Following the breakout, the stock formed a corrective bearish channel (light blue), which can be seen as a bull flag. Today, we witnessed a breakout from this bullish flag.
🚨 TECHNICAL BUY CALL – ANTM🚨
Buy Levels:
1. 19.4 (Current Price)
2. 18.2
3. 17
TP1: 25.2
TP2: 29.2
TP3: 33
Stop Loss: Below 12.8
Risk-Reward Ratio: 5.5
Caution: Please buy in 3 parts in buying range. Close at least 50% position size at TP1 and then trail SL to avoid losing incurred profits in case of unforeseen market conditions.
PLEASE BOOST AND SHARE THE IDEA IF YOU FIND IT HELPFUL.

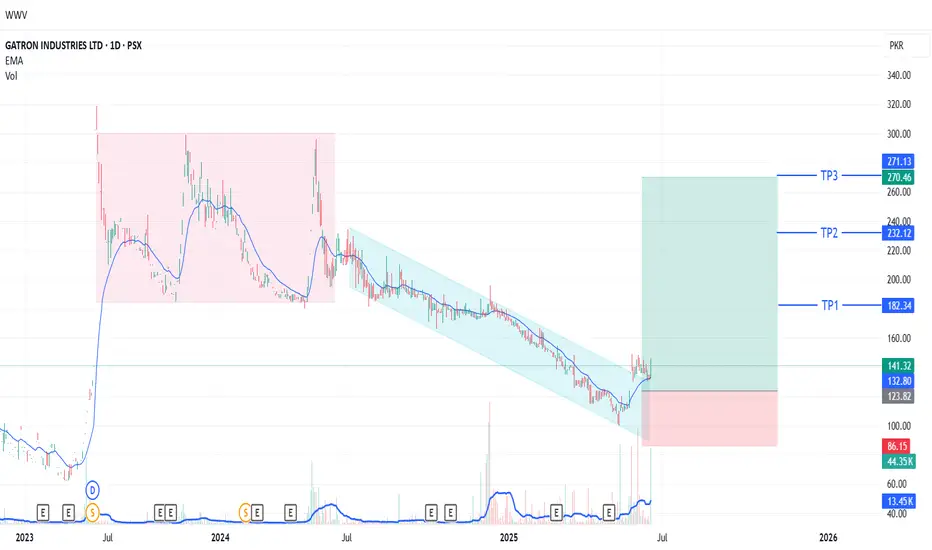
GATI LONG TRADE/INVESTMENT CALL 18-06-2025GATI Buy/Long Term Investment Call
Gati Limited (GATI) recently broke out from a bearish channel that touched a low of 100 rupees. The breakout is supported by 5x more volume than average, indicating potential for upward movement. The stock previously formed various bullish structures during its consolidation phase, which may prevent significant downfall.
🚨 TECHNICAL BUY CALL – GATI🚨
- *Buy 1: 141.32 (current price)
- *Buy 2: 136
- *Buy 3: 120
- *Buy 4: 108
- *TP1:* 182
- *TP2:* 232
- *TP3:* 270
*Stop Loss:* Below 85 - Day Closing Basis
*Risk-Reward Ratio:* 3.9
Caution: Please buy in 3 parts in buying range. Close at least 50% position size at TP1 and then trail SL to avoid losing incurred profits in case of unforeseen market conditions.
PLEASE BOOST AND SHARE THE IDEA IF YOU FIND IT HELPFUL.
₿itcoin: SetbackBitcoin has come under selling pressure in recent hours. We cannot rule out that a deeper dip may precede the next leg higher into the upper blue Target Zone between $117,553 and $130,891. Once green wave B concludes in this range, we anticipate a wave C decline into the lower blue Target Zone between $62,395 and $51,323 to complete the larger orange wave a. From there, a corrective rally in orange wave b is expected, which should set the stage for a final leg lower to finalize blue wave (ii). Meanwhile, we’re still monitoring the alternative scenario (30% probability), in which blue wave alt.(i) is still in progress. In this case, BTC would stage an immediate breakout above resistance at $130,891.
📈 Over 190 precise analyses, clear entry points, and defined Target Zones - that's what we do.

Xauusd Next MoveHey All Im seeing Xauusd. Will fly on 3425 and its Break Resistance Level so put. On Buy and Fly with me lets gooo
