EUR/USD Long-Term Trade Idea (Bullish to Bearish Transition)The EUR/USD pair is expected to enter a bullish phase in the near term, potentially rising toward the key resistance zones between 1.18616 and 1.20143. These levels are likely to act as strong reversal points, where the pair could encounter significant selling pressure.
Once price reaches this zone, a bearish reversal is anticipated, aligning with broader technical signals and long-term resistance structures.
This setup presents an opportunity to ride the bullish momentum toward these levels, then potentially shift to a sell bias upon confirmation of rejection or reversal patterns within that zone.
“Buy the strength, sell the exhaustion — let the market come to you.”
Wave Analysis

dxy 1hr chart analaysis The current bullish trend in the DXY is likely to face a strong rejection around the 99.55–99.65 zone. Unless there is major news that significantly shifts the market direction — such as a surprise policy announcement like the tariffs introduced during Trump's era — the dollar index is not expected to break above that level. That zone could act as a major turning point, and a bearish reversal is likely to emerge from there

AGSML LONG TRADE 18-06-2025 (Sugar & Allied Sector)"AGSML Buy Call (1H TF):
After breaking out of a downtrend (yellow channel) in the third week of May, AGSML has entered a bullish uptrend with strong volume gradient. The stock has completed Wave 1 at 6.7, Wave 3, and corrective Wave 4, and is now poised for its final up leg. A bullish breaker block and multiple bullish FVGs have formed, indicating a safe entry point.
🚨 TECHNICAL BUY CALL – AGSML🚨
Buy Levels:
1. 6.8
2. 6.3
3. 6.1
Targets:
TP1: 7.6
TP2: 7.96
TP3: 8.3
Stop Loss: Below 5.70 day closing
Risk-Reward Ratio: 3.6
Caution: Please buy in 3 parts in buying range. Close at least 50% position size at TP1 and then trail SL to avoid losing incurred profits in case of unforeseen market conditions.
PLEASE BOOST AND SHARE THE IDEA IF YOU FIND IT HELPFUL.

SMCPL LONG TRADE - SECOND STRIKE (18-06-2025)SMCPL Buy Call (1H TF) - Second Strike
After a successful previous buy call, SMCPL has recently been in a downtrend channel (pink) from December to April. A selling climax marked the end of the downtrend, followed by a reversal and the formation of an inverted head and shoulders pattern, a bullish reversal pattern. With sufficient volume distribution and the presence of multiple FVGs and bullish IFDZ, this setup presents a high-probability trade.
🚨 TECHNICAL BUY CALL – SMCPL🚨
Buy Levels:
1. 18.5 (Current Price)
2. 18.2
3. 17.6
Targets:
TP1: 20.8
TP2: 22.08
TP3: 24.4
Stop Loss: Below 17 day closing
Risk-Reward Ratio: 3.6
Caution: Please buy in 3 parts in buying range. Close at least 50% position size at TP1 and then trail SL to avoid losing incurred profits in case of unforeseen market conditions.
PLEASE BOOST AND SHARE THE IDEA IF YOU FIND IT HELPFUL.

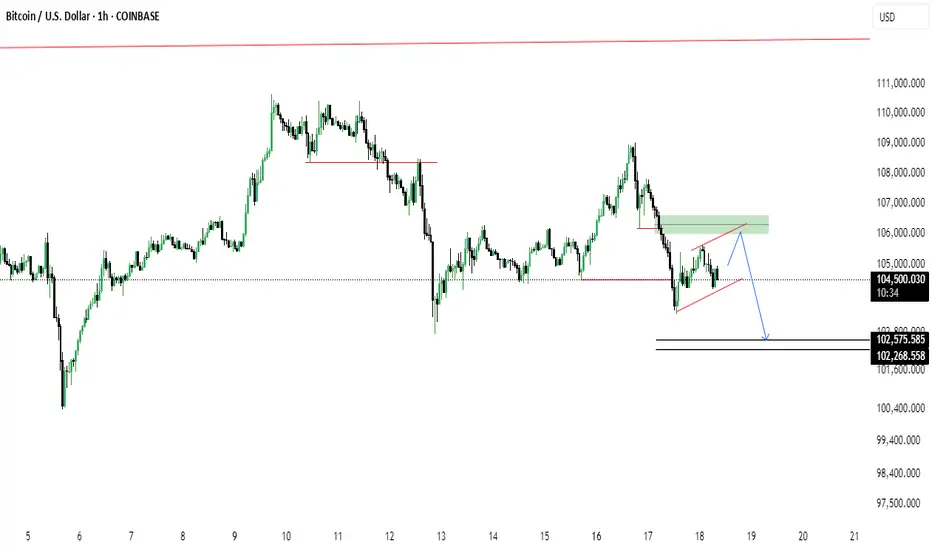
BTC/USD Rising Wedge Breakdown Ahead?Bitcoin shows signs of a potential bearish reversal as price forms a rising wedge beneath a key supply zone. After a recent drop, price is retesting the 106k area (green zone), possibly setting up for continuation to the downside.
🔹 Rising wedge pattern near resistance
🔹 Bearish retest at previous support turned resistance
🔹 Potential drop targets: 102,575 and 102,268
🔹 Break below wedge support could accelerate the fall
BTCUSD like to reach level 107375BTC USD is in a reversal zone and likely to reach level 107375.00
This is for educational purpose only. Not an investment or financial advise.

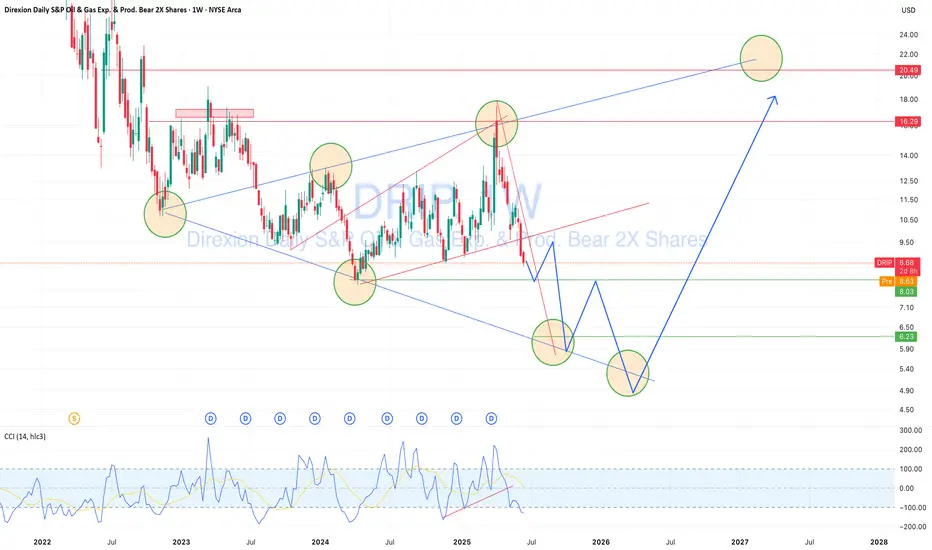
DRIP — Geopolitical Oil Risk Creates a Buying OpportunityDRIP (inverse 2x ETF on US oil & gas exploration/production) is approaching a key technical support zone.
While oil may continue rising short term due to geopolitical tensions — especially US-Iran risks and Middle East instability — this short-term pressure could push DRIP lower toward the $5.00–6.00 area. That zone aligns with strong historical reversal points and trend support. From there, a rebound toward $12.00–20.00 is technically and fundamentally possible, offering 30–50%+ profit potential. I’m planning staged entries in the marked range, managing risk with awareness of commodity market volatility and global uncertainty.
SLGL LONG TRADE 16-06-2025SLGL LONG TRADE
- *Initial Trend*: Upon induction in PSX, SLGL formed an apex, reaching a high of 20.47, followed by a corrective oblique pullback channel - which is actually a Price Action Bull Flag.
- *Higher High Attempt*: The stock attempted to post a higher high but was unsuccessful, indicating potential resistance.
- *Strong Day Closing Candle*: After completing its full wave cycle, SLGL formed a robust Marabuzo candle, indicating potential bullish momentum.
🚨 TECHNICAL BUY CALL – SLGL🚨
- *Buy Levels*:
- Buy 1: 16.13
- Buy 2: 15.44
- Buy 3: 14.7
- TP1: 16.8
- TP2: 17.45
- TP3: 17.95
- *Stop Loss*: 14.25 (closing basis)
- *Risk-to-Reward Ratio*: 1:2.21
Caution: Close at least 50% position size at TP1 and then trail SL to avoid losing incurred profits in case of unforeseen market conditions.
PLEASE BOOST AND SHARE THE IDEA IF YOU FIND IT HELPFUL.

NVIDIA (NVDA) – Ending Diagonal at the Top? 126 Next?NVDA is currently trading inside a potential ending diagonal, often signaling a reversal or strong correction. With multiple Breaks of Structure (BoS) and a visible Fair Value Gap (FVG) left behind, this setup is aligning with Smart Money Concepts.
📉 Bearish Rejection Expected?
Price might sweep liquidity and revisit the 126–129 demand zone, where strong unmitigated orders sit. If this zone holds, a bullish continuation toward 152+ is likely.
🔍 Key Highlights:
⚠️ Ending Diagonal pattern near local top
📊 Multiple BoS confirming internal structure shifts
📉 Unfilled Fair Value Gap (FVG) near 129
🟩 Strong demand zones at 129–126 and 108
🔄 Potential liquidity sweep before reversal
🧠 Smart money footprint visible
📅 Watch for price reaction around 129.8–126.1.
📈 Breakout above 145 with strength may invalidate the drop.

SCI-Wave 5 loading ?!!Analysis:
Shipping Corp of India appears to have completed a classic Elliott Wave 1–2–3–4 structure, with Wave 5 potentially underway.
✅ Wave 3 shows strong momentum, and
✅ Wave 4 found support near the 0.618–0.786 retracement zone – a healthy corrective pullback.
✅ RSI is rising from the 40 zone and now sits near 60, indicating growing strength without being overbought.
✅ Price structure remains intact – Wave 4 didn’t overlap with Wave 1, preserving the impulse validity.
🎯 Potential Target for Wave 5:
1.0 ext: ₹238
Extended move could stretch to ₹280–₹300+ if volume and momentum sustain.
Support Zones:
₹174 (previous breakout zone)
₹151–133 (Fibo clusters)
Watchlist Note: A breakout above ₹240 with volume could confirm the start of Wave 5. Keep an eye on price action and RSI divergence during this rally.

Rising Geopolitical Tension (Iran Conflict) Signals Market RiskMoving Partially to Cash (VEA, QQQ, TQQQ, SPY, TECL, SOXL)
The global market is entering a high-risk environment. Geopolitical escalation, particularly the growing threat of direct US involvement in a military conflict with Iran, is pushing global uncertainty to new highs. Tensions in the Middle East, rising oil and gold volatility, and increased friction between major world powers all point toward a potential market breakdown. On the chart, VEA ETF is showing signs of topping out within a rising wedge pattern. Meanwhile, institutional funds are starting to reduce exposure to high-risk assets. I'm taking partial profits and shifting to cash across VEA, QQQ, TQQQ, SPY, SOXL, and TECL to preserve gains. Buy-back zones are set around 53.00, 48.00, and 44.00. In an environment of global escalation and rapid risk-off sentiment, active portfolio defense is more important than passive hope.

US30 Is Bearish! Sell!
Here is our detailed technical review for US30.
Time Frame: 12h
Current Trend: Bearish
Sentiment: Overbought (based on 7-period RSI)
Forecast: Bearish
The market is approaching a significant resistance area 42,254.4.
Due to the fact that we see a positive bearish reaction from the underlined area, I strongly believe that sellers will manage to push the price all the way down to 41,307.3 level.
P.S
Overbought describes a period of time where there has been a significant and consistent upward move in price over a period of time without much pullback.
Disclosure: I am part of Trade Nation's Influencer program and receive a monthly fee for using their TradingView charts in my analysis.
Like and subscribe and comment my ideas if you enjoy them!

ETHUSD Is Very Bullish! Buy!
Take a look at our analysis for ETHUSD.
Time Frame: 10h
Current Trend: Bullish
Sentiment: Oversold (based on 7-period RSI)
Forecast: Bullish
The market is on a crucial zone of demand 2,508.60.
The oversold market condition in a combination with key structure gives us a relatively strong bullish signal with goal 2,717.66 level.
P.S
Please, note that an oversold/overbought condition can last for a long time, and therefore being oversold/overbought doesn't mean a price rally will come soon, or at all.
Disclosure: I am part of Trade Nation's Influencer program and receive a monthly fee for using their TradingView charts in my analysis.
Like and subscribe and comment my ideas if you enjoy them!

EURJPY Is Going Up! Long!
Please, check our technical outlook for EURJPY.
Time Frame: 4h
Current Trend: Bullish
Sentiment: Oversold (based on 7-period RSI)
Forecast: Bullish
The price is testing a key support 166.677.
Current market trend & oversold RSI makes me think that buyers will push the price. I will anticipate a bullish movement at least to 167.654 level.
P.S
The term oversold refers to a condition where an asset has traded lower in price and has the potential for a price bounce.
Overbought refers to market scenarios where the instrument is traded considerably higher than its fair value. Overvaluation is caused by market sentiments when there is positive news.
Disclosure: I am part of Trade Nation's Influencer program and receive a monthly fee for using their TradingView charts in my analysis.
Like and subscribe and comment my ideas if you enjoy them!

GBPJPY Will Fall! Short!
Here is our detailed technical review for GBPJPY.
Time Frame: 9h
Current Trend: Bearish
Sentiment: Overbought (based on 7-period RSI)
Forecast: Bearish
The market is trading around a solid horizontal structure 194.806.
The above observations make me that the market will inevitably achieve 193.727 level.
P.S
We determine oversold/overbought condition with RSI indicator.
When it drops below 30 - the market is considered to be oversold.
When it bounces above 70 - the market is considered to be overbought.
Disclosure: I am part of Trade Nation's Influencer program and receive a monthly fee for using their TradingView charts in my analysis.
Like and subscribe and comment my ideas if you enjoy them!

Bitcoin sell short go 83kBitcoin is ready for a heavy drop, just sell.
Do not take any buy or sell trades.

First share/ potential-possible-realisticIf cryptocurrencies like Bitcoin and tokenized assets gain reserve status post-tariff war (likely by 2026-2027), platforms like Ondo could experience significant growth.
1. -> jump on to the hyper bull run
Positive scenario (crypto reserves adopted): ONDO price could rise $3-$5 within the next few years, driven by institutional adoption and higher liquidity demand.
->possible steady walk towards the moon
Risk scenario (slow adoption): If crypto reserves are delayed, ONDO may stay in the $1.5-$2.5 range due to limited institutional involvement.
-> realistic bottom present scenario
Conclusion.
Short short short
Or
Long long long
Mexico is postponed
Canada/China and more to be resolved
War is on, a significant war.
Until it's over and clear,
Trimming is needed all across the globe.
1.38 target
0.92 target
0.72 misfortune
--->>
3.5 yes.

DXY 2H Analysis – June 18, 2025Pair : dxy ,,💲
Is the bullish move fading out? 📉
Price reacting near upper trendline resistance 🔵
Potential correction or final push before deeper drop ❗
Wave count suggests i–ii–iii–iv completed; wave v setup expected 🔁
Watch the reaction in the highlighted zone 📦
Either short continuation or a bullish trap loading 🧠
📌 Strategy: Elliott Wave + Trendline Confluence
📅 Stay sharp. Events approaching 📰
📈 Trade with a plan, not hope.
🔔 Follow @Greenfireforex for more real-time setups and ideas.

Render get in earlyI think we finished the abc correction for the wave 4, now just made a 1 and 2? Now gearing up for higher highs.

Sui cup and handleThanks to @leu76 i think we are going to make a cup and handle.
We just need to stay above the 0.5 fib.
Target to the 2 fib

USDCAD - Scalping in the deepHello dear scalpers, this is our next little scalping setup...
With a ratio of 1.14 ^^
I think this will be a nice position in this downtrend situation.

SUI long 34% short 88%I think we need to see these moves first before we will have the extreme big wave to the upside. Just opened a long position. Then looking to short

USOIL - Near CUT n REVERSE Area? holds or not??#USOIL.. straight bounce after #IranvsIsrael war situation, and now market just reached near to his current Resistance Area / region
keep close that region and if market holds then drop expected otherwise not at all.
NOTE: we will go for cut n reverse above region on confirmation.
good luck
trade wisely
