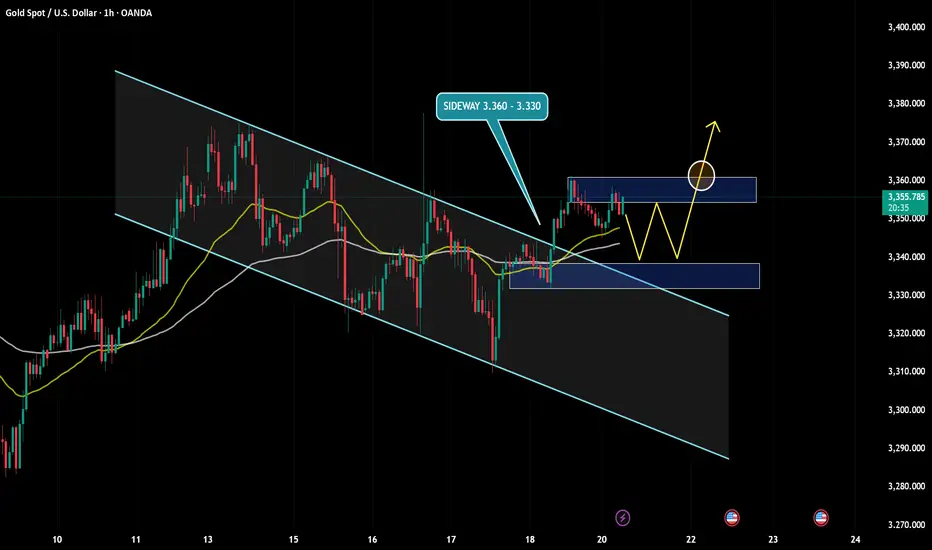
XAUUSD Continues Bullish Structure With Key Retracement OpportunTechnical Outlook – 22/07/2025
On the 1-hour chart, XAUUSD is maintaining a clear bullish market structure with a sequence of higher highs and higher lows. The projected price path drawn on the chart suggests a potential retracement before a continuation toward the 3,420 USD region. Let’s break down the key technical zones and strategies for today:
Key Levels to Watch
Immediate Resistance: 3,390 – 3,400 USD
This is the recent high. A breakout above this area could trigger momentum toward the projected 3,420 USD extension.
Support Zone: 3,345 – 3,350 USD
This zone aligns with the potential pullback as illustrated on the chart, offering a high-probability buy-the-dip opportunity. It coincides with previous structure resistance now turned support.
Trendline Support: The ascending yellow trendline has been respected multiple times and should act as dynamic support on any intraday retracements.
Indicators & Tools Used
EMA: Price is currently trading above the short-term EMA (not shown), suggesting intraday bullish bias remains intact.
RSI (Recommended Use): Look for RSI near 40–50 on the pullback for confluence at support.
Fibonacci Tool (suggested): If measuring from the swing low near 3,320 to the high of 3,390, the 0.618 Fib lies close to 3,345 – an ideal area to look for long entries.
Suggested Trading Strategies
🔹 Buy the Dip Strategy:
Wait for a corrective move into the 3,345–3,350 area. Confirm with bullish reversal candles or RSI support, then enter long targeting 3,400–3,420. Stop-loss ideally below 3,335 (structure break).
🔹 Breakout Continuation Strategy:
If price breaks cleanly above 3,390 with volume, a momentum trade toward 3,410–3,420 is viable. Use tight trailing stops to protect gains.
🔹 Avoid chasing highs – Patience at support zones or confirmation above resistance will offer better reward/risk setups.
Conclusion
Gold is respecting bullish market behavior on the 1H chart, and while a short-term correction is expected, the broader trend favors upside continuation. The 3,345–3,350 area will be critical for today's trading decisions.
Remember to follow for more updates and strategy insights. Save this post if you find it useful.
If you’d like, I can also add a version using RSI or Fib levels directly plotted. Let me know.
Wave Analysis

EURUSD Breaks Bullish Structure – Here’s My Trade Plan📍 Watching EURUSD closely—it's recently broken bullish (market structure) on the daily timeframe 📈.
I’m now waiting for a retrace into a fair value gap, watching for the rebalance and a possible support zone touch before the next leg up 🔄🟢.
🎥 In this idea, I walk you through:
🔍 Price action
🧱 Market structure
📊 Trend direction
📋 And my personal trade plan for this setup
Not financial advice ❌💼

Nifty 20500 or 19200?Last time, I was correct when I foresaw and gave an update on the Nifty's latest peak of 25650 the day before it happened, along with the beginning of a potential downward trend. Now, if the Nifty can break below 24500, there's a good chance we'll drop below the previous low of 21700 and reach at least 20500 or even lower, at 19200, by February 2026.

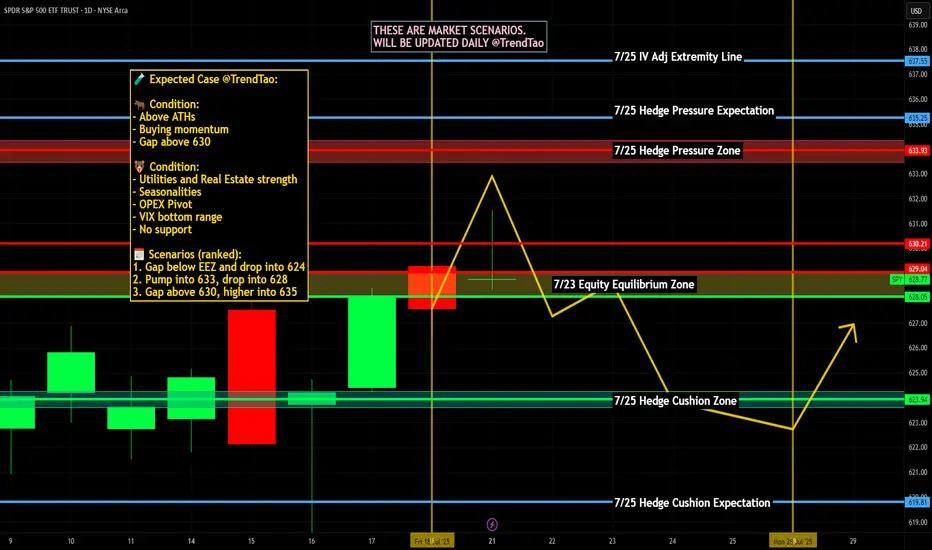
Nightly $SPY / $SPX Scenarios for July 22, 2025🔮 Nightly AMEX:SPY / SP:SPX Scenarios for July 22, 2025 🔮
🌍 Market-Moving News 🌍
🚀 Tech & EV Stocks in Focus Ahead of Earnings
Futures were quiet ahead of Tuesday’s open, but key movers included Astera Labs (+19%), Alphabet (+2.7%), Netflix +2%, and Robinhood –4.9% after being passed over for the S&P 500. Investors are positioning ahead of major tech and EV earnings this week — including Tesla, Alphabet, Lockheed Martin, Coca‑Cola, and Honeywell
📣 Powell Speech Eyed for Rate Clues
Fed Chair Jerome Powell is set to speak at 8:30 AM ET today at the Integrated Review of the Capital Framework for Large Banks Conference in D.C. Markets will be watching for any indications on future interest rate direction
🌏 Japan’s Political Shift Has Little Market Impact
Japan’s ruling coalition lost its upper-house majority over the weekend, but markets remained stable as it was largely expected. The yen held steady, and Asian equities stayed calm amid the holiday—focus remains on upcoming corporate earnings
📊 Key Data Releases & Events 📊
📅 Tuesday, July 22:
8:30 AM ET – Powell Speech: Key address at the bank regulation conference. Tone and forward guidance may sway bond and equity markets.
After Market Close – Alphabet & Tesla Earnings: Heavyweights due today—market attention will track revenue guidance, especially on advertising, EV demand, and AI.
⚠️ Disclaimer:
For educational and informational purposes only. Not financial advice—consult a licensed advisor before making investment decisions.
📌 #trading #stockmarket #tech #Fed #earnings #AI #infrastructure #volatility
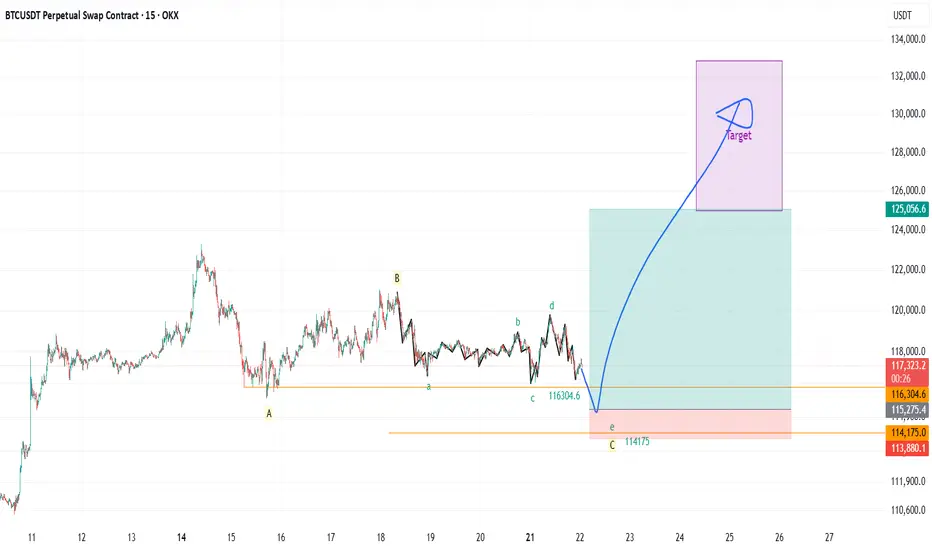
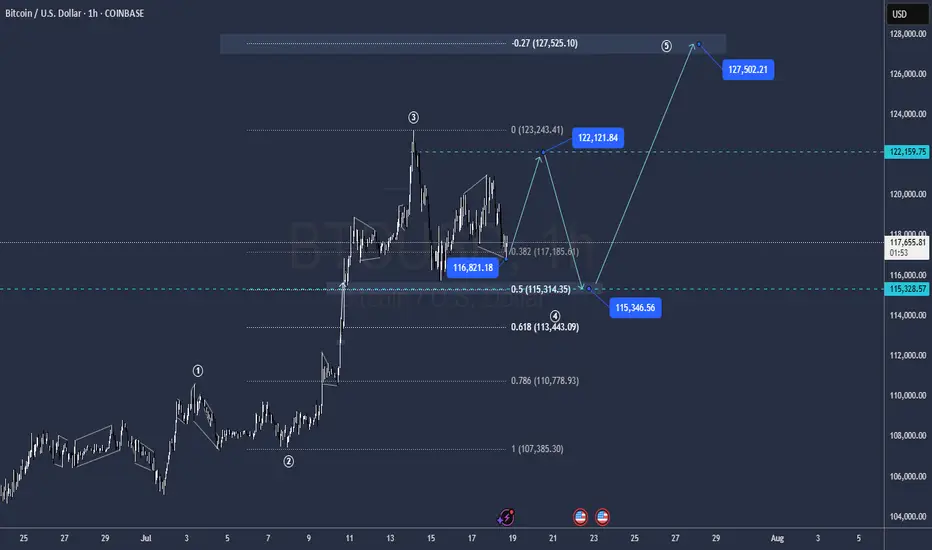
BTC Long and ShortFor chart pattern, TP1 Reahced , mostly will go TP 2.Target swing high (TP 2) and Counter for swing low,after reaching TP2. What do you think guys

Bitcoin Weekend ForecastIts in the middel of wave 4 correction, impulses are tradeable
Levels Highlighted in the chart
RAYUSDT – Spot Swing Buy RecommendationRAYUSDT – Spot Swing Buy Recommendation
Hello there,
If you're still wondering what to buy in 2025, keep in mind that previous recommendations like XRP, TRX, AAVE, LTC, HBAR, etc., have already passed their ideal buy zones. If you want to buy those, you’ll have to wait for a proper correction in the next 2-3 months.
For now, RAYUSDT is a great candidate. You can wait for a minor pullback to buy and hold for profit targets within 2025.
Trade Type: Spot Swing
Entry: $2.3 – $2.5, even $2.8 is acceptable. This is a long-term signal—a $0.5 difference is negligible.
Take Profit:
_Based on Weekly (W) peaks.
_Reference levels: $4, $5.8, and $9, with a strong preference to hold toward $9.
Timeframe: Be patient—this is a large timeframe play, expect 2-3 months to see real growth.
Market Insight:
_You did the right thing by not DCA during the downtrend.
_Buying in a falling market is like trying to stop an avalanche—not smart.
_Now that the snowball has hit the bottom and shattered, it’s time to climb.
RAYUSDT is in that stage—bottomed and ready for ascent.

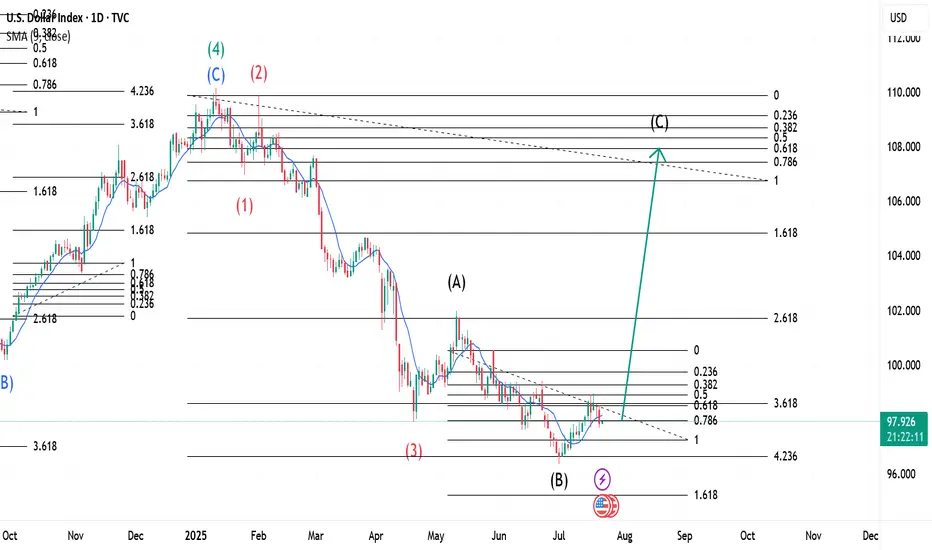
The $ Index ~ Elliott Wave Theory in real time.This is an update of a previously uploaded Dollar index Chart. Analysis remains the same and a confirmation at its current location would trigger continuation of the upward move as analysed on the first chart I had posted. Theoretically, the pullback on Monday, 21st July 2025 could be our Wave 2 with Wave 1 being on Thursday, 17th July 2025.

TESLA and the Elliott Wave Theory.This Chart shows a large Flat correction with Wave A and B(Black) completed. Wave B(Black) expressed itself in 3 waves namely A,B,C and are shown in Red. After B(Black) completed, a Wave C(Black) began so as to round off the Flat correction. A Wave 1(Green) formed, followed by a Zigzag correction and this meant a Flat for Wave 4(Green) was expected. After the Zigzag at Wave 2(Green), our Wave 3(Green) expressed itself in 5 Waves and are shown in Black. Wave 2(Black) was a Zigzag correction and Wave 4(Black) as expected, was a Flat. Wave 4(Black) completed recently meaning we are headed for a Wave 5(Black) which is also our Wave 3(Green). A confirmation at its current price location would trigger a sell.
Please note that Wave 5's(Black) location on the chart is purely for demonstration and price could move beyond or around this point.
@fantasyste

Gold holds steady near resistance – Is a breakout coming?Hello everyone, let’s explore today’s gold market together!
Overall, during the Asian session on Monday, gold traded cautiously, consolidating just below the nearest resistance level at $3,360, with minimal price movement. The uptrend remains strong, primarily driven by a sharp momentum shift last Friday following key news, as the weakening USD reignited investor interest in gold.
Current market sentiment suggests that major institutional funds and retail traders alike are showing renewed attention. As long as the previous support level around $3,330 holds firm, the next move could be a break above the $3,360 resistance, which would likely open the door for further upside expansion.
However, if price breaks below that support zone, I would consider the bullish setup invalid and shift to a wait-and-see approach until clearer signals emerge.
Feel free to share your thoughts in the comments — your perspective could contribute tremendous value to the global TradingView community!
AUDNZD Short-sell IdeaAfter price made a BOS (Break of Structure), it entered a correction phase. Possibly we are looking at a short around the supply zone.

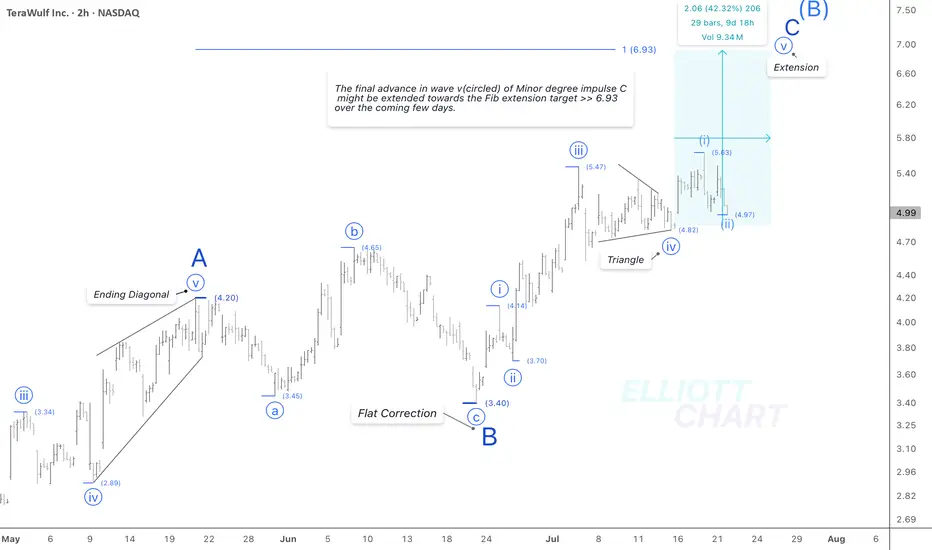
WULF / 2hThere is no change in the NASDAQ:WULF 's analysis; it might extend its final advance in an impulsive extension of wave v(circled) of the ongoing Minor degree wave C, in which the first and second subdivisions were done. An impulsive 3rd wave is anticipated.
Trend Analysis >> After completion of the Minor degree wave C, the countertrend advance of Intermediate degree wave (B), which has developed since April 9, will probably change to decline in the same degree wave (C) in the coming few days! And it'll likely last until the end of the year!!
$Crypto $Stocks CRYPTOCAP:BTC MARKETSCOM:BITCOIN BITSTAMP:BTCUSD
#CryptoStocks #WULF #BTCMining #Bitcoin #BTC
GBPCAD Bullish Set-upAfter an impulsive bullish move, price is currently in a corrective phase. It is approaching the Optimal Trade Entry (OTE) zone, which aligns with the 1-hour demand zone (bullish order block). This confluence of the Fibonacci 61.8%–85% retracement levels and the demand area suggests a potential bullish bounce and continuation toward the recent high.

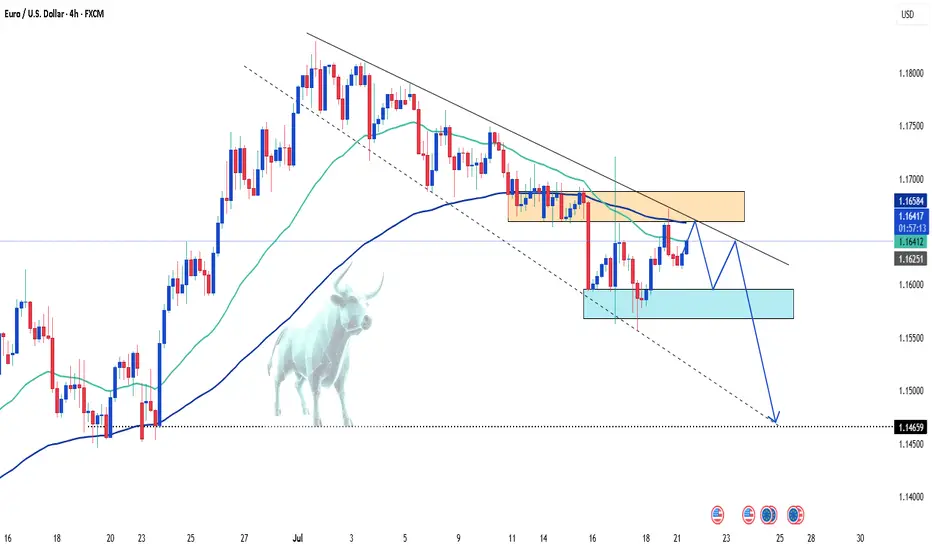
EUR/USD: Bearish Trend in FocusHello everyone, what are your thoughts on EUR/USD?
From my personal analysis, it's clear that EUR/USD is extending its downtrend. The pair is trading around 1.164 and is under pressure from sellers after breaking below both the EMA 34 and EMA 89, with EMA 34 already turning downward — a classic bearish signal.
On the macro side, the European Central Bank is set to announce its monetary policy decision on Thursday. Meanwhile, U.S. President Donald Trump's ongoing trade tensions may add further uncertainty to the market. This corrective downtrend in EUR/USD could very well continue in the weeks ahead.
What do you think — will EUR/USD keep falling?
USD/JPY Drops as Market Awaits Powell's RemarksIn today’s trading session, the USD/JPY pair is showing renewed weakness, currently trading around 147.76 — down more than 0.68% from the previous session. The decline is driven by falling U.S. Treasury yields and cautious investor sentiment ahead of an upcoming speech by Federal Reserve Chair Jerome Powell, which is weighing on the U.S. dollar.
From a technical perspective, USD/JPY has broken its short-term uptrend and is approaching a key support level at 147.60. If this level fails to hold, the bearish momentum could extend further.

Latest Gold Price Update TodayHello everyone, what do you think about the price of gold today?
As the new week begins, gold continues the upward trend started at the end of Friday’s session. As of now, the precious metal is trading around 3356 USD, with the uptrend still being supported.
From a carefully analyzed technical perspective, gold successfully broke out of the downward channel, taking advantage of the weakening USD. The price increase is convincing in the short term, especially after testing and confirming the previous breakout as a new support zone (around 3345 USD).
The upward target is expected to continue, with key levels to watch being 3372 USD and the H4 resistance at 3390 USD.
What do you think about the price of gold today? Feel free to share your thoughts in the comments!
Good luck!

BLDE – VolanX Smart Cycle Activation📈 BLDE – VolanX Smart Cycle Activation
Timeframe: Weekly
Posted by: WaverVanir International LLC | VolanX Protocol
Model: Accumulation → Manipulation → Expansion
After multiple Breaks of Structure (BOS) and prolonged markdown, BLDE has now confirmed a Smart Money Accumulation Cycle. A clear manipulation sweep below prior lows has triggered the upside phase. This chart follows the classic SMC model with:
🔹 Accumulation → Trap → Manipulation → Expansion
🔍 Key Observations:
Accumulation zone: $2.00–$4.00
Trap high: ~$5.00 (liquidity run & rejection)
Clean reclaim of $3.92 structure now acting as launchpad
Next zones of interest:
• $6.35
• $6.58
• $6.76
• Ultimate distribution zone: $9.90
📊 VolanX Thesis:
We are entering a Mark-Up Phase consistent with the VolanX Alpha Expansion Model. As liquidity rotates upward, expect a stair-step climb toward the equilibrium zone near $9.90.
🧠 Strategic Insight:
If price pulls back into the $3.92–$4.10 range, that would be considered a high-probability re-entry for bulls aligned with institutional footprints.
🛡️ Risk Lens:
Monitor for early distribution at $6.76. VolanX Guardian Protocol flags rising volume anomalies in that range.

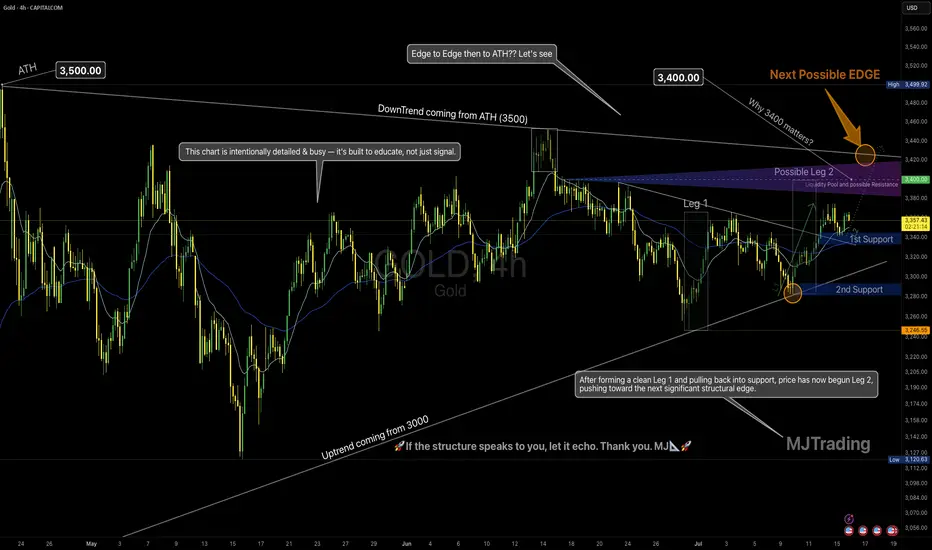
Leg 2 in Progress? | All Eyes on the Possible EDGE around 3400💡 GOLD 4H – MJTrading:
After forming a clean Leg 1 followed by a technical pullback into support, Gold has initiated Leg 2, pushing upward toward the next possible EDGE: 3400.
🟠 Why 3400 Matters
This zone is not just a round number:
It aligns with the long-term downtrend coming from the ATH (3500)
It’s the last reaction high before a deeper correction
There’s likely liquidity resting above — it’s where smart money may make decisions
This is where structure and psychology meet.
And end of 2 possible 2nd leg...
🔄 Possible Scenarios:
🟥 Scenario A – Rejection from the Edge (if could reach):
A reaction from this zone could lead to a pullback toward:
1st Support around 3340-3360
2nd Support near 3250 (also the uptrend line from 3000)
Use these zones to reassess momentum.
🟩 Scenario B – Breakout Above 3400:
A clean break above this structural edge opens the path for:
An “Edge to Edge” move back toward ATH (3500)
Possible higher timeframe trend shift — especially if retest holds
🧠 Our Strategy
We’re long-biased into the edge, not beyond it yet.
Let 3400 show its hand — we stay adaptive, not predictive.
🔍 This chart is intentionally detailed — it's built to educate, not just signal.
Focus on structure, sequence, and behavior — not just levels.
Lets Zoom in around the Breakout area...
And a Zoomout to Daily...
🧭 “If the structure speaks to you, let it echo.”
– MJTrading 🚀
📍#Gold #XAUUSD #TradingView #TechnicalAnalysis #ChartDesigner #MJTrading #MarketStructure #ForexIdeas #Edge
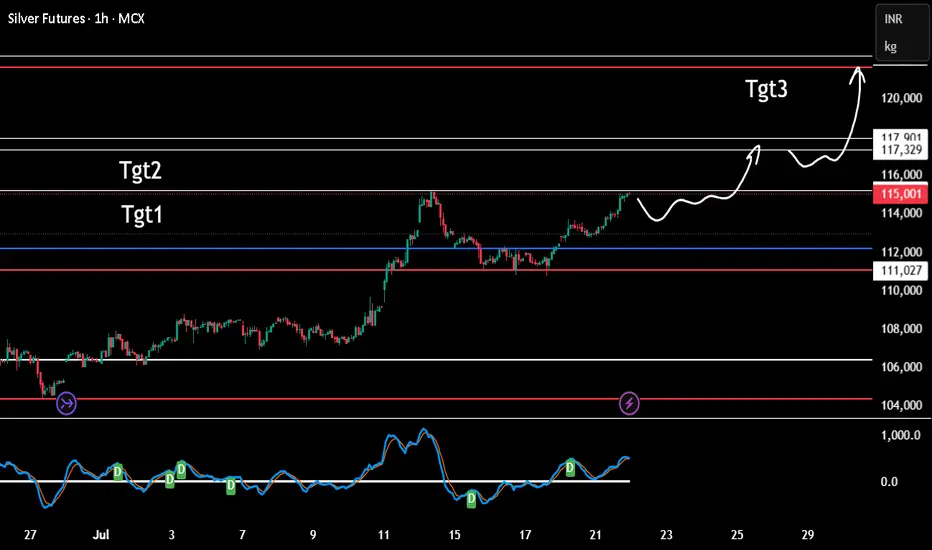
Silver expectationTgt 1 reached. A break out will take to tgt 2 and then tgt 3
Tgt1 is being tested second time, for good break out we need third re-test hence expecting some retracement before a a real break out. Anything above is a possible trap unless the momentum is fast and swift.
RIOT / 3hNASDAQ:RIOT may have completed the 3rd wave of Minor degree wave 3 at 15.34. Now, an expected correction in the 4th wave of Minor degree wave 3 may have started to develop sideways.
#CryptoStocks #RIOT #BTCMining #Bitcoin #BTC
NASDAQ:RIOT CRYPTOCAP:BTC MARKETSCOM:BITCOIN BITSTAMP:BTCUSD
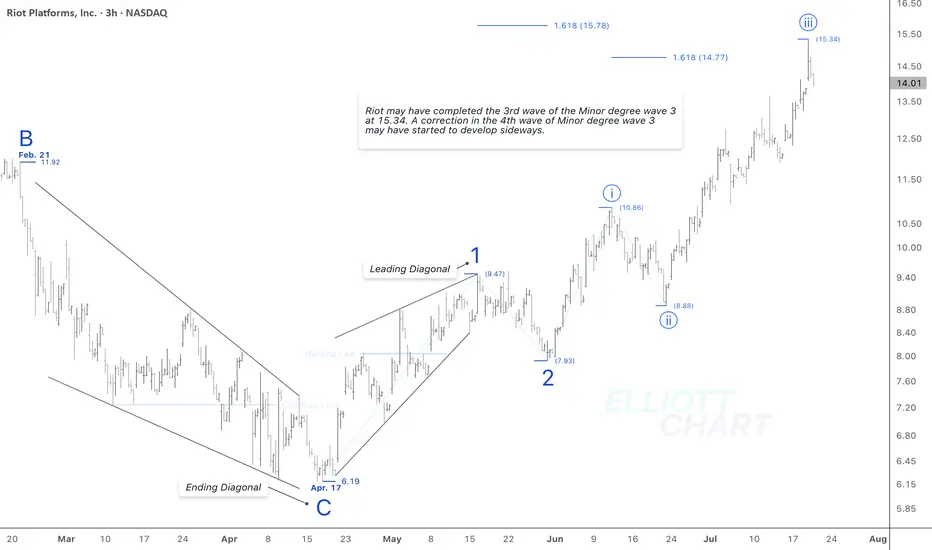
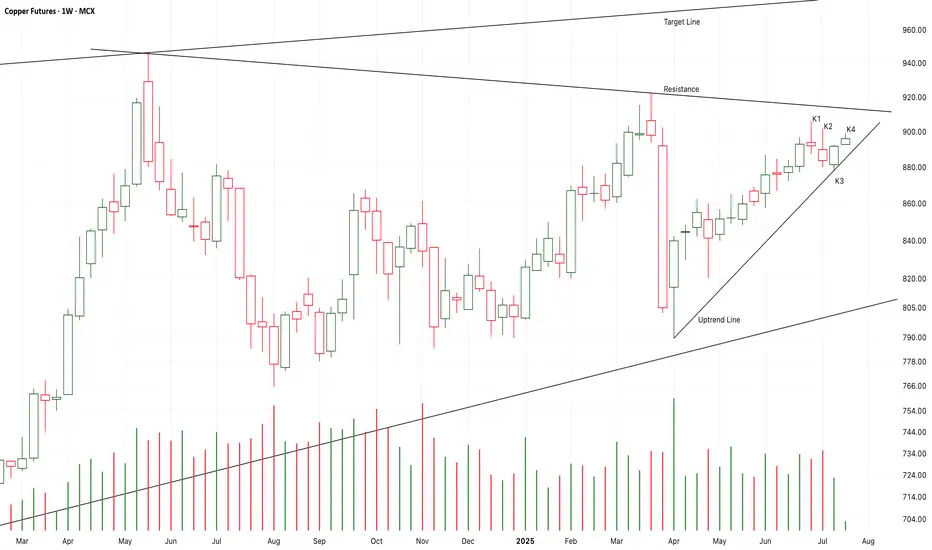
Chart Pattern Analysis Of Copper
K2 and K3 is a strong bullish up engulfing pattent.
K4 started with a bull gap to verify it.
It seems that K5 or K6 will break up the resistance to test the target line in the near future.
If I didn’t buy it earlier,I will try to buy it here.
I still hold the idea that the expensive metals such as Gold/Silver/Copper are in the long-term bull market.
Long-896/Target-1000/Stop-880
EP 01: BTC correction near completionAfter the impulse to last ATH we got a 3 wave correction, last wave being formed by 5 waves, so all together coming to completion. We should visit the liquidation area under last low and swipe that liquidity and aim closer to last ATH if not exceeding it. When the market gives us more information we will go for episode 02.