Nite Pairs among the 10 Elite PairsVery long video but Educative.We are Expecting Gold to Shoot up(Bullish). You can follow us for more Analysis(Images and Videos) with Precise definition of the Financial Market.ENJOY!!!
Wave Analysis

GBP-CHF Support Ahead! Buy!
Hello,Traders!
GBP-CHF keeps falling but
A strong horizontal support
Level is ahead at 1.0921
From where we will be
Expecting a rebound
And a local bullish move up
Buy!
Comment and subscribe to help us grow!
Check out other forecasts below too!
Disclosure: I am part of Trade Nation's Influencer program and receive a monthly fee for using their TradingView charts in my analysis.

TSLA It’s still downtrendIf break support 297 below then It’s going down till 153 , (extention is 125)
The stock market is highly volatile. Please be very careful with your investments.

CLSK / 2hNASDAQ:CLSK >> 8% intraday market sell-off should be likely the partial decline in the last subdivision of the ongoing wave (y), as illustrated in my 2h-frame above.
Further decline by 12% in the ongoing last subdivision >> c of (y) finally will conclude the entire correction in Minute degree wave ii(circled).
Trend Analysis >> The trend will turn up, and an impending impulsive third wave of the same degree is anticipated to follow soon.
The Retracement Targets >> 7.93 >> 7.84

RIOT / 2hAccording to the last analysis, NASDAQ:RIOT declined by 7.6% intraday right from the 4th wave extreme-high of an ongoing wave A, which may be considered as the fourth diagonal pattern in my 2h frame.
Wave Analysis >> The leading diagonal as Minor degree wave A indicates that a relatively deep correction in wave (2) might be developed.
Trend Analysis >> The trend is correcting down in the same degree wave (2), which will take a few weeks to develop.
The retracement targets >> 8.76 >> 8.20 >> 7.93 >> 7.67
#CryptoStocks #RIOT #BTCMining #Bitcoin #BTC

Price may pull back into the support zone.Key Elements of the Chart:
Instrument: Gold (XAU) vs. US Dollar (USD)
Timeframe: 1-hour (1h)
Current Price: Approximately $3,389.855
Time of Screenshot: 3:40 AM on June 18, 2025 (UTC+3)
Chart Structure and Notations:
Price Zones Highlighted:
Support Zone: Around $3,370 – $3,380
Target/Resistance Zone: Around $3,450 – $3,460
Price Labels:
HH: Higher High
HL: Higher Low
These indicate an uptrend structure, with buyers in control.
White Arrows: Indicate a potential bullish scenario:
Price may pull back into the support zone.
Then bounce and continue upward toward the $3,450 – $3,460 resistance area.
A “V-shaped recovery” is suggested.
Descending Wedge Breakout: There’s a small descending wedge pattern within the current move, often interpreted as a bullish continuation pattern.
Summary:
The chart suggests a bullish bias for gold, projecting a possible retracement to support (~$3,375) followed by a rebound toward resistance (~$3,455). The higher highs and higher lows reinforce this upward trend possibility.

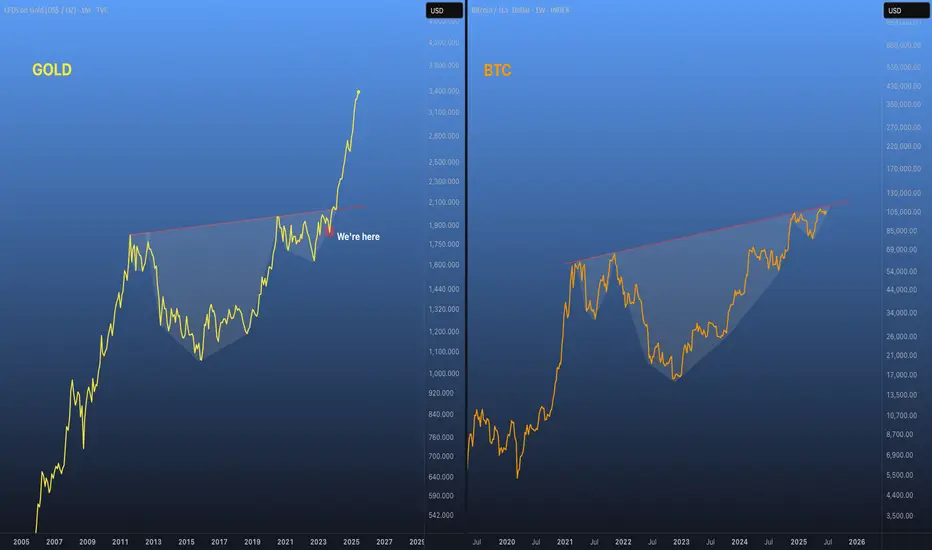
XAU vs. BTC👀 So far, none of the #Bitcoin - #Gold fractals I’ve shared earlier have failed. 👌
Here’s another high-timeframe comparison that I genuinely believe in. 🐋
Yes, #XAU is gaining momentum as global tensions rise — but that #BTC scenario works just fine for me. 📈
After all, the ~$150K range has been my target for this cycle for the past few years.
Do you wanna see the bigger picture? (USDT.D Analysis 12H)After counting many waves for many days, I have a senario for USDT dominance which will lead the entire market on its way.
For those whose not fimiliar with this parameter, there is a very simple explanation.
It's the reversed way to see the market. If this parameter drops, your alts will skyrocket and if it rises, you're gonna be crying on somebody's X post's comments.
First of all, the short term wiev is bearish. We are currently in an impulsive wave 3 which is expected to be hardest for altcoins at the moment. There will be crash unless the value of this parameter drops below %4.50 and invalidates the analysis (you'll like this senario better, trust me).
All right, we got rid of the scalpers who bothered to read this far and now I'm here to explain what I see for the golden future.
Currently, USDT.D is forming a BEARISH impulsive wave for higher time frames. As long as you stick with 4H candles, you won't be able to see it.
USDT.D is trying to forming its bearish flag, by doing so it will be its second wave and will prepare its very own collapse.
Last summer, BTC has done the same thing (Check for daily time BTC).
There is more.
If we calculate the depth of this incoming flag pattern, breaking this flag would lead USDT to %3.75 which is the yearly support (Check in weekly, you'll see it).
If we calculate the time needed to past for this flag to work, it's the same amount of time needed for previous flag to break from last summer.
We also need to add fundementals in it. Currently people started to talk about a senario which will lead world to WW3. I don't think that will happen. But the problem in here is it will market throguh downside.
Furthermore, there is FED.
FED is insisting to leave interest rates on its own without a change. I believe that we won't be seeing any rate cuts till the end of this summer.
I believe that the FED will cute rates between Agust and September. This will be the fuel for our rocket to fly and ignite the wave 3.
I know it's a long script but you know it's necessary.
Thanks for reading.

GOLD/USD Suggests a bullish shift in market structure.1. Break of Structure (BoS)
Marked near the recent swing high, indicating a break above previous resistance.
Suggests a bullish shift in market structure.
2. Resistance Zone
Highlighted above the BoS area.
Price is currently interacting with this zone — a potential area of liquidity and reaction.
3. Supply Zone
Marked leftward in the chart, indicating a previous area of heavy selling pressure.
Possibly where institutional orders were filled.
4. FVG (Fair Value Gap)
A price imbalance area, suggesting inefficient pricing between buyers and sellers.
Often used by smart money traders to predict where price may return before continuing the trend.
5. Lower Low
Identified as part of the bearish structure before the BoS.
Confirms that the market had been in a downtrend prior to shifting bullish.
6. Entry Zone
Defined just below the current price, marked in a red box.
Represents the optimal entry area for a long trade — likely aligned with discounted price levels or demand zones.
7. Target Zone
Marked in green above the resistance.
Indicates the projected take-profit level, suggesting continuation of the bullish trend if resistance is broken and held.
8. Trendline Support
A diagonal trendline supports the current upward momentum.
Likely confirming higher highs and higher lows formation — a classic bullish trend indicator.
---
📈 Market Context Summary
The market previously formed a bearish structure, making lower lows and testing supply.
A significant break of structure (BoS) occurred, indicating a bullish reversal.
Price is currently ranging near resistance, within a potential accumulation phase before a breakout.
The setup suggests a long position entry around $3,318, with a target near $3,500.
The chart is aligned with Smart Money Concepts (SMC) — using tools like FVG, supply/demand zones, and structure shifts.
---
💡 Professional Takeaway
This is a bullish continuation setup using advanced price action and smart money concepts. The trader expects price to:
Retrace into the entry zone (possibly to fill the FVG),
Gain support from demand or institutional buying,
Break resistance and push toward the target zone for a higher high.

Shows price action with clear bullish and bearish candles.Key Elements in the Chart:
Current Price: Around $104,615 at the time of the screenshot.
Time: 3:30 AM on June 18, 2025 (UTC+3).
Candlestick Chart: Shows price action with clear bullish and bearish candles.
Chart Patterns:
Multiple descending channel patterns, with price breaking out upwards.
Support Zone: Around $104,000 (highlighted in green).
Resistance Zone: Around $110,000–$111,500 (also highlighted in green).
Lower Support Zone: Around $97,000–$99,000.
Forecast Paths (White Arrows):
The white arrows represent potential future price paths:
Bullish Scenario: Bounce from support near $104k and rise toward the $110k–$111k resistance zone.
Bearish Scenario: Failure to hold the $104k support leads to a drop toward the $97k–$99k range.
Choppy Scenario: Price oscillates within the current range before breaking either up or down.

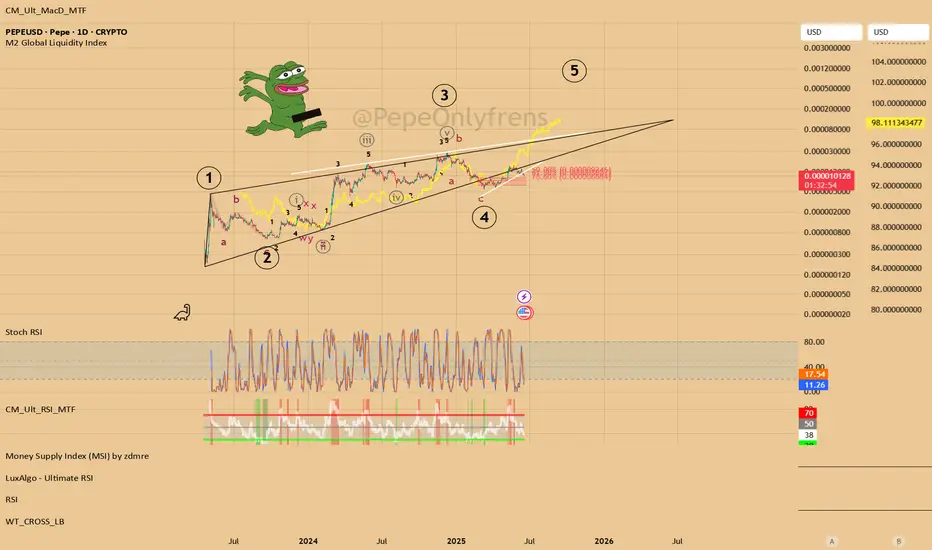
$PEPE Elliott Wave Theory + M.2 CRYPTOCAP:PEPE if this is a wave (2) we can go as low as .x668. If it's a wave 4 of (1) .x92. Close shorts at .x92 go back core spot. Hold some dry powder for extreme dip. Weekly Stochastic RSI needs a reset before the next 20 - 30x move in the next 3-4 months.
Nightly $SPY / $SPX Scenarios for June 18, 2025🔮 Nightly AMEX:SPY / SP:SPX Scenarios for June 18, 2025 🔮
🌍 Market-Moving News 🌍
💼 Business Inventories Flat in April
U.S. business inventories held steady in April, indicating stable consumer and wholesale demand. That suggests production won't need to cut sharply in the near term, supporting GDP outlook
🏭 Industrial Production Slips
Industrial output declined 0.2% in May, signaling ongoing weakness in factory activity amid less favorable global trade conditions .
🌐 Geopolitical Pressures Persist
Heightened tension in the Middle East continues to pressure risk assets. Investors remain focused on safe-haven flows into gold, Treasuries, and defensive equities, with analysts noting the risk backdrop remains tilted to the downside
📊 Key Data Releases 📊
📅 Wednesday, June 18:
8:30 AM ET – Housing Starts & Building Permits (May)
Measures new residential construction — leading indication of housing sector health.
8:30 AM ET – Initial Jobless Claims
Tracks the weekly count of new unemployment filings — useful for spotting early labor-market weakening.
2:00 PM ET – FOMC Interest Rate Decision
The Federal Reserve is expected to hold steady. Market focus will be on any commentary that hints at future tightening or easing plans.
2:30 PM ET – Fed Chair Powell Press Conference
Investors will parse Powell’s remarks for guidance on rate paths, inflation trends, and economic risks.
⚠️ Disclaimer:
This is for educational/informational purposes only and does not constitute financial advice. Consult a licensed advisor before making investment decisions.
📌 #trading #stockmarket #economy #housing #Fed #geo_risk #charting #technicalanalysis

SNIPERRRR!
1. A beautiful double bottom / W pattern has formed on the 4H.
2. The market has fulfilled the MAIN SUPPORT ZONE of the breakout candlestick on the left - 1H
3. A THIRD TOUCH on the trendline has been confirmed on the 1H as well
4. A failed DOUBLE TOP movement at the CMP(3.388) indicating bullish bias has more influence
5. I used the W pattern/structure before the failed DOUBLE TOP movement at MP(3377 - 3381 as my SL. Why? I base my SL's on market structure. Makes everything easier.

AUDJPY 4H Short Setup📕 Smart Money Trade Breakdown
🔻 AUDJPY 4H Short Setup
This is a short entry on AUDJPY, taken from a premium price zone within an Order Block (O-B) and Supply & Demand (S&D) area, showing strong bearish rejection after internal market structure shift.
📉 Entry: 94.096
🎯 Take Profit: 90.136
🛡️ Stop Loss: 95.399
⚖️ Risk-Reward Ratio: ~1:3
🔍 Key Confluences:
Entry within a well-defined Order Block and S&D zone
Price reacted to upper supply with a visible wick rejection
Break of internal structure (M15-H1) shows bearish intent
Bearish engulfing on confirmation candle
Trendline break suggests end of bullish wave
This setup aims to catch the institutional distribution phase before price retraces to discount demand around the 90.100 zone or lower.
⚠️ Disclaimer: This is for educational purposes. Apply proper risk management and strategy validation before live execution.

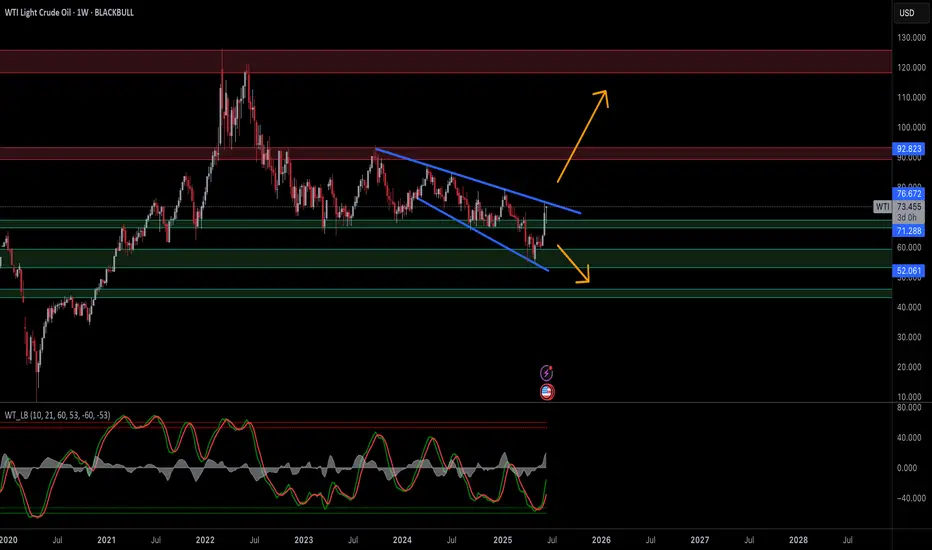
Oil Eyes $90+ as U.S.–Iran Conflict LoomsWTI Crude Oil — Bullish Reversal in Play as War Risk Escalates
Technical & Geopolitical Outlook — Weekly Chart | 17 June 2025
🧭 Current Market Condition:
WTI crude oil is breaking out of a multi-month falling wedge, a classically bullish reversal pattern, after bouncing from the $67–68 support region. This technical move is further amplified by rising geopolitical tensions in the Middle East, particularly fears of a potential U.S. military strike on Iran, which would threaten global oil supply routes through the Strait of Hormuz.
The current breakout attempt aligns with a sentiment shift from oversold to recovery mode, supported by a sharp rise in weekly momentum indicators.
📊 Key Technical Highlights:
Bullish Falling Wedge Breakout: Price breaking above descending resistance.
Key Resistance Levels:
$76.67 – immediate supply zone
$92.82 – prior breakout area; major target if breakout sustains
Key Support Levels:
$71.28 – breakout retest level
$67.00–$68.00 – wedge base, strong historical support
$52.00 – longer-term bearish invalidation (unlikely unless demand collapses)
Momentum: Weekly stochastic sharply rising from bottom, signaling strength building.
🔺 Bullish Scenario — If U.S. Attacks Iran:
If the U.S. carries out military strikes on Iranian targets, oil prices are highly likely to:
Price in geopolitical risk premium of $10–$20/barrel.
Spike toward $90–$100 range within days or weeks due to:
Fears of supply disruption (Hormuz choke point)
Panic buying and short covering
Strategic reserves hoarding
Technical Targets:
$76.67 → Break above confirms bullish continuation
$92.82 → First major upside target
$100–$110 → Stretch target if conflict escalates or prolongs
🛢️ Energy traders and institutions typically front-run geopolitical escalations, so price can jump before any physical conflict if tensions remain unresolved or rhetoric intensifies.
🔻 Bearish Scenario — Fake Breakout or De-escalation:
Rejection from $76.67 or failure to hold above $71.28 can trigger pullbacks.
If tensions cool and Iran conflict is diplomatically diffused:
WTI may slide back toward $68.00 and re-enter the wedge.
Below $67.00, oil could revisit $60–$52 range in a risk-off macro environment.
🛡️ Risk Management & Outlook:
Geopolitical events can override technicals, especially in commodities.
Gaps, whipsaws, and sharp reversals are common — caution with overnight positions.
Consider hedging strategies or limited-risk option plays if trading leveraged oil instruments.
📢 If you found this analysis valuable, kindly consider boosting and following for more updates.
⚠️ Disclaimer: This content is intended for educational purposes only and does not constitute financial advice.
GOLD → Bear pressure. Area of interest: 3340–3306FX:XAUUSD continues to decline under pressure from sell-offs. However, the situation is interesting overall, as there is conflicting data and unexpected price behavior is surprising the market...
On Tuesday, gold is trying to regain the $3,400 level after pulling back from highs, but it is still facing selling pressure and returning to $3,377. The market reaction to the $3,377 level is quite weak, and if the price starts to stick to support, this will lead to a further decline. The dollar is strengthening as a safe-haven currency, holding back gold's growth. The markets are focused on the outcome of the Fed and Bank of Japan meetings, as well as US retail sales data. Any dovish signals from the Fed could support gold and weaken the dollar.
Technically, on D1, gold is returning below the 3382 level (selling zone) and testing 3377. The reaction to the false breakout of support is weak, and the price is forming a pre-breakdown consolidation relative to 3377. There are clear areas of interest that could lure the price before the news. For example, 3343, 3306, 3245.
Resistance levels: 3382, 3403.
Support levels: 3377, 3339, 3320
The bearish structure will be broken if the price strengthens to 3403 and consolidates above that level. This will reinforce buyers' expectations, which could lead to growth. At the moment, I would expect two scenarios: price consolidation within 3377-3403. But technically, the chart shows that there is bearish pressure in the market. The price continues to storm the support level of 3377, which may not hold up against another retest. A break 3377 could lead to a fall to the areas of interest at 3339-3306.
Best regards, R. Linda!

2025-06-17 - priceactiontds - daily update - nasdaq
Good Evening and I hope you are well.
comment: Big up, big down, big confusion. Market rallies 500 points yesterday and today we get a late bear breakout and close below 22000. Traps on both sides and I am not believing in bear strength what so ever. I see this as a triangle and 22000 is the middle. Chop chop.
current market cycle: trading range
key levels: 21700 - 22300
bull case: Bulls want to stay above 21900 and print a higher low to then re-test 22300. Today they were weak and let the bears close below 22000 which was unexpected, giving yesterday’s bullishness. Tomorrow we have FOMC and I doubt market can move far from 22000 tomorrow. Any longs closer to 21800 make sense.
Invalidation is below 21680.
bear case: Bears left behind a gap up to 22015 but I doubt it can stay open. We have to decent trend lines below us and bears would need to break strongly below 21900 to try and go for 800 or even 700. Bears do not have any arguments to go below 21700 so I won’t make up any. That doesn’t mean it can not happen but it’s unlikely.
Invalidation is above 22230.
short term: Completely neutral around 22000. Only interested in longs below 21900 and shorts closer to 22100.
medium-long term - Update from 2024-06-15: Daily close below 21450 is my validation for the new bear trend which has the first bigger target at 21000 but I think we will printed below 20000 again this year. Structure is obviously not yet bearish, so don’t be early if you want confirmation and can’t/won’t scale in to shorts higher.
trade of the day: Buy low, sell high and scalp. Clear range 22000 - 22100 and the late bear breakout was ok if you made your money before. I do think it was unusual that we did not close the gap to y close 22176.

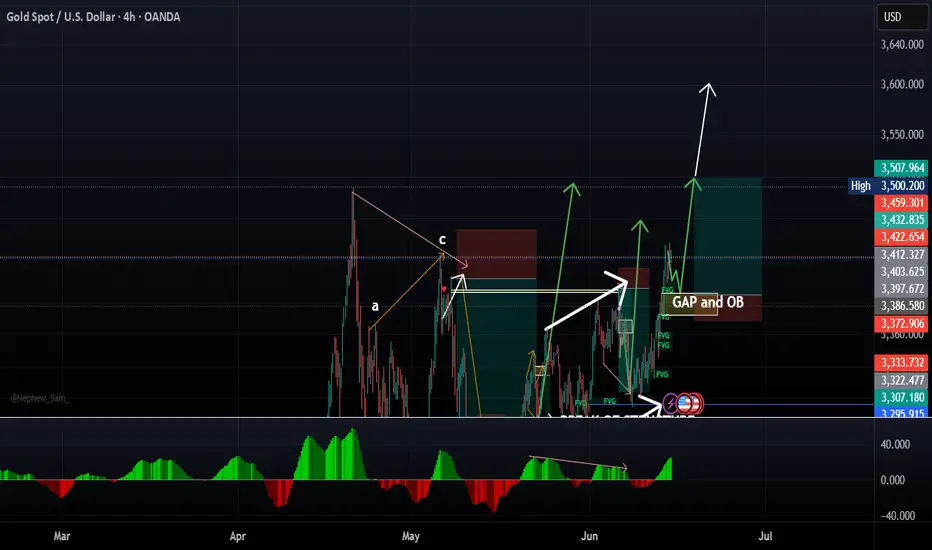
XAUUSD BUY/LONG 1:5R AND MORE ($3500+) Reason for buy:
1. With the geo-political situation between IRAN and ISRAEL Gold is seen as a SAFE HAVEN by investors. This war will definitely go on for a few weeks and most probably months. So treat it as an investment.
2. For the impulsive move upwards, we need a small correction to take out the OB and probably the gap as indicated.
3. No divergence in the higher time frames indicating a strong bullish continuation.
Entry: 3406-3397 AREA
STOP LOSS: 3373
TAKE PROFIT : 3500 and above!
Note: Use this opportunity to maximise profits by adding to winning positions.
GOLDEN rule: Always Always ALWAYS use a STOP LOSS.
BTC long if it reclaims or holds ### 🔍 Breakdown of Chart:
* Timeframe: 15m BTCUSDT (Bybit)
* Current Trend: Sharp downtrend from the recent highs
* Zone Marked in Blue: Bullish Order Block / Demand Zone
* Yellow Path: Anticipated reclaim and reversal scenario
* White Curve: Possible double bottom (liquidity sweep)
---
### ✅ Why Long Plan Makes Sense:
1. Demand Zone (Blue Block):
This zone has previously caused a strong bullish reaction. It's likely institutional demand may rest here again.
2. Liquidity Grab Below:
Price might sweep the recent low (creating a trap for shorts) before reclaiming. That’s your “double bottom” logic.
3. Reclaim = Confirmation:
Waiting for a reclaim above the zone before longing shows patience and discipline — a smart move to avoid catching a falling knife.
4. Clear Invalidations:
If price fails to reclaim and breaks below the blue zone with momentum, your setup is invalidated — perfect risk control.
---
### ⚠️ Caution:
* If the red bearish OB above (around 104.6–104.8K) is respected, you might face rejection there. Consider partial profits before that area.
* Use confirmation (like a bullish engulfing, BOS, or FVG fill) after reclaim.
* If breaks blue zone then we might enter short

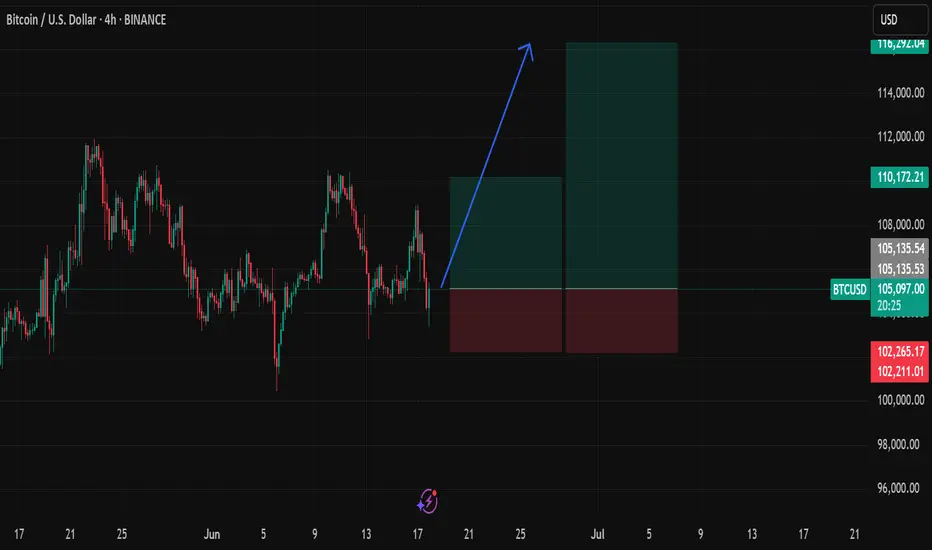
btc/usd good risk/reward bullish move!No need for words — just follow the arrow and check the risk/reward.
I'm starting a signal room soon, but for now, it's all free. Watch and decide for yourself.
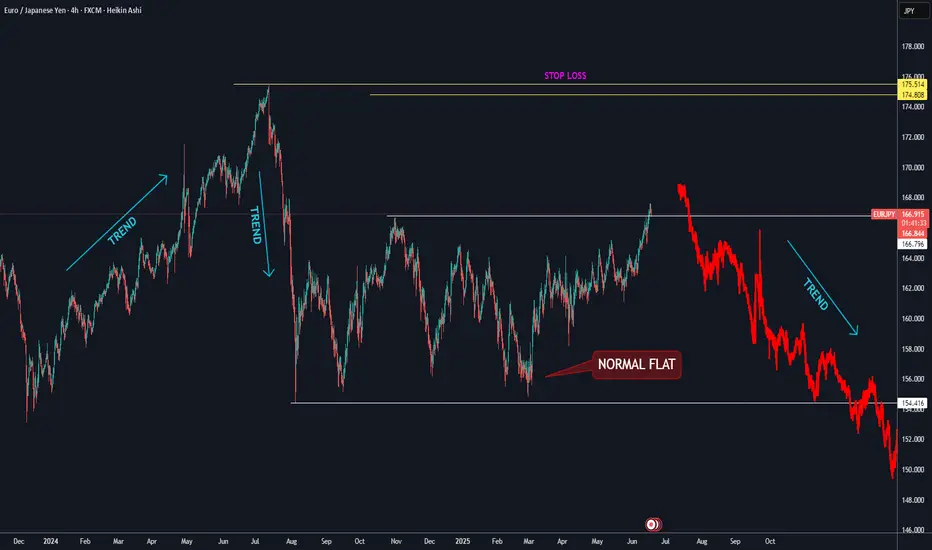
EURJPYWe see a clear bearish pattern that symbolises sells coming soon.
Clear corrective structure that will ursher in an impulsive drop.
Trade with care use a stop loss
WW3 Scenario - Bull flag potentialWe bottomed at the gap fill at $57, a long term target I had been expecting. A bullish retest at the golden pocket followed, now all we need is a clean break above $80 to end the lower high downtrend. I don't want to comment on politics, but suffice to say the price of oil will tell us what's really going on. A supply shock has the potential to send oil to the $200 level. I don't know what the world will look like in that scenario, but I can assure you it will be a global catastrophe. Inflation will reignite, the interest rates will likely go up.
This is the single most important chart to be watching now. Forget Apple, forget Nvidia. Oil and the DXY is where the chart will reveal the news. Pay attention!

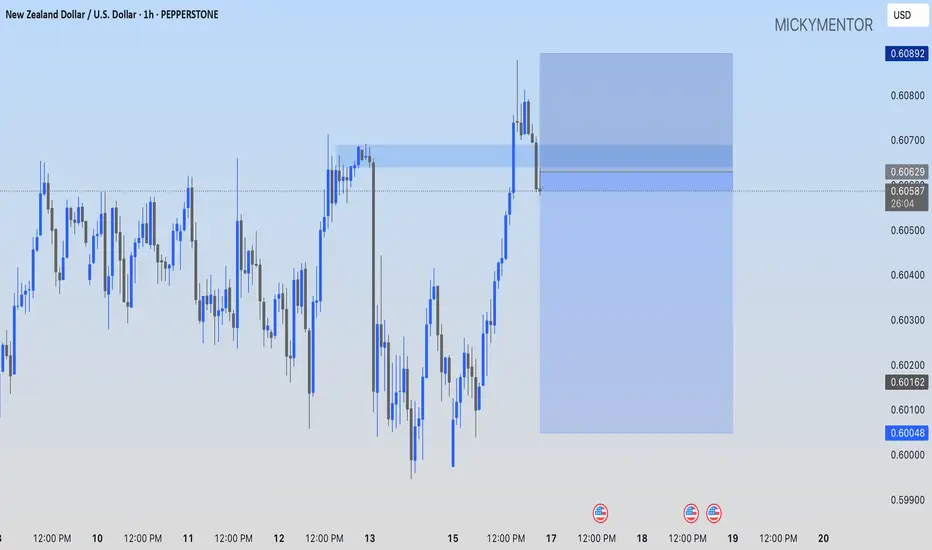
NZDUSD: A SELL TRADE IDEAPEPPERSTONE:NZDUSD I'm selling at current market price, targeting 0.60048 price level