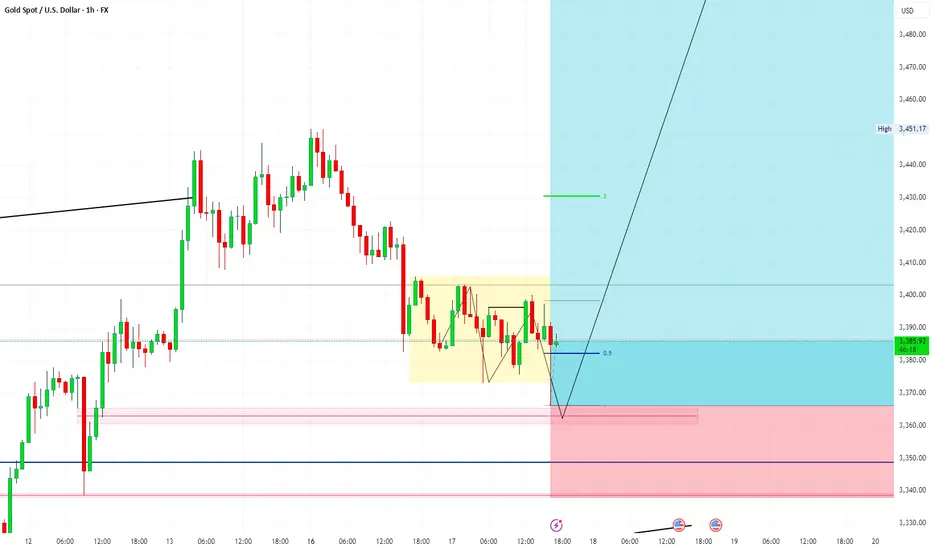
Gold (XAUUSD) – Demand Zone Holding, Silver Leading BreakoutGold has respected its demand zone near $3,367–$3,382 and is attempting to bounce higher. Importantly, Silver (XAGUSD in pink overlay) is leading the upside move, having broken out cleanly above $37.00 and still climbing. This confirms the bullish momentum across precious metals.
Geopolitical tensions, dovish Fed commentary, and risk-off market conditions continue to favor a move toward $3,451, $3,471, and possibly $3,495.
🔍 Technical Breakdown (4H)
Support Zone: $3,367–$3,382 (retest of broken resistance)
Bullish Structure: Rising lows, trendline holds, and higher timeframe support remains intact
Projected Targets:
🎯 TP1: $3,451 (recent high)
🎯 TP2: $3,471 (key extension)
🎯 TP3: $3,495 (top of range)
Stop Loss: Below $3,351 (invalidates demand structure)
🪙 Silver (XAGUSD) Overlay Insight:
Currently at $37.11+, showing leadership in the breakout.
Suggests gold will likely follow through — watch for Gold catching up.
🧠 Macro & Fundamental Context (June 17)
Bullish Drivers:
🔥 Ongoing Middle East war escalation (Iran-Israel, US troop buildup)
🏦 Dovish Fed tone, soft retail sales, rate cuts expected from Sept
🧾 Silver strength confirming demand across metals
Risks:
☮️ Unexpected ceasefire headlines could cause knee-jerk pullbacks
📈 Hot inflation data or hawkish Fed rhetoric could pressure upside
📅 Key Events to Watch:
FOMC members' speeches this week
US Core PCE inflation print
War headline velocity — particularly involving shipping or direct US-Iran confrontation
🧭 Strategy Suggestion:
Tactical Buy on Rejection Wick from current demand zone
Watch Silver momentum — if it breaks $37.50+, gold likely catches up fast
Consider scaling out around $3,451–$3,471 with final target near $3,495
Wave Analysis

Hanzo / Nas100 30 Min ( Accurate Tactical Break Out Zones )🔥 Nas100 – 30 Min Scalping Analysis (Bearish Setup)
⚡️ Objective: Precision Breakout Execution
Time Frame: 30-Minute Warfare
Entry Mode: Only after verified breakout — no emotion, no gamble.
👌Bullish After Break : 21930
Price must break liquidity with high volume to confirm the move.
👌Bearish After Break : 21770
Price must break liquidity with high volume to confirm the move.
☄️ Hanzo Protocol: Dual-Direction Entry Intel
➕ Zone Activated: Strategic liquidity layer detected — mapped through refined supply/demand mechanics. Volatility now rising. This isn’t noise — this is bait for the untrained. We're not them.
🩸 Momentum Signature Detected:
Displacement candle confirms directional intent — AI pattern scan active.
— If upward: Bullish momentum burst.
— If downward: Aggressive bearish rejection.
🦸♂️ Tactical Note:
The kill shot only comes after the trap is exposed and volume betrays their position.

BTCUSD H4-Keep entering and exiting Follow a Plan #BTCUSD #SMCTRADE BUY BTCUSD TIME FRAME H4 : BTCUSD H4-Keep entering and exiting Follow a Plan #BTCUSD #SMC

mid afternoon updateSPY looks like it's about to break down harder than usual. Gold had a flase breakdown. NG testing support. Oil looking to rally. BTC dropping to support here, but can go much farther down.

18 june Nifty50 brekout and Breakdown leval
CALL (CE) – Bullish triggers
↑ 24,437 – 24,547 : Safe‑zone long entry
↑ 24,672: Hold CE while above this mark
↑ 24,780 : Opening‑S1 breakout, keep holding CE
↑ 24,930.00 : Turns bias positive; fresh CE can be added
↑ 25,083.00 : Entry level for aggressive longs
↑ 25,318.00 : Short‑cover zone; strong upside momentum possible
PUT (PE) – Bearish triggers
↓ 25,318.00 : If price closes back under, shift to PE (safe)
↓ 25,083 : PE in the “risky” reversal zone
↓ 24,930 : Bias flips negative; keep/add PE
↓ 24,780 : Opening‑R1 break; hold PE
↓ 24,672 : Continue PE below this level
↓ 24,535 : Unwinding zone – watch for fast drops
↓ 24,437 : Final downside support; trail PEs here

LYV Technical Analysis: Bullish Continuation Pattern SignalsTechnical Analysis:
LYV is exhibiting a strong bullish structure on the daily timeframe. Following a period of consolidation within a larger uptrend, the price has initiated a breakout from a symmetrical triangle pattern. This technical development suggests a high probability of trend continuation, with initial price objectives identified at 150 and 160.
Analysis:
Established Ascending Channel:
The primary market structure is a well-defined ascending channel that has been in place since the lows of April. The price has consistently respected the boundaries of this channel, forming a clear pattern of higher highs and higher lows. This establishes the dominant trend as bullish, with the lower trendline acting as significant dynamic support.
Symmetrical Triangle Consolidation & Breakout:
Within this uptrend, the price action from May through mid-June formed a classic symmetrical triangle. This pattern represents a period of consolidation and contracting volatility, often preceding a significant expansion in price. Recently, a decisive bullish breakout has occurred, with price action closing firmly above the pattern's upper trendline. This breakout serves as a strong signal for the resumption of the primary uptrend.
Key Levels:
Support Zone (135.00 - 140.00): This horizontal zone represents a critical area of support, having been tested successfully in the past. It also aligns near the lower boundary of the ascending channel, creating a confluence of support that reinforces its significance. For the bullish thesis to remain valid, the price should hold above this area.
Target 1 / Resistance 1 (150.00): The first upside price objective is located at the 150.00 level. This area aligns with the previous swing high from early May and represents a logical point for initial profit-taking or potential price reaction.
Target 2 / Resistance 2 (160.00): Should the price overcome the 150.00 resistance, the next significant target is the 160.00 zone, which corresponds to the highs seen in late February. This level also coincides with the upper boundary of the long-term ascending channel.
Outlook:
The chart projects a potential trajectory following the breakout. An initial impulse move towards the 150.00 target is anticipated. It is common for price to perform a "retest" of the broken trendline (now support) before continuing its ascent. Such a retest could offer a favorable secondary entry point for traders aligned with the trend.
Conclusion:
The combination of an established uptrend, a clean breakout from a bullish continuation pattern, and clearly defined support and resistance levels presents a compelling case for further upside in LYV. The immediate focus is on the 150.00 level, with a secondary target at 160.00.
Disclaimer:
The information provided in this chart is for educational and informational purposes only and should not be considered as investment advice. Trading and investing involve substantial risk and are not suitable for every investor. You should carefully consider your financial situation and consult with a financial advisor before making any investment decisions. The creator of this chart does not guarantee any specific outcome or profit and is not responsible for any losses incurred as a result of using this information. Past performance is not indicative of future results. Use this information at your own risk. This chart has been created for my own improvement in Trading and Investment Analysis. Please do your own analysis before any investments.

Chart Analysis on the 10 Elite pairsVery long video but Educative.We are Expecting Gold to Shoot up(Bullish). You can follow us for more Analysis(Images and Videos) with Precise definition of the Financial Market.ENJOY!!!

GBPUSD Sell Limit Activated June 17 2025This trade was taken today, (tuesday- june 17, 2025). Based on 1H timeframe Supply. I wait for London Session and check for possible liquidity sweep in 15 min and 5min timeframe. I noticed a CHOCH followed by tap in Supply zone of the schematics. I decide to create a sell limit order during New York Session to maximize the Risk to Reward Ratio. (Check the charts for detailed label and movement). 1:7RR
Wyckoff schematics in 1H timeframe--> confluence of supply in lower timeframes for validity.
RR:7
Another classic distribution. patience is the key :)
#wyckoff
#sell
#supplyanddemand

FTMM LONG TRADE 17-06-2025FTMM Technical Buy Call
Rationale - FTMM broke out of a prolonged range formation (since Nov 2023) at Rs. 5.02, forming a scale pattern beforehand. We expect the stock to reach minimum quantified displacement targets.
🚨 TECHNICAL BUY CALL – FTMM🚨
- Buy 1: Current level (Rs. 5.52)
- Buy 2: Rs. 5.02
- Buy 3: Rs. 4.82
- TP 1: Rs. 5.89
- TP 2: Rs. 6.45
- TP 3: Rs. 6.95
Stop Loss - Below Rs. 4.40
Risk-Reward Ratio - 3.5
Caution: Please buy in 3 parts in buying range. Close at least 50% position size at TP1 and then trail SL to avoid losing incurred profits in case of unforeseen market conditions.
PLEASE BOOST AND SHARE THE IDEA IF YOU FIND IT HELPFUL.

MERIT LONG TRADE - 17-06-2025 (MERIT PACKAGING)MERIT Technical Buy Call
Rationale - MERIT broke out of a prolonged range (Rs. 7.23 - Rs. 14) since Oct 2022 with strong volume distribution, forming a bullish IFDZ and other supportive patterns. These levels are expected to act as barriers against downward movement.
🚨 TECHNICAL BUY CALL – MERIT🚨
- Buy 1: Current level (Rs. 14.92)
- Buy 2: Rs. 14.20
- Buy 3: Rs. 13.50
- TP 1: Rs. 15.97
- TP 2: Rs. 17.15
- TP 3: Rs. 18.30
Stop Loss - Below Rs. 12.00 closing basis
Risk-Reward Ratio- 3.31
Caution: Please buy in 3 parts in buying range. Close at least 50% position size at TP1 and then trail SL to avoid losing incurred profits in case of unforeseen market conditions.
PLEASE BOOST AND SHARE THE IDEA IF YOU FIND IT HELPFUL.
4 days ago

DXY Long term targetI think the IV wave is finished. now in 1-2 year dxy next target will be around 120. probably in 1 year.

USOIL – Reclaiming the Energy Narrative | WaverVanir Macro Rever📉 Chart Thesis:
After nearly three years of structural decline from the $129 peak, crude oil (USOIL) is approaching a confluence zone of historic Fibonacci support ($56–$60) and a multi-year descending trendline.
This zone may mark the bottom of a long-term accumulation phase.
🧠 Strategic Perspective (WaverVanir View):
“It’s time to take back our resource. Not just politically—but economically, institutionally, and structurally.”
WaverVanir International LLC sees this setup as a rare macro pivot. This isn’t about short-term fluctuations—it’s about the global realignment of resource value in a world where:
Central banks are overleveraged
Strategic petroleum reserves are drawn down
War premium is mispriced
Real assets are undervalued
📊 Key Levels:
Support Zone: $56.04 (historical institutional buy zone)
Breakout Trigger: Trendline above $67.00
Target 1: $101.35 (0.786 Fib)
Target 2: $129.42 (1.0 Fib)
Target 3: $160.58 (1.236 Fib projection)
⚠️ Risk Disclosure:
We are not yet capitalized but actively building a legally compliant funding vehicle. No capital is currently allocated. This post is part of our vision publication cycle to build trust and transparency in WaverVanir’s thesis.
📌 Follow WaverVanir International LLC for conviction-based macro trade ideas at the intersection of data science, price action, and risk strategy.
#USOIL #MacroTrading #Commodities #WaverVanir #TradingView #QuantMacro #EnergyRevolution #FibonacciAnalysis #MarketStructure #EmergingFund

Trading Game of the day 17-MAY=2025Trading Plan of the day :-
1-bearish trend
2-(1-2-3)pattern
3-PDA :-30 m FVG
4-FVA:-which should give a chance for buyer to take its opportunity and then selling pressure increase in the bearish direction at the PDA
5-At Lower timeframe :-CISD with FVG
6-ARGUMENT:-
There was an FVA with FVG and OB bullish :-That make the rejection candles against the trend
These rejection candle was not significant because not only it is against the trend but there is no CISD against the trend and there is no FVG against the trend

GBPUSD ANALYSIS AND TRADE We've been tapped into the trade for GBPUSD
Let's see how the market would react.
Trade just became active, you can still join in

GOLD - WAVE 5 BULLISH TO $3,622 (UPDATE)Gold is currently going through a strong 'accumulation' phase for buyers, hence why we're seeing these choppy price actions, trying to liquidate buyers. It won't surprise me if we see dips lower, but overall we remain bullish as long as Gold is ABOVE THE WAVE 2 LOW. Breaking below this low, will invalidate bullish structure.
Wave 2 Invalidation Level - $3,245❌

TOTALCAP — The Next Trillion Crypto Move: Are You Ready?When people analyse the crypto market, they often default to Bitcoin and for good reason. It’s the one and only, the king. But sometimes, to see the forest instead of just the tree, you need to zoom out and study the broader picture.
That’s where the Crypto Total Market Cap (TOTALCAP) chart comes in. It’s essentially the mirror of Bitcoin, but it offers powerful macro insight — not just price, but scale. Looking at trillions instead of dollars changes how you frame support, resistance, and overall sentiment. Let’s dive in.
🧠 Why TOTALCAP Matters
TOTALCAP aggregates the value of every coin and token — the complete valuation of the entire crypto industry.
And while it often moves in sync with Bitcoin, it carries a different weight.
Shows the “big picture” of institutional and retail money flow
Offers clearly defined round-number zones (Trillions) as psychological S/R
Removes coin-specific anomalies and focuses on collective momentum
In bull and bear markets, these trillion-dollar thresholds act like major checkpoints. Watching how TOTALCAP interacts with these levels can give early signals that BTC or alts alone can’t.
Historical Key Levels & Structure
Let’s break it down by macro phases:
✅ November 2021 — Peak of Last Bull Market:
TOTALCAP peaked exactly at $3 Trillion.
This level acted as a ceiling — once hit, the market reversed sharply.
This marked the top of the 5-wave impulsive move (Elliott Wave theory).
📉 November 2022 — Bear Market Bottom:
TOTALCAP dropped below $1 Trillion, bottoming at $727 Billion.
This was almost a 0.786 fib retracement from peak — similar to BTC’s historical retracements.
The $1T mark was retested as resistance before being reclaimed as support.
📈 2023–2025 — The Bull Awakens:
$1 Trillion flipped into solid support throughout 2023.
A clear sign the macro market structure had shifted bullish.
Once $2T was breached, things moved fast.
🚀 Current State:
The market surged above the previous $3T ceiling.
TOTALCAP has hit a new ATH: $3.73 Trillion
Now, the question is: Is this the start of a new leg higher, or a bull trap before a correction?
🔍 Fibonacci Confluences — Why $3.7T Was Key
The sharp rejection at $3.7T wasn’t random. It aligns with:
1.0 Trend-Based Fib Extension: From 91.24B → 3T high → 727B low = 1.0 = 3.65T ✅ precise hit
1.272 Fib Extension of the macro move
Upper Pitchfork Resistance
Channel Top Rejection
→ All signals converged to mark that level as major resistance
🌀 Elliott Wave Macro Count
Looking at the weekly timeframe, we can see a clear impulsive 5-wave movement from the 2022 lows:
Wave 1: $727B → $1.26T
Wave 2: Correction to $975B ($1T) (support confirmed)
Wave 3: Massive rally toward $2.72T
Wave 4: Pullback toward $1.69T (VWAP retest)
Wave 5: $3.73T ATH
What does this imply?
According to classical Elliott Wave theory, after a full 5-wave move, the market tends to enter an corrective phase.
🔍 Some key levels to watch:
$3T: Historical S/R (was the 2021 top, now acting as a key level)
$2.31T: Recent swing low
$2T: Psychological and structural support
📌 Zone of Interest for Longs: $2.31T–$2T
This zone holds:
Previous consolidation zone from mid-2024
Fib retracement confluence
Likely forming Wave C bottom if this is a full ABC
🎯 Upside Targets — What If We Continue Higher?
Looking ahead:
🔸 1.618–1.666 Fib Extension = $4.42T–$4.53T
🔸 1.618 TBFE from previous cycle = ~$5.45T
📌 Rounded Targets: $4.5T, $5T and $5.5T
These are the next likely macro cycle targets — but only after a healthy correction and consolidation.
☀️ Macro Context & Summer Seasonality
Historically, summer tends to be a weaker period:
Lower volume
Institutional rebalancing
Geopolitical and macroeconomic uncertainty
📚 Educational Insight: TOTALCAP as a Tool
Treat TOTALCAP like the S&P500 of crypto.
Use round trillions as psychological levels: 1T, 2T, 3T, etc.
Always check if BTC’s price is aligned with where TOTALCAP is on the macro structure
Helps judge market strength even when BTC dominance is shifting
It’s especially useful when altcoins pump or dump out of sync with BTC — you can use TOTALCAP to track the real flow of money.
💡 Final Thoughts
We are likely in a corrective phase after a complete 5-wave cycle.
The area between $2.31T and $2T offers high-probability long entries
Watching how TOTALCAP reacts to these levels will help us anticipate the broader market’s next move
Summer slowdown could mean chop — but this also creates opportunities
💬 Let me know your thoughts: Are we entering a deeper correction? Or will TOTALCAP surprise us with a new leg higher?
Don’t forget to zoom out. The charts always tell the story.
_________________________________
💬 If you found this helpful, drop a like and comment!
Want breakdowns of other charts? Leave your requests below.

Uber: Upward Momentum ExpectedUber attempted to counter recent sell-offs with an upward move; however, downward pressure quickly resumed. We must still consider a 35% chance that the turquoise wave alt.3 has already concluded, which would imply direct declines below support at $77.57 during wave alt.4 . In this scenario, long entry opportunities could emerge within our alternative turquoise Target Zone between $65.94 and $57.24. Primarily, the regular wave 3 should reach its peak well above the $94.10 mark, and wave 4 would start later.
📈 Over 190 precise analyses, clear entry points, and defined Target Zones - that's what we do.

₿itcoin: Directly or with a Detour?!Under our primary scenario, Bitcoin remains on track to climb into the upper blue Target Zone between $117,553 and $130,891 during green wave B. The key question at this stage: will the crypto giant head straight for the zone – or take a detour below the $100,000 level first? Either path remains structurally consistent with the broader outlook. Once wave B concludes, we expect a pullback to unfold in wave C, with the low of that move – and the bottom of orange wave a – anticipated in the lower blue Target Zone between $62,395 and $51,323. From there, orange wave b should initiate a corrective rally, likely rebounding toward the $100,000 mark. This would set the stage for the final leg down in blue wave (ii). Meanwhile, our alternative scenario remains intact on the 8-hour chart. This 30% likely scenario suggests Bitcoin is still advancing within blue wave alt.(i) , rather than correcting in wave (ii). A confirmed breakout above $130,891 would validate this outcome.
📈 Over 190 precise analyses, clear entry points, and defined Target Zones - that's what we do.

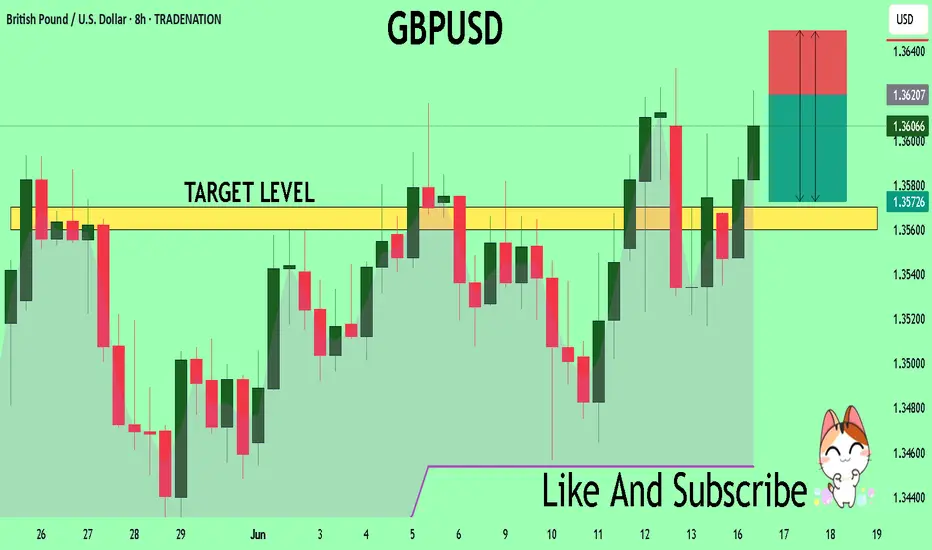
GBPUSD Will Collapse! SELL!
My dear friends,
Please, find my technical outlook for GBPUSD below:
The price is coiling around a solid key level - 1.3619
Bias - Bearish
Technical Indicators: Pivot Points Low anticipates a potential price reversal.
Super trend shows a clear sell, giving a perfect indicators' convergence.
Goal - 1.3570
Safe Stop Loss - 1.3649
About Used Indicators:
The pivot point itself is simply the average of the high, low and closing prices from the previous trading day.
Disclosure: I am part of Trade Nation's Influencer program and receive a monthly fee for using their TradingView charts in my analysis.
———————————
WISH YOU ALL LUCK
EURCAD Set To Fall! SELL!
My dear subscribers,
This is my opinion on the EURCAD next move:
The instrument tests an important psychological level 1.5718
Bias - Bearish
Technical Indicators: Supper Trend gives a precise Bearish signal, while Pivot Point HL predicts price changes and potential reversals in the market.
Target - 1.5674
My Stop Loss - 1.5743
About Used Indicators:
On the subsequent day, trading above the pivot point is thought to indicate ongoing bullish sentiment, while trading below the pivot point indicates bearish sentiment.
Disclosure: I am part of Trade Nation's Influencer program and receive a monthly fee for using their TradingView charts in my analysis.
———————————
WISH YOU ALL LUCK

XAUUSD LongArea approached a level previous mitigated range, It took sellside liquidity aggressively which presents a strong move
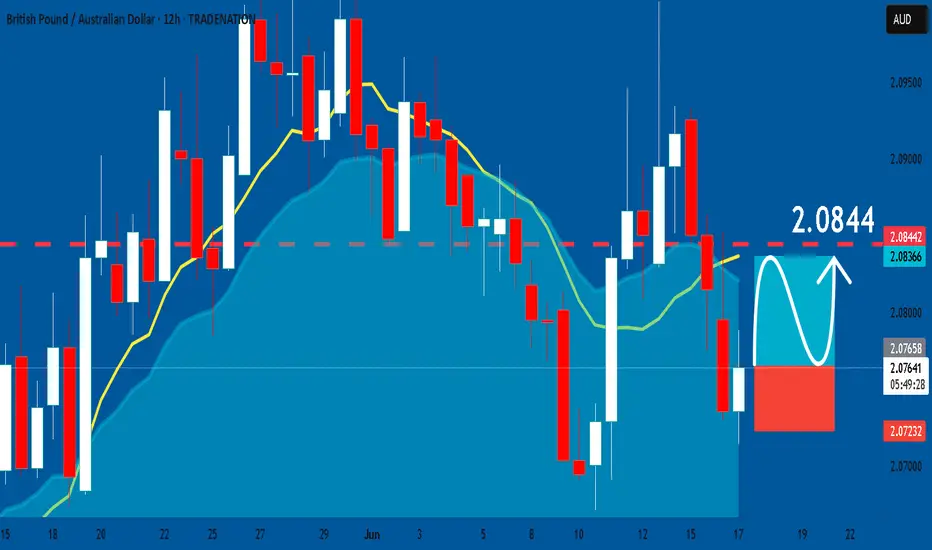
GBPAUD: Bullish Continuation & Long Trade
GBPAUD
- Classic bullish formation
- Our team expects growth
SUGGESTED TRADE:
Swing Trade
Buy GBPAUD
Entry Level - 2.0766
Sl - 2.0723
Tp - 2.0844
Our Risk - 1%
Start protection of your profits from lower levels
Disclosure: I am part of Trade Nation's Influencer program and receive a monthly fee for using their TradingView charts in my analysis.
❤️ Please, support our work with like & comment! ❤️
SSOM LONG TRADE 17-06-2025SSOM Long Trade
Rationale: SSOM previously surged from Rs. 87 to Rs. 900 (over 10x gain) from mid-March to mid-May. Despite recent correction/consolidation, price action suggests potential for further upside.
🚨 TECHNICAL BUY CALL – SSOM🚨
- Buy 1: Current level (Rs. 775)
- Buy 2: Rs. 782
- Buy 3: Rs. 762
- TP 1: Rs. 830
- TP 2: Rs. 880
- TP 3: Rs. 922
- TP 4: Rs. 970
Stop Loss - Below Rs. 725
Risk-Reward Ratio - 1: 4.83
Caution: Close at least 50% position size at TP1 and then trail SL to avoid losing incurred profits in case of unforeseen market conditions.
PLEASE BOOST AND SHARE THE IDEA IF YOU FIND IT HELPFUL.
