GOLD Will Go Higher From Support! Buy!
Take a look at our analysis for GOLD.
Time Frame: 9h
Current Trend: Bullish
Sentiment: Oversold (based on 7-period RSI)
Forecast: Bullish
The market is testing a major horizontal structure 3,395.19.
Taking into consideration the structure & trend analysis, I believe that the market will reach 3,467.28 level soon.
P.S
Overbought describes a period of time where there has been a significant and consistent upward move in price over a period of time without much pullback.
Disclosure: I am part of Trade Nation's Influencer program and receive a monthly fee for using their TradingView charts in my analysis.
Like and subscribe and comment my ideas if you enjoy them!
Wave Analysis

AUDUSD Will Go Up From Support! Long!
Please, check our technical outlook for AUDUSD.
Time Frame: 2h
Current Trend: Bullish
Sentiment: Oversold (based on 7-period RSI)
Forecast: Bullish
The market is approaching a key horizontal level 0.653.
Considering the today's price action, probabilities will be high to see a movement to 0.657.
P.S
Please, note that an oversold/overbought condition can last for a long time, and therefore being oversold/overbought doesn't mean a price rally will come soon, or at all.
Disclosure: I am part of Trade Nation's Influencer program and receive a monthly fee for using their TradingView charts in my analysis.
Like and subscribe and comment my ideas if you enjoy them!

AUDJPY Will Go Higher! Buy!
Here is our detailed technical review for AUDJPY.
Time Frame: 6h
Current Trend: Bullish
Sentiment: Oversold (based on 7-period RSI)
Forecast: Bullish
The market is approaching a significant support area 94.496.
The underlined horizontal cluster clearly indicates a highly probable bullish movement with target 95.595 level.
P.S
The term oversold refers to a condition where an asset has traded lower in price and has the potential for a price bounce.
Overbought refers to market scenarios where the instrument is traded considerably higher than its fair value. Overvaluation is caused by market sentiments when there is positive news.
Disclosure: I am part of Trade Nation's Influencer program and receive a monthly fee for using their TradingView charts in my analysis.
Like and subscribe and comment my ideas if you enjoy them!

GBPAUD Will Go Up! Long!
Take a look at our analysis for GBPAUD.
Time Frame: 2h
Current Trend: Bullish
Sentiment: Oversold (based on 7-period RSI)
Forecast: Bullish
The market is on a crucial zone of demand 2.074.
The oversold market condition in a combination with key structure gives us a relatively strong bullish signal with goal 2.083 level.
P.S
We determine oversold/overbought condition with RSI indicator.
When it drops below 30 - the market is considered to be oversold.
When it bounces above 70 - the market is considered to be overbought.
Disclosure: I am part of Trade Nation's Influencer program and receive a monthly fee for using their TradingView charts in my analysis.
Like and subscribe and comment my ideas if you enjoy them!

USDJPY Swing trade Signal for the Sell Once in a while we like to give a free signal. So here is one of the many trades we will have running for our subscribers.
Wait for the 1 hour candle to close below the Entry, and then a response to our entry, then you can sell.
Remember the rules, and remember your risk/reward
USDJPY Sell
🦇Entry: 143.525
⚠️Sl: 145.036
✔️TP1: 142.153
✔️TP2: 140.346
✔️TP3: 138.109
Happy trading. Any problems feel free to contact me, as over 10 years as a professional trader I can assure you there is no such thing as a stupid question.
Best,
Sarah

Weekly trading plan for XRP BINANCE:XRPUSDT Price has reached the weekly pivot point, so now it is important to understand the further reaction. Several trend lines can be seen on the chart. If the lower trend line and the level of 2.18 are broken, the price will probably continue its downward movement to the support zone, but it will already renew the local bottom.
Write a comment with your coins & hit the like button and I will make an analysis for you
The author's opinion may differ from yours,
Consider your risks.
Wish you successful trades ! mura

GBP/JPY Rejection – Bearish Move ExpectedChart Description (GBP/JPY – 1H Timeframe):
This GBP/JPY chart shows a strong resistance level around 196.566–196.693, where the price has been rejected multiple times (marked by the red arrow). After testing this resistance zone, the price is expected to drop.
The chart suggests a sell setup:
Entry: Near resistance zone (196.566)
Target: Around 193.766 (marked with yellow dotted line)
Stop-loss: Above the resistance at 196.710
The black arrows indicate the expected bearish move from resistance down to support.
Summary:
Price is rejecting a major resistance. Expecting a drop towards 193.766 — possible short opportunity.

SILVER BEARISH BIAS RIGHT NOW| SHORT
SILVER SIGNAL
Trade Direction: short
Entry Level: 3,714.4
Target Level: 3,384.5
Stop Loss: 3,933.3
RISK PROFILE
Risk level: medium
Suggested risk: 1%
Timeframe: 1D
Disclosure: I am part of Trade Nation's Influencer program and receive a monthly fee for using their TradingView charts in my analysis.
✅LIKE AND COMMENT MY IDEAS✅

GBP/USD BEARS ARE STRONG HERE|SHORT
Hello, Friends!
We are going short on the GBP/USD with the target of 1.344 level, because the pair is overbought and will soon hit the resistance line above. We deduced the overbought condition from the price being near to the upper BB band. However, we should use low risk here because the 1W TF is green and gives us a counter-signal.
Disclosure: I am part of Trade Nation's Influencer program and receive a monthly fee for using their TradingView charts in my analysis.
✅LIKE AND COMMENT MY IDEAS✅

EUR/USD SHORT FROM RESISTANCE
Hello, Friends!
We are now examining the EUR/USD pair and we can see that the pair is going up locally while also being in a uptrend on the 1W TF. But there is also a powerful signal from the BB upper band being nearby, indicating that the pair is overbought so we can go short from the resistance line above and a target at 1.143 level.
Disclosure: I am part of Trade Nation's Influencer program and receive a monthly fee for using their TradingView charts in my analysis.
✅LIKE AND COMMENT MY IDEAS✅

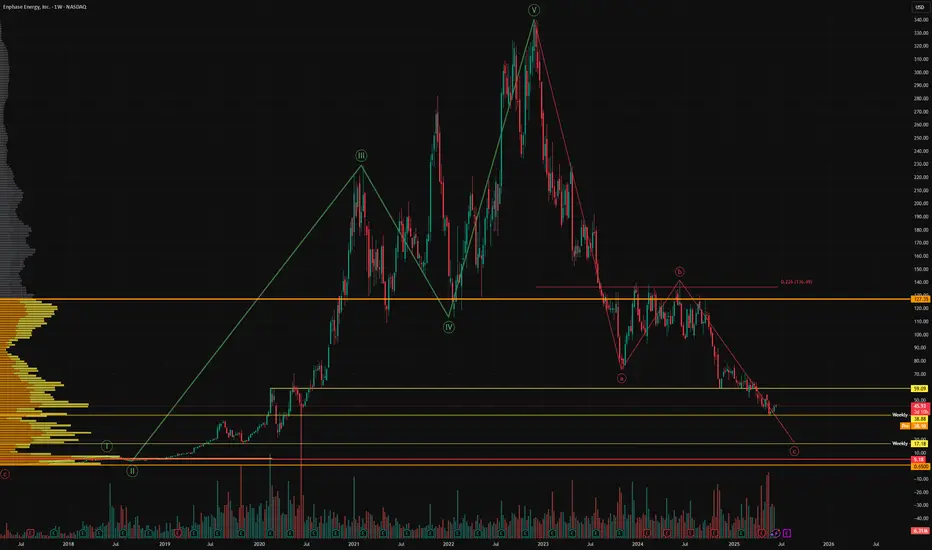
The last leg down?Enphase is holding on for it's life here, if support is lost then we could be heading towards my final target of $17-20. This stock has been a disaster. We had a 5 wave move up, then an abc correction. We are still in the final leg of wave c, nobody knows where it will end.
I have kept an eye on the stock, i'm certainly not trying to be too smart catching this falling knife. The downtrend was compounded last night by the news I was long anticipating - the administration is withdrawing tax credits for the industry.
Whilst this indeed a highly volatile stock that shows no strength of reversing trend, I may swing trade this stock once the sellers are exhausted. There is a need for energy in the AI era, solar will not disappear and this maximum fear scenario may soon present an opportunity.
Not financial advice, do what's best for you.
BRENT - UniverseMetta - Signal#BRENT - UniverseMetta - Signal
H4 - Breakout of the trend line + formation of ABC structure in continuation of the uptrend. It is better to reduce risks. Stop behind the minimum of wave C.
Entry: 74.929
TP: 78.405 - 83.274 - 86.179 - 91.207
Stop: 70.314

USDCHF - Bearish => Bullish => Now Bearish?Hello TradingView Family / Fellow Traders. This is Richard, also known as theSignalyst.
📈USDCHF has been overall bearish trading within the falling channel marked in orange. And it is currently retesting the upper bound of the channel.
Moreover, the green zone is a strong resistance.
🏹 Thus, the highlighted red circle is a strong area to look for sell setups as it is the intersection of the upper orange trendline and resistance.
📚 As per my trading style:
As #USDCHF approaches the red circle zone, I will be looking for bearish reversal setups (like a double top pattern, trendline break , and so on...)
📚 Always follow your trading plan regarding entry, risk management, and trade management.
Good luck!
All Strategies Are Good; If Managed Properly!
~Rich
Disclosure: I am part of Trade Nation's Influencer program and receive a monthly fee for using their TradingView charts in my analysis.

USDJPY - UniverseMetta - Signal#USDJPY - UniverseMetta - Signal
D1 - Formation of a triangular structure + the price is at the upper border.
H4 - It is better to wait for the trend line to break through. It is better to reduce risks if we consider entering at the market. Stop behind the maximum of wave D.
Entry: 144.367 - *144.705
TP: 143.402 - 142.094 - 140.023 - 138.706
Stop: 145.473

Weekly trading plan for SolanaBINANCE:SOLUSDT The price is already below the weekly pivot point. After updating the last bottom, the price may continue its downward movement. There are some level crossings so it is possible to reach them. More details in the video idea
Write a comment with your coins & hit the like button and I will make an analysis for you
The author's opinion may differ from yours,
Consider your risks.
Wish you successful trades ! mura

accumulation phase if breakout will create new 52highConsolidation above 9ema and already bounched from 26ema

Cardano and Diametric Pattern
We are currently in wave-g of the Diamond Diametric and it could continue to 0.43.
After the completion of the Diametric, if the Double Combination pattern does not form, we expect an uptrend to form. (The post-pattern movement will show us whether the Diametric has completed or not).
Good luck
NEoWave Chart

Bitcoin Multiframe: Key clusters to watch before FOMC__________________________________________________________________________________
Technical Overview – Summary Points
__________________________________________________________________________________
Momentum: Dominant bullish structure across all major timeframes (MTFTI = Up).
Supports/Resistances: No HTF pivot engaged; key on-chain support at $97.6k, resistance at $115.4k.
Volume: Central oscillation within range; no major surges observed, consolidation on micro-TF.
Multi-timeframe behaviors: Bullish structure dominates, technical pullback on 4H-1H-15min without major breaks.
__________________________________________________________________________________
Strategic Summary
__________________________________________________________________________________
Overall Bias: Structurally bullish as long as key supports hold (97.6k–104.5k zone).
Opportunities: Buy confirmed dips on on-chain cluster/H4-H2 area, target 110–115k extension post-FOMC positive catalyst.
Risk zones: Extreme volatility expected around FOMC (June 17–18); strict risk management, avoid overexposure.
Macro catalysts: FOMC (rate decision, dot plot), Fed leadership stability, Israel-Iran geopolitical tensions.
Action plan: Patience until FOMC; favor setups on clear price reaction, tight stops below 97.5k (on-chain support).
__________________________________________________________________________________
Multi-Timeframe Analysis
__________________________________________________________________________________
1D: Bullish momentum, price at range center ($106k). Watch for pivot break.
12H: Persistent bullish bias, confluence with 1D.
6H: Expected consolidation, bullish structure.
4H: Technical pullback, bullish structure remains. Key anticipated support 105k–104.5k.
2H: Likely move towards lower range. Up bias confirmed.
1H: Technical correction within overall Up trend.
30min/15min: Seller sequence, trend intact, no major break.
Risk On / Risk Off Indicator remains “Up” across all frames, boosting the positive view despite short-term correction.
Executive summary:
Strong bullish convergence from Daily → 15min timeframes.
Ongoing short-term pullback, no HTF pivot breaks.
Any break below $97.6k would invalidate the swing bullish scenario.
__________________________________________________________________________________
Macro, Economic Calendar, On-chain & Risk Management
__________________________________________________________________________________
Macro:
FOMC imminent (June 17–18): waiting – volatility on rate/dot plot.
Geopolitical risk (Iran-Israel): sustained global risk-off may escalate.
BTC shows strong resilience at 106k.
Economic calendar (key points):
June 17–18: FOMC — maximum impact (stocks, FX, crypto)
June 17: Fed leadership rumors — potential volatility, BTC stable
June 17, 08:30 UTC: USA — retail sales (May/core)
On-chain:
Key support at $97.6k (STH cost basis), resistance at $115.4k.
Long-term holders are distributing, but bullish accumulation pressure intact.
Clustering may amplify short-term directional moves.
Key scenarios:
Bullish: Extension to 110–115k if FOMC positive, stop below 97.6k.
Bearish: Break of 97.6k = risk of drop towards 92.9–95.4k.
Management: Avoid exposure pre-FOMC, active monitoring, strict stops.
Patience & discipline: Only size up with post-FOMC validated reaction or confirmed breakout. On-chain cluster = invalidation radar for bullish bias.
__________________________________________________________________________________

Oil Surges on Israel-Iran Nuclear Strike Fears🛢️ Israel’s attacks on Iran’s nuclear sites are pushing oil ( BLACKBULL:WTI , BLACKBULL:BRENT ) higher!
Bloomberg reports Trump’s G-7 exit and Tehran evacuation warning as Israel-Iran strikes intensify (June 17, 2025). Analysts warn of Strait of Hormuz risks, with 17M barrels/day at stake.
4H Chart Analysis:
Price Action: WTI ( BLACKBULL:WTI ) broke $75 resistance (June 2025 high), exiting a 3-week range. Brent ( BLACKBULL:BRENT ) mirrors at $78.
Volume: 4H volume spiked 15% vs. prior week, confirming breakout buying.
Key Levels:
Current Support: $75 (WTI), $78 (Brent) – former resistance, now support.
Next Support: $73 (WTI), $76 (Brent) – prior range lows, tested twice in June.
Context: Oil gained 2% this week, driven by Middle East supply fears, with WTI at a 1-month high.
Trading Insight: The $75/$78 breakouts signal bullish momentum. $73-$76 is a key support zone for dips. Watch Iran retaliation news and volume for supply disruption clues.
What’s your 4H oil trade? Post your setups! 👇 #OilPrice #WTI #Brent #IsraelIran #TradingView

ETHUSD, BTCUSD & Nasdaq Daily Trade SetupsIn this update we review the recent price action in Ethereum, Bitcoin and Nasdaq futures contracts and identify the next high-probability trade setups and price objectives to target. To review today's video analysis, click here!

Geopolitical Tensions & Technical Pattern Point to BTC Decline!Bitcoin ( BINANCE:BTCUSDT ) fell about -5% after tensions between Israel and Iran escalated. Unfortunately , these tensions are still escalating, but Bitcoin has managed to recover about +3% so far.
Bitcoin is moving near the Resistance zone($107,120-$105,330) and Cumulative Short Liquidation Leverage .
In terms of Elliott Wave theory , it seems that Bitcoin is completing a corrective wave . The corrective wave structure could be Contracting Triangle . In case of a sharp decline in Bitcoin again, we can consider these waves as five descending waves (if Bitcoin does NOT touch $106,600 ).
I expect Bitcoin to start declining again and at least drop to the Support zone($107,120-$105,330 ). The second Target could be the Support line and Cumulative Long Liquidation Leverage .
Note: If Bitcoin can break the Resistance zone($107,120-$105,330), we can expect further increases in Bitcoin.
Please respect each other's ideas and express them politely if you agree or disagree.
Bitcoin Analyze (BTCUSDT), 1-hour time frame.
Be sure to follow the updated ideas.
Do not forget to put a Stop loss for your positions (For every position you want to open).
Please follow your strategy and updates; this is just my Idea, and I will gladly see your ideas in this post.
Please do not forget the ✅' like '✅ button 🙏😊 & Share it with your friends; thanks, and Trade safe.

Nasdaq has topped?Both charts and political situation of the globe is not good for risky assets.. Nasdaq bubble is about to pop..

BTCUSDTHi . after a crash market because of war , we can get big gain of this chance , MA 100 in 1h can hold and Reverse move to 110300$ . #BTC LONG Limit buy : 105800$ , Lev : 100x , SL : 105500$ , Target : 110300$
