Gold Rebounds on Safe-Haven Flows – Is the Uptrend Back?Gold attracted some dip-buying interest during Tuesday’s trading session, reversing part of the previous day’s losses as rising geopolitical tensions reignited demand for safe-haven assets.
The market is increasingly pricing in the expectation that the Federal Reserve will begin a rate-cutting cycle in September — a scenario that favors non-yielding assets like gold. However, a modest recovery in the U.S. dollar could act as a headwind in the short term.
If conditions align, XAUUSD may capitalize on its recent upward momentum to resume the broader bullish trend, especially after completing a healthy pullback near the 0.618 Fibonacci retracement — in line with Dow Theory continuation.
Wave Analysis

EUR/USD Poised for a Breakout? Watch 1.1510 CloselyEUR/USD is currently consolidating around the 1.1510 support zone after a mild pullback from the descending trendline. Price structure remains bullish, with a wedge pattern forming — signaling that a breakout could be imminent.
On the news front, expectations that the Fed may soon begin cutting rates — following a series of weak U.S. economic data — are weighing on the U.S. dollar. At the same time, easing geopolitical tensions are shifting market sentiment back toward risk assets.
If the 1.1510 support level holds firm, EUR/USD may stage a strong rebound to resume its upward momentum.

Long on OIL amid Israel-Iran confilctFundamental trends:
Israel-Iran conflict does not seem to end soon, Israel might target iranian facilities more
Recent insights suggest US involvement which whould lead to oil price rising.
Technical trends:
Plot seems to develope an Elliot impulse wave with clear 1-3rd waves already built. This suggests the impulse wave must end with rising on 5th wave.
Conclution
Overall trends tell in favor of future oil prices rising.
What do you think about the situation? Please, leave your comments

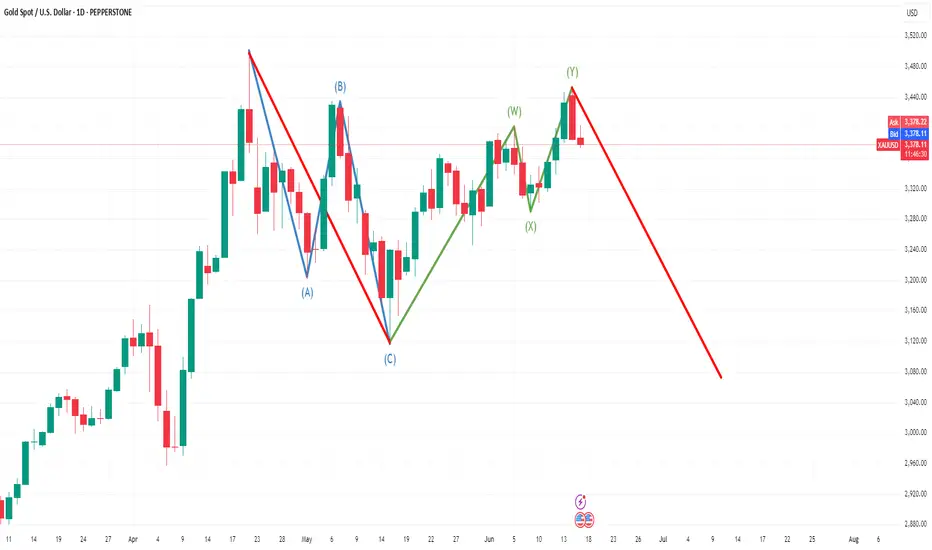
XAU/USD – Bearish Setup Developing After Complex CorrectionGold may be nearing the end of a complex double three (W)-(X)-(Y) corrective pattern, suggesting that the recent upside momentum could be exhausted and a larger degree bearish wave may be on the horizon.
🔹 Wave Structure Analysis
The initial decline completed an ABC Zigzag correction, labeled as Wave (A)-(B)-(C).
Price then rallied into a W-X-Y double three structure, with the second leg (Y) potentially complete as of the latest high.
The rejection at the recent swing high indicates potential distribution and the start of a new impulsive decline.
🔻 Bearish Outlook
If the count is valid, Gold may be starting a new bearish sequence, targeting lower support levels in the coming weeks.
A break below the short-term support (~$3,340–$3,320) could confirm the onset of a downward move.
Key bearish target zone: $3,120–$3,040, with potential extension toward $2,960 if momentum accelerates.
🛑 Invalidation Level
A daily close above Wave (Y) high (~$3,513) would invalidate the bearish thesis and indicate further upside continuation or a new impulsive structure.
📌 Conclusion:
Gold may have completed a complex corrective structure and is showing signs of weakness. If confirmed, this opens the door for a deeper corrective or impulsive move to the downside. Traders should watch for breakdown confirmation before entering shorts, with tight risk control above recent highs.
XAU/USD Bullish Setup Confirmed After Wave C CompletionXAU/USD has completed a classic five-wave impulsive structure to the upside, followed by a clear ABC corrective phase. The price action shows that wave (5) has topped, and the market has since retraced through a three-wave ABC correction inside a well-defined descending channel.
Currently, wave C appears to have found support right at the lower trendline of the broader ascending structure, signaling a potential completion of the correction and the beginning of a new bullish impulse.
The reaction from this level is strong, suggesting that buyers are stepping in to drive the next leg higher
Wave Count: 5-wave impulse up, followed by ABC correction
Structure: Wave C completed at key channel support
Momentum: Bullish recovery expected if price holds above recent swing low
T1: 3332.268
T2: 3354.078
SL: 3289.400

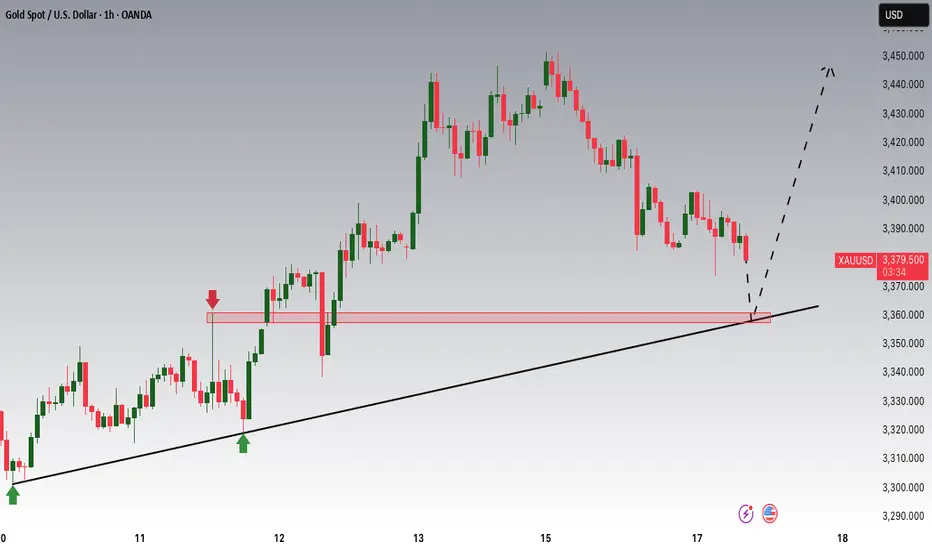
Gold is Nearing an Important Support!!Hey Traders, in today's trading session we are monitoring XAUUSD for a buying opportunity around 3,360 zone, Gold is trading in an uptrend and currently is in a correction phase in which it is approaching the trend at 3,360 support and resistance area.
Trade safe, Joe.
USDCAD Bearish Bias: Beware Liquidity Traps & Reversal Risks.I'm currently keeping a close eye on USDCAD, which has been in a strong bearish trend. 📉
In this video, I explain how the market is unfolding across both the higher and lower timeframes, and why it’s critical to watch them in conjunction. On the lower timeframes, we often see a clean sequence of lower highs and lower lows, as the algos set up a seemingly a smooth trend. But traders should be cautious ⚠️
Why? Because on the higher timeframes, the market can easily pull back, triggering a liquidity hunt. This is often when the algorithm targets stop orders above recent highs, before resuming the trend 🧠💥
While my bias remains bearish, I'm also aware of the risk that the market could shift gears unexpectedly to run stops and shake out weak hands. This concept is fully broken down in the video — with examples of how to spot these traps and prepare accordingly 🎯

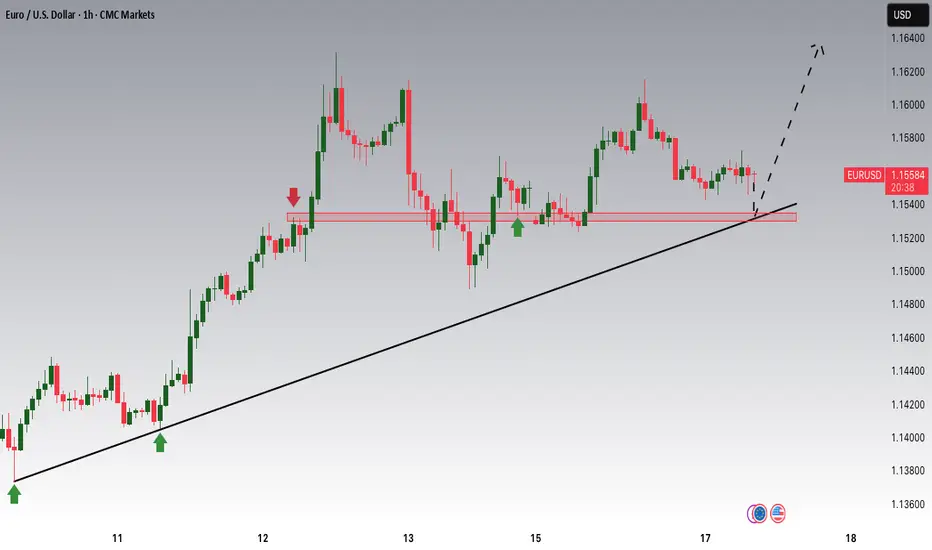
EURUSD Potential UpsidesHey Traders, in today's trading session we are monitoring EURUSD for a buying opportunity around 1.15300 zone, EURUSD is trading in an uptrend and currently is in a correction phase in which it is approaching the trend at 1.15300 support and resistance area.
Trade safe, Joe.
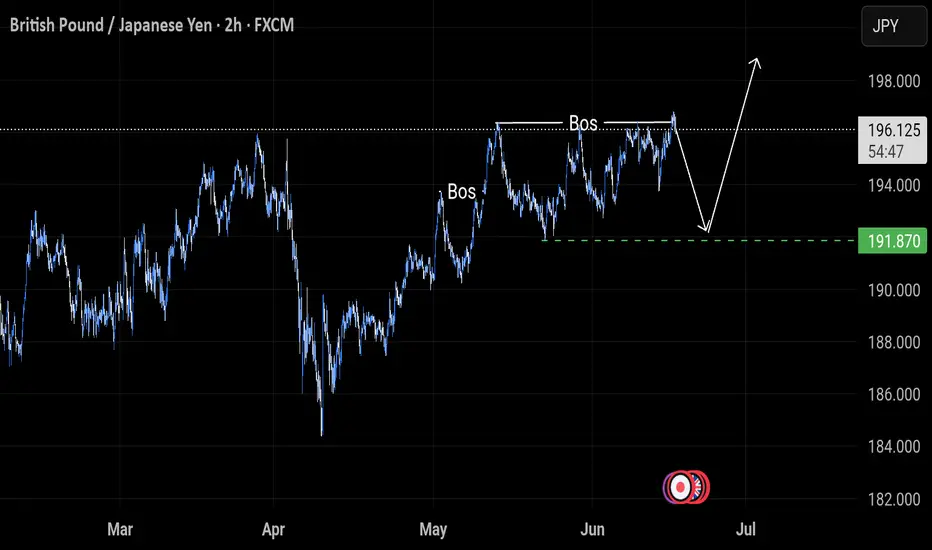
CHECK GBPJPY SIGNAL READ CAPTIONgbpjpy) BUY zone
(trade satup)
entry point (196.350) to (197.500) 📊
first target (196.800)📊
2nd target (197.065) 📊
last target (197.500) 📊
stop loss (196.055)❌

Bitcoin Pushed Crypto Market Into A Higher Degree CorrectionGood morning Crypto traders! Cryptos are coming lower and we can now see a five-wave drop on Bitcoin, which indicates for a deeper, higher degree correction, so Crypto TOTAL market cap chart may stay in consolidation within an ABC correction, which can retest 3.0T – 2.8T support zone before bulls return.
Bitcoin has impulsive characteristics on 4h time frame, and we can clearly see five waves up that can send the price even higher after a pullback. Now that it’s back to all-time highs, we can see it making a higher degree ABC correction, which can take some time, and it can retrace the price back to 97k-93k support zone before a bullish continuation.
However, we may now see a temporary corrective recovery in wave B, where some ALTcoins could still be doing well, if we consider that ALTcoin dominance may start kicking in. Yesterday we shared a chart of the ratio of TOTAL3(ALTcoins) market cap against Bitcoin with ticker TOTAL3ESBTC, which shows that ALTcoins may start outperforming BTC soon. It can be finishing final subwave C of (Y) of a correction in blue wave B which may cause a new strong rally into wave C that can bring the ALTseason similar as in the beginning of 2021.

USDJPY Poised for a BreakoutUSDJPY Poised for a Breakout
On the 4-hour chart, USDJPY is not yet taking a clear direction. The price is showing the possibility of both movements.
With the current data we can see that USDJPY is forming a triangle pattern and only the breakdown up or down will show the direction of the price.
However, I think the chances are higher for the bullish movement considering that the geopolitical tension in the Middle East is also very high and the USD remains one of the strongest currencies.
Bullish target: 147.90
Bearish target: 140.90
⚠️ Note: If the pattern transforms more than this triangle, then we may be in a different situation and everything may be invalid. The analysis may change over time.
You may find more details in the chart!
Thank you and Good Luck!
❤️PS: Please support with a like or comment if you find this analysis useful for your trading day❤️
Disclosure: I am part of Trade Nation's Influencer program and receive a monthly fee for using their TradingView charts in my analysis.

Gold XAUUSD Move 16 June 2025Market Structure:
The market isin a clear uptrend, forming higher highs and higher lows until a recent break of the ascending trendline, signaling a short-term structural weakness.
Current price is in a retracement phase, heading towards previous demand zones.
🔹 Zone 1 (3408–3414):
Confluence of:
Broken trendline retest (former support).
Minor order block / demand zone.
Overlapping price reaction area.
Risk: This zone may act as a liquidity inducement before price sweeps deeper into Zone 2.
Entry trigger: Bullish engulfing or LTF market structure shift on 1m/5m.
🔹 Zone 2 (3380–3384):
Stronger demand zone:
Aligned with previous accumulation base.
Larger imbalance (FVG-type area) and bullish impulsive origin.
More convincing for high-RR entries.
Higher probability: If Zone 1 fails or only wicks price, Zone 2 may provide the main entry opportunity.
Entry trigger: Shift in LTF structure with volume spike or breaker flip.
✅ Trade Signal Suggestions
🟦 Setup 1: Buy from Zone 1
Entry: 3410 (upon bullish confirmation)
SL: 3400 (below structure low)
TP: 3434 (prior high)
RR: ~2.4R
Note: Only take if price forms bullish structure (MSS or BOS) on lower timeframe.
🟦 Setup 2: Buy from Zone 2
Entry: 3380/3384 (upon confirmation)
SL: 3372 (below demand zone)
TP: 3411 or 3434 (scalp to intraday swing)
RR: ~1:3 or better
Note: Wait for clean rejection or reversal candle from this zone.
⚠️ Risk Management
Risk 0.5–1% per trade.
Use entry confirmation such as:
Bullish engulfing
Fair value gap reaction
Break of internal structure

NASDAQ 100 Bullish Breakout Potential: What to Watch NextI'm currently monitoring the NASDAQ 100 (NAS100) very closely. Building on yesterday’s outlook, we've now seen a clear bullish structural shift — price is holding firm above a recent higher high and higher low, suggesting the early stages of a potential trend continuation 📈
Zooming into the 30-minute chart, we can track price action more precisely. I’m watching for a decisive break above the current range high on this timeframe. If we get the break → retest → rejection pattern, this would confirm bullish momentum and provide a long opportunity 🚀
Should this scenario play out, we could also see JPY pairs strengthen to the upside, as a risk-on sentiment flows through the markets 🧭
🔍 This setup is developing — as always, patience and precision are key.

[SeoVereign] Bitcoin Bearish Outlook – June 17, 2025We are the SeoVereign Trading Team.
With sharp insight and precise analysis, we regularly share trading ideas on Bitcoin and other major assets—always guided by structure, sentiment, and momentum.
🔔 Follow us to never miss a market update.
🚀 Boosts provide strong motivation and drive to the SeoVereign team.
--------------------------------------------------------------------------------------------------------
Hello,
This is SeoVereign, approaching technical analysis not as a result but as a prediction, with a realistic perspective.
I am presenting a bearish view on Bitcoin as of June 17, 2025.
First, based on the fact that a downtrend appeared near the 0.786 level of the overall Fibonacci retracement, I believe strong downward pressure is forming, and thus I am outlining this bearish perspective.
This 0.786 level corresponds to around the 109,000 price range. On the chart, the 109,000–110,600 range is a very strong supply zone where support and resistance have repeatedly been confirmed.
Next, from a wave counting perspective, the 1.272 trend-based Fibonacci extension lies in a similar area as the 0.786 retracement level, which further reinforces my conviction in this view.
After successfully predicting the downward movement from the 11th, I have been continuously counting the recent upward wave, and the wave structure on the chart appears to align naturally, as I see it.
In addition, from a harmonic perspective, the Alt Bat pattern is functioning effectively, and since the movement has been captured within the pre-set X–1.13 range, the confirmation of this pattern can also be considered successful.
The first target is currently set around the 105,700 level.
I will continue to monitor the market closely, and once this idea progresses to a certain point, I will share more specific evidence and the thought process behind the bearish entry through an additional update.
Thank you.

XAUUSD: June 17 Market Analysis and StrategyGold technical analysis
Daily chart resistance 3450, support below 3355
4-hour chart resistance 3420, support below 3372
1-hour chart resistance 3403, support below 3375
The recent rise and fall of gold is completely controlled by market news. The next move of Israel and Iran directly affects the rise and fall of gold. It rises under the stimulation of the escalation of the situation and begins to pull back when the situation eases. The long and short positions form a short-term tug-of-war pattern, but the fundamentals have not changed. Gold is still in a bull market.
Today's rebound high is in the 3405/03 area. This position has formed a top and bottom conversion position. It is bound to have a certain suppressive effect on the rebound of gold prices. You can refer to the 3403/05 area for shorting during the day. Pay attention to the vicinity of 3370 below. If you hold this support level, you can buy short-term. The intraday volatility is not expected to be large, which is suitable for fast-in and fast-out transactions!
SELL: 3402near SL: 3407
BUY: 3370near SL: 3365

Ethereum: Is a Major Bullish Wave Coming?Ethereum: Is a Major Bullish Wave Coming?
Following our previous analysis, ETH dropped from $2,770 to $2,440, aligning with one of the anticipated price scenarios.
The support zone near $2,440 once again demonstrated its strength, pushing the price back up to $2,660. Given the strong accumulation pattern, the likelihood of a larger bullish wave is increasing.
A quick target for the current move stands near $2,800, and a breakout above the pattern could signal the start of the expected bullish trend, with the following key targets:
🎯 $3,300 🎯 $3,800 🎯 $4,500
You may find more details in the chart!
Thank you and Good Luck!
❤️PS: Please support with a like or comment if you find this analysis useful for your trading day❤️

#DYM/USDT#DYM
The price is moving within a descending channel on the 1-hour frame, adhering well to it, and is heading towards a strong breakout and retest.
We are experiencing a rebound from the lower boundary of the descending channel. This support is at 0.2552.
We are experiencing a downtrend on the RSI indicator, which is about to break and retest, supporting the upward trend.
We are heading towards stability above the 100 Moving Average.
Entry price: 0.2576
First target: 0.2642
Second target: 0.2714
Third target: 0.2808

GBPJPY OUTLOOK We're looking at a continuation trade to the upside for GBPJPY.
We wait for a pullback to our Fibonacci levels for a continuation to the upside.
Let's see what the market is going to do before the end of the week.
#SQT/USDT#SQT
The price is moving within a descending channel on the 1-hour frame, adhering well to it, and is heading towards a strong breakout and retest.
We are experiencing a rebound from the lower boundary of the descending channel. This support is at 0.001200.
We are experiencing a downtrend on the RSI indicator, which is about to be broken and retested, supporting the upward trend.
We are heading for stability above the 100 moving average.
Entry price: 0.001200
First target: 0.001214
Second target: 0.001230
Third target: 0.001252

GBPNZD TRADE UPDATE We're also clear to the downside on gbpnzd.
It's getting close to our profit target.
Proper trade management techniques should be applied

AAPL — Broadening Range and Accumulation Phase. Targeting $300Apple stock has been moving in a broadening pattern for an extended period, showing signs of accumulation. This price behavior suggests a potential bullish breakout. The upside target in the coming months is around $300, possibly by fall or winter. However, a corrective scenario remains on the table, with a potential pullback toward the $165–144 range, which could present a strong long entry opportunity. From a fundamental perspective, investor interest is likely to increase ahead of Apple’s expected product presentation in the fall, which historically supports bullish sentiment in the stock.

#PORTAL/USDT#PORTAL
The price is moving within a descending channel on the 1-hour frame, adhering well to it, and is heading for a strong breakout and retest.
We are experiencing a rebound from the lower boundary of the descending channel. This support is at 0.0347.
We are experiencing a downtrend on the RSI indicator, which is about to break and retest, supporting the upward trend.
We are heading for stability above the 100 Moving Average.
Entry price: 0.0355
First target: 0.0366
Second target: 0.0384
Third target: 0.0400

Nzdusd update We still await the pullback to our fib levels. Let's see how it unfolds in the coming market sessions
