#TAI/USDT#TAI
The price is moving within a descending channel on the 1-hour frame, adhering well to it, and is heading for a strong breakout and retest.
We are experiencing a rebound from the lower boundary of the descending channel. This support is at 0.090600.
We are experiencing a downtrend on the RSI indicator, which is about to break and retest, supporting the upward trend.
We are heading for stability above the 100 Moving Average.
Entry price: 0.09355
First target: 0.09900
Second target: 0.10380
Third target: 0.11000
Wave Analysis

GBP-NZD Rising Support Ahead! Buy!
Hello,Traders!
GBP-NZD keeps falling
Down but a rising support
Line is ahead and as the
Pair is locally oversold we
Will be expecting a rebound
And a move up after the
Retest of the support below
Sell!
Comment and subscribe to help us grow!
Check out other forecasts below too!
Disclosure: I am part of Trade Nation's Influencer program and receive a monthly fee for using their TradingView charts in my analysis.

#MYRIA/USDT#MYRIA
The price is moving within a descending channel on the 1-hour frame, adhering well to it, and is heading towards a strong breakout and retest.
We are experiencing a rebound from the lower boundary of the descending channel. This support is at 0.0013111.
We have a downtrend on the RSI indicator that is about to be broken and retested, supporting the upward trend.
We are in a trend of consolidation above the 100 moving average.
Entry price: 0.0013710
First target: 0.0014510
Second target: 0.0015333
Third target: 0.0016300

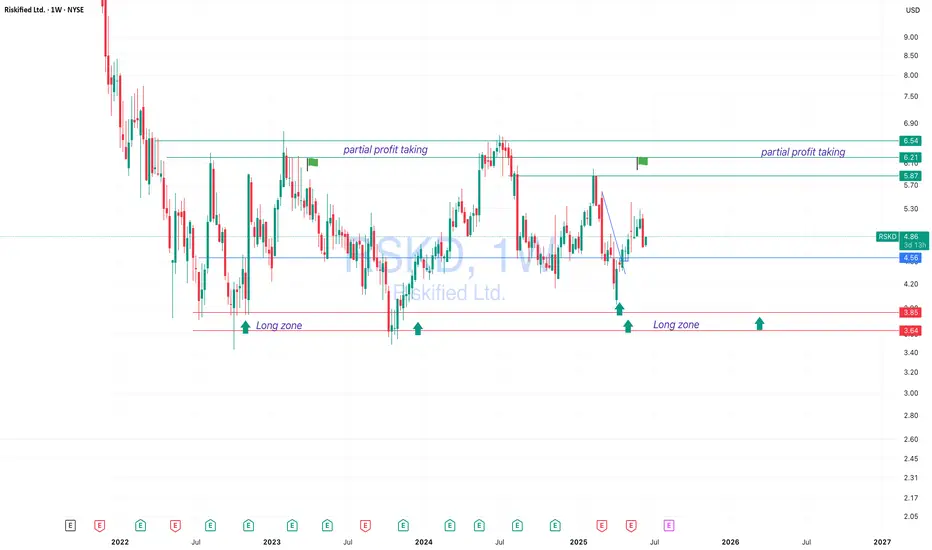
RSKD — 50–100% Return Potential Within a YearRiskified Ltd. (RSKD)
has been trading in a consistent long-term range, cycling between lows of 3.65–3.85 and highs of 6.20–6.54 approximately every 6 to 12 months.
This presents a swing opportunity with potential gains of up to 100%. We are currently mid-range and already in the trade, but as US indices show strength, additional buy setups may develop on retracements.
Fundamentally, investor interest in RSKD is supported by the growing demand for fraud prevention and identity verification solutions in e-commerce, client base expansion, and renewed attention to tech stocks during a potential sector recovery. Estimated holding time is 6–12 months.
USELESSThe fear that keeps us from winning is the tremendous rugs that happens everyday, i have seen this project since was launched and i am monitoring it everyday.
It is giving the sense that this little thing could follow Fartcoin.
Keep an eye on it, looks very promising.
I will post some good projects, as i have analyzed and i think so..
DYOR before invest

#MYRIA/USDT#MYRIA
The price is moving within a descending channel on the 1-hour frame, adhering well to it, and is on its way to breaking it strongly upwards and retesting it.
We are experiencing a rebound from the lower boundary of the descending channel. This support is at 0.0013200.
We are experiencing a downtrend on the RSI indicator, which is about to break and retest, supporting the upward movement.
We are in a trend of consolidation above the 100 moving average.
Entry price: 0.0014000
First target: 0.0014300
Second target: 0.0014975
Third target: 0.0015800

BTC Weekly BOX breakout or possible false breakoutWe have BTC setting up a nice weekly consolidation box, with candle closes consistently holding above the previous weekly ATH resistance. Multiple Doji closes indicate consolidation and compression. At the bottom of the box, we’ve seen strong reversals with high volume. The 4H chart is consistently defending the 200 EMA, supporting the idea that the daily trend remains strong — although direction is currently unclear.
Is distribution happening? It’s not easy to short just yet. We might still see a false breakout, position filling, and then a return to the box range. I’d be interested in a swing short if that happens — especially if the weekly candle closes with high volume and signals a reversal, indicating a potential bearish shift on the daily chart. Let’s keep in mind that June is historically weak, especially during the last two weeks.
On the long side, I’ll only be looking for entries after a daily break of structure (BOS).
Does not need to goes to the highs, we could drop below 100K if we lose box range low with a MSB.
Interesting days ahead — patience is key, as we currently don’t have many high-probability setups.

Gold Weekly Outlook – 17 June 2025Gold Weekly Outlook – 17 June 2025
Gold has been trading within a tight range over the past few weeks, repeatedly finding support along its upward trendline.
The ongoing conflict in the Middle East is expected to be a key driver for gold prices in the coming weeks.
Monday’s trading saw gold drop by over 700 pips amid escalating tensions in the region. This “flash crash” may well clear the path for bulls to regain control and push the yellow metal toward new all-time highs.
For now, we remain on the sidelines, waiting to see how price reacts around the 3,360 level, which could serve as a launchpad for a bullish reversal.

USD-CHF Bearish Bias! Sell!
Hello,Traders!
USD-CHF is trading in a
Downtrend and the pair
Is making a local bullish
Pullback but will soon
Hit a horizontal resistance
Level around 0.8185
So we are bearish biased
And we will be expecting
A further bearish move down
Sell!
Comment and subscribe to help us grow!
Check out other forecasts below too!
Disclosure: I am part of Trade Nation's Influencer program and receive a monthly fee for using their TradingView charts in my analysis.

XAUUSDAccording to geopolitical situations all around the world, the trend of XAU is very bullish, as it is visualized in the chart i expect that XAU price to make a new ATH and probably within 10 days to reach 3650-3700$
Due to uncertainty and the manipulation of the crypto market i have paused trading crypto till i would see that there is better trading conditions.
NFA
DYOR

BTC is still bearish (2H)This analysis is an update of the analysis you see in the "Related publications" section
The red zone seems to have had enough orders to reject the price downward. It is expected that the price will drop at least to the green zone below.
There will be some fluctuations along the way.
A daily candle closing above the invalidation level would invalidate this analysis.
For risk management, please don't forget stop loss and capital management
Comment if you have any questions
Thank You

XAUUSD H1 TIMEFRAMEgold is bullish and forming higher highs id it gives a pullback we can expected upside moves

Maple (SYRUP) Bullish Impulse, Final Target & Correction Support+553% since its 7-April bottom, but the third wave is already in. Notice how the volume is super high until 15-May but then it drops as prices continue higher. This means that only the fifth wave remains. After the completion of the fifth wave there should be a correction before additional growth.
The two main targets for this current bullish impulse are shown on the chart but it can go higher of course. A number came up around $1.23 but this chart is just too young.
Once the correction starts, the main support will be where the 1.618 Fib. extension is now. Can wick lower but the 0.786 isn't likely to be tested. Maple Finance SYRUP.
Namaste.

TAOUSDT - This can't belast year, I had an experience with a trader and he said that this was an impossible move.
look at this move prnt.sc
it is similar:
- the growth was
- the sideways has started
- now a fall is needed

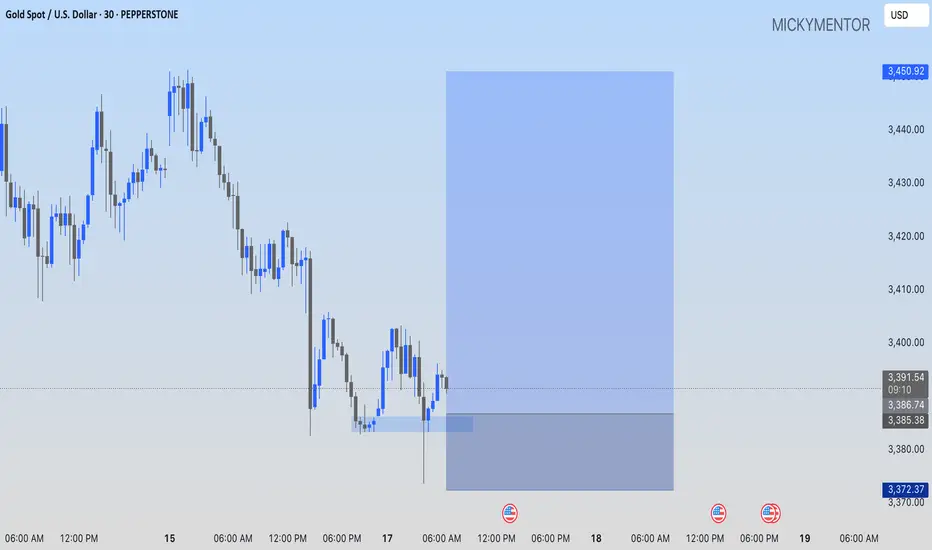
GOLD: A BUY OPPORTUNITY PEPPERSTONE:XAUUSD I'll long at 3386.74 price level while targeting the 3450.92 level.
PII Industries - Rectangular BreakoutNSE:PIIND is breaking out of Rectangle and you cna buy at this Point. 1st Target would be 4000 and Second Target would be 4070. If you are ready for Risk Reward, you can Target for 4300, with Trailing Stop loss.

BTC ANALYSIS (4H)Last week, Bitcoin made a sharp bullish move upward, aiming for retail liquidity, which made the forecast path more difficult.
The green zone is a support area where Bitcoin might react.
To collect the ATH liquidity, Bitcoin needs to break through the red zone.
Let’s see what happens | when the market direction isn’t clear, there’s no need to take unnecessary risks.
For risk management, please don't forget stop loss and capital management
Comment if you have any questions
Thank You

bitcoin is going nutssBitcoin has been pumping in the past few days pretty massively. Why? There are 2 main reasons - the first reason is that Bitcoin has finished a major WXY corrective wave, and the second is that Bitcoin swept liquidity below a triangle (see my previous post for details). That was a very good opportunity to buy/long Bitcoin at that specific level I described in the previous analysis. But let's focus on the present and future!
We always want to find strong levels on the charts so we have a great entry point/take profit target. The next strong level is definitely the 0.618 FIB, which Bitcoin can hit in the very short term. Also, below the 0.618 FIB, we have a strong horizontal zone, which can also act as a strong resistance. Bitcoin should definitely go there and retest this zone.
We want to see how Bitcoin is going to react in the zone and FIB, but you can create a new limit order to short Bitcoin there so you don't miss anything. So currently I am temporarily bullish on Bitcoin, and in the next update I will make a big analysis on Bitcoin and a very likely scenario for the next months. What will the price of Bitcoin be in December? Please like/boost my idea right now.
Write a comment with your altcoin + hit the like button, and I will make an analysis for you in response. Trading is not hard if you have a good coach! This is not a trade setup, as there is no stop-loss or profit target. I share my trades privately. Thank you, and I wish you successful trades!
7 days ago
Note
Bitcoin hit my profit target of 0.618 FIB and continues to the upside. It looks like we are going to hit 109,000 USD in the short term, which is a very strong resistance! Middle of the previous big range, so prepare for a bounce here.

DOGE ANALYSIS (12H)Based on the current available data, it appears that Dogecoin has entered a bullish phase after completing the diametric pattern marked on the chart. We are currently in wave B of this bullish phase.
Wave B may complete within the green zone, which is a key support area.
The targets for wave C have been marked on the chart.
A daily candle closing below the invalidation level would negate this outlook.
For risk management, please don't forget stop loss and capital management
Comment if you have any questions
Thank You

EURAUD Struggles at 1.7880—Signs of Exhaustion Signal Potential EURAUD Struggles at 1.7880—Signs of Exhaustion Signal Potential Downside
EURAUD has confirmed a strong resistance zone near 1.7880, as the price repeatedly failed to break higher. The four-hour candles indicate clear signs of bullish exhaustion, suggesting that further upside may be limited unless unexpected news shakes the market.
Without any significant developments to push the price above resistance, the pair is likely to face renewed selling pressure in the coming days.
Key downside targets to watch:
🔻 1.7700 🔻 1.7610 🔻 1.7510
You may find more details in the chart!
Thank you and Good Luck!
❤️PS: Please support with a like or comment if you find this analysis useful for your trading day❤️
Disclosure: I am part of Trade Nation's Influencer program and receive a monthly fee for using their TradingView charts in my analysis.

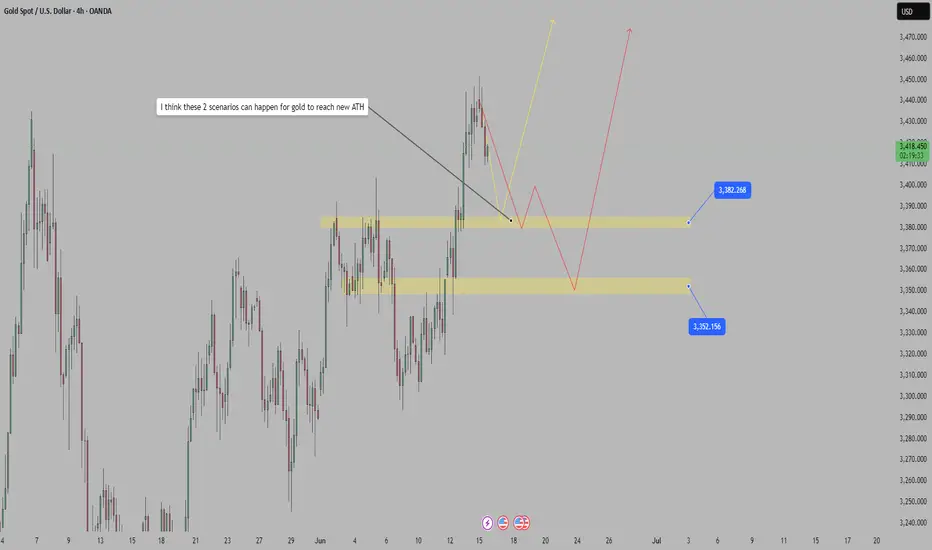
I think these 2 scenarios can happen for gold to reach new ATHGold supported by Israel-Iran conflict, US intervention in focus
Gold's sharp rise came late last week after Israel struck multiple targets in Iran, including Tehran's nuclear facilities.
The attack sparked fierce retaliation from Iran, which launched a barrage of missiles at key Israeli targets, including the financial capital Tel Aviv. Some of the Iranian missiles were also seen penetrating Israel's "Iron Dome" defense system.
What do you think?
Best regards, StarrOne !!!
GTLB reverses to increaseBased on wave analysis, the main support line and RSI indicator when the price is oversold below 40, it shows a very high possibility of GTLB reversing to increase.
The price now (Closed on 06.16.2025): $42.08.
Price target: $47.76/ $50.50.
Stop loss: $39.
!!! Important note for stoploss as price can return to fill gap $35.68 at any time.
IMO, amateur trader.

Month EUR/USDBase on my chart, Eur/Usd will head to at least 50% to 61.8% Fib of the HTF (Month)
Do not only look at 1H-4H. Right now 1H-4H is undirectional, we can look at HTF, we will understand while it heading toward bull side
Goodluck
