USD/JPY Drops as Market Awaits Powell's RemarksIn today’s trading session, the USD/JPY pair is showing renewed weakness, currently trading around 147.76 — down more than 0.68% from the previous session. The decline is driven by falling U.S. Treasury yields and cautious investor sentiment ahead of an upcoming speech by Federal Reserve Chair Jerome Powell, which is weighing on the U.S. dollar.
From a technical perspective, USD/JPY has broken its short-term uptrend and is approaching a key support level at 147.60. If this level fails to hold, the bearish momentum could extend further.
Wave Analysis

Latest Gold Price Update TodayHello everyone, what do you think about the price of gold today?
As the new week begins, gold continues the upward trend started at the end of Friday’s session. As of now, the precious metal is trading around 3356 USD, with the uptrend still being supported.
From a carefully analyzed technical perspective, gold successfully broke out of the downward channel, taking advantage of the weakening USD. The price increase is convincing in the short term, especially after testing and confirming the previous breakout as a new support zone (around 3345 USD).
The upward target is expected to continue, with key levels to watch being 3372 USD and the H4 resistance at 3390 USD.
What do you think about the price of gold today? Feel free to share your thoughts in the comments!
Good luck!

BLDE – VolanX Smart Cycle Activation📈 BLDE – VolanX Smart Cycle Activation
Timeframe: Weekly
Posted by: WaverVanir International LLC | VolanX Protocol
Model: Accumulation → Manipulation → Expansion
After multiple Breaks of Structure (BOS) and prolonged markdown, BLDE has now confirmed a Smart Money Accumulation Cycle. A clear manipulation sweep below prior lows has triggered the upside phase. This chart follows the classic SMC model with:
🔹 Accumulation → Trap → Manipulation → Expansion
🔍 Key Observations:
Accumulation zone: $2.00–$4.00
Trap high: ~$5.00 (liquidity run & rejection)
Clean reclaim of $3.92 structure now acting as launchpad
Next zones of interest:
• $6.35
• $6.58
• $6.76
• Ultimate distribution zone: $9.90
📊 VolanX Thesis:
We are entering a Mark-Up Phase consistent with the VolanX Alpha Expansion Model. As liquidity rotates upward, expect a stair-step climb toward the equilibrium zone near $9.90.
🧠 Strategic Insight:
If price pulls back into the $3.92–$4.10 range, that would be considered a high-probability re-entry for bulls aligned with institutional footprints.
🛡️ Risk Lens:
Monitor for early distribution at $6.76. VolanX Guardian Protocol flags rising volume anomalies in that range.

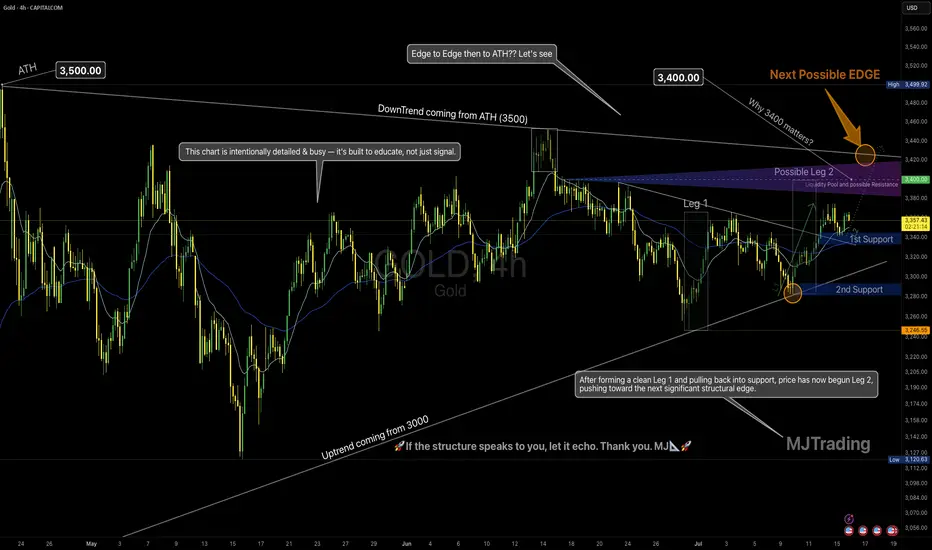
Leg 2 in Progress? | All Eyes on the Possible EDGE around 3400💡 GOLD 4H – MJTrading:
After forming a clean Leg 1 followed by a technical pullback into support, Gold has initiated Leg 2, pushing upward toward the next possible EDGE: 3400.
🟠 Why 3400 Matters
This zone is not just a round number:
It aligns with the long-term downtrend coming from the ATH (3500)
It’s the last reaction high before a deeper correction
There’s likely liquidity resting above — it’s where smart money may make decisions
This is where structure and psychology meet.
And end of 2 possible 2nd leg...
🔄 Possible Scenarios:
🟥 Scenario A – Rejection from the Edge (if could reach):
A reaction from this zone could lead to a pullback toward:
1st Support around 3340-3360
2nd Support near 3250 (also the uptrend line from 3000)
Use these zones to reassess momentum.
🟩 Scenario B – Breakout Above 3400:
A clean break above this structural edge opens the path for:
An “Edge to Edge” move back toward ATH (3500)
Possible higher timeframe trend shift — especially if retest holds
🧠 Our Strategy
We’re long-biased into the edge, not beyond it yet.
Let 3400 show its hand — we stay adaptive, not predictive.
🔍 This chart is intentionally detailed — it's built to educate, not just signal.
Focus on structure, sequence, and behavior — not just levels.
Lets Zoom in around the Breakout area...
And a Zoomout to Daily...
🧭 “If the structure speaks to you, let it echo.”
– MJTrading 🚀
📍#Gold #XAUUSD #TradingView #TechnicalAnalysis #ChartDesigner #MJTrading #MarketStructure #ForexIdeas #Edge
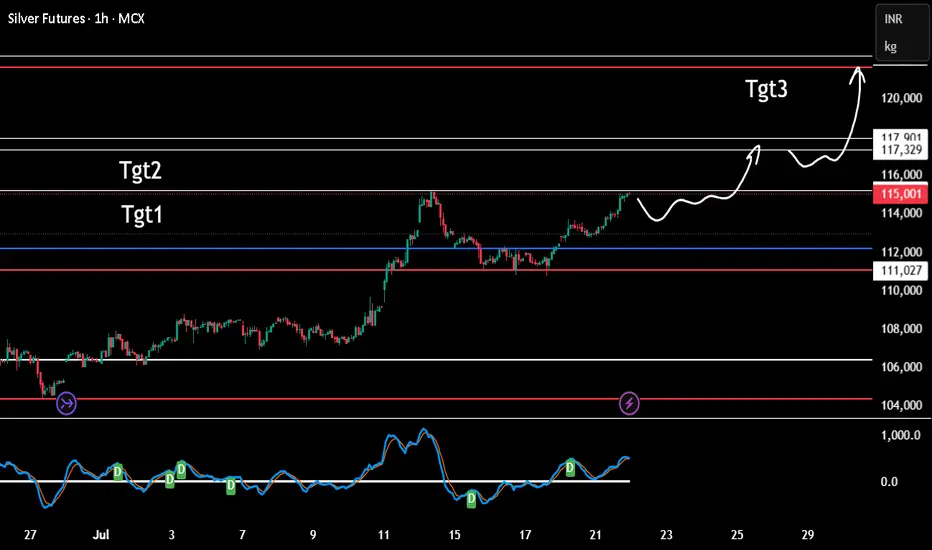
Silver expectationTgt 1 reached. A break out will take to tgt 2 and then tgt 3
Tgt1 is being tested second time, for good break out we need third re-test hence expecting some retracement before a a real break out. Anything above is a possible trap unless the momentum is fast and swift.
RIOT / 3hNASDAQ:RIOT may have completed the 3rd wave of Minor degree wave 3 at 15.34. Now, an expected correction in the 4th wave of Minor degree wave 3 may have started to develop sideways.
#CryptoStocks #RIOT #BTCMining #Bitcoin #BTC
NASDAQ:RIOT CRYPTOCAP:BTC MARKETSCOM:BITCOIN BITSTAMP:BTCUSD
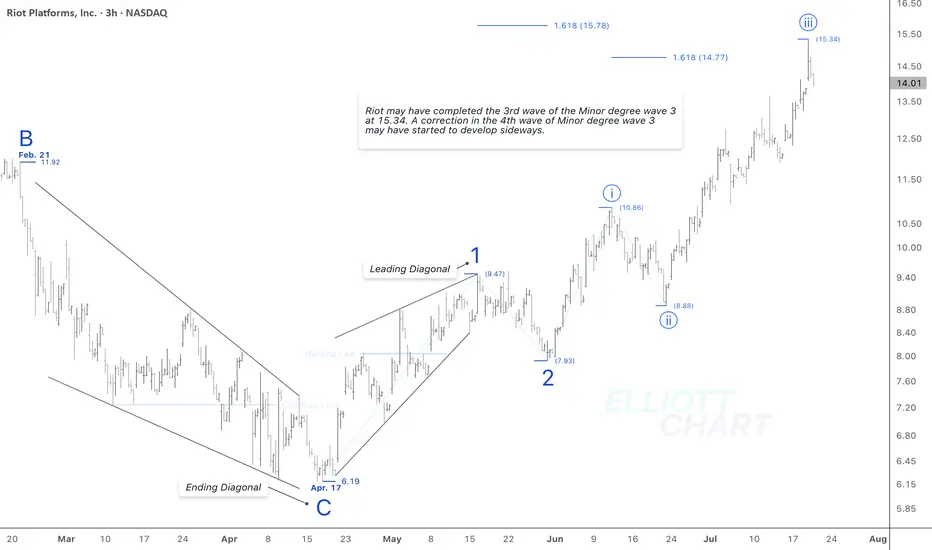
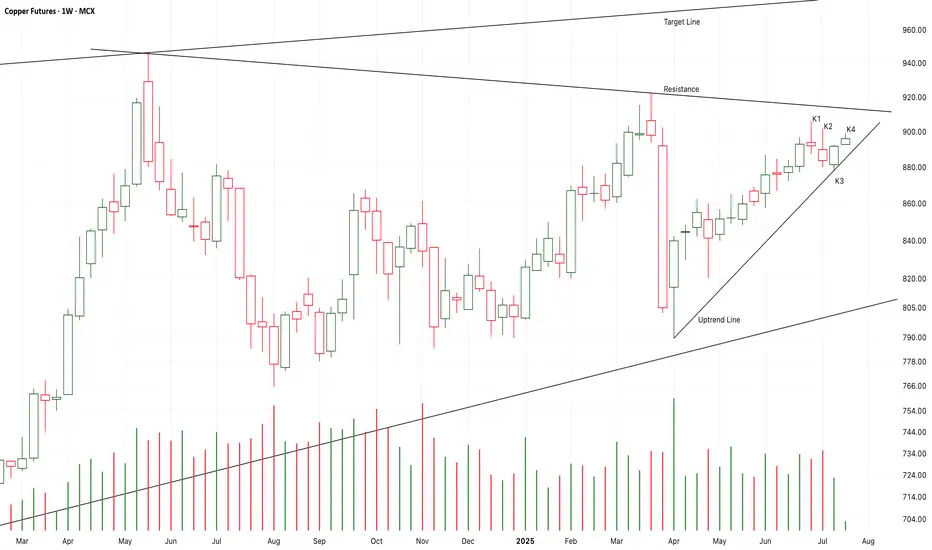
Chart Pattern Analysis Of Copper
K2 and K3 is a strong bullish up engulfing pattent.
K4 started with a bull gap to verify it.
It seems that K5 or K6 will break up the resistance to test the target line in the near future.
If I didn’t buy it earlier,I will try to buy it here.
I still hold the idea that the expensive metals such as Gold/Silver/Copper are in the long-term bull market.
Long-896/Target-1000/Stop-880
EP 01: BTC correction near completionAfter the impulse to last ATH we got a 3 wave correction, last wave being formed by 5 waves, so all together coming to completion. We should visit the liquidation area under last low and swipe that liquidity and aim closer to last ATH if not exceeding it. When the market gives us more information we will go for episode 02.
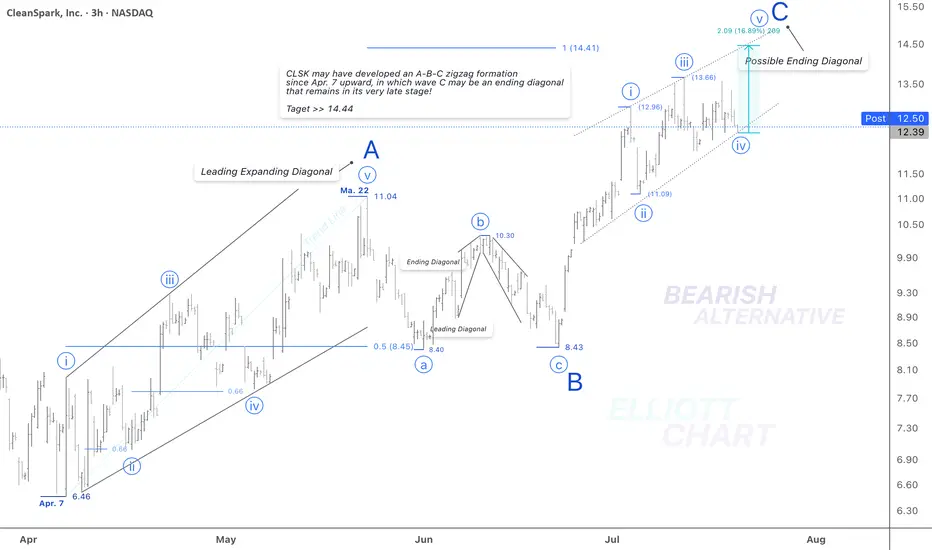
CLSK / 3hAccording to a bearish alternative in my weekly frame(not posted!), I'd analyzed the rising wave since April 7 as an A-B-C zigzag formation in correction of the Intermediate degree wave (B) >> Not shown in this 3h-frame.
Wave Analysis >> As depicted in the 3h-frame above, the Minor degree wave C of the countertrend advance in wave (B) may thoroughly develop in an ending diagonal, which remains in its very late stage, and a final advance of 17% lies ahead to conclude the ending diagonal wave C of the entire correction of wave (B).
Trend Analysis >> After completion of the possible ending diagonal as Minor degree wave C, the trend will change soon to downward in a decline of Intermediate degree wave (C).
#CryptoStocks #CLSK #BTCMining #Bitcoin #BTC
Elliott Wave Update – Is Wave 2 Complete?OANDA:XAUUSD
We're currently in an ABC correction following our Wave 1.
Potentially, Wave C is already completed, which would mean that Wave 2 has found its top.
❗ Why do I say potentially?
Because there's still a chance we could see a higher high before the real drop begins.
However, based on the current structure, I believe the top is in ✅
⚠️ Key Confirmation – White Trendline
📉 If we break below the white trendline, it confirms the end of Wave 2.
Then I expect a 5-wave move down:
➡️ (1) - (2) - (3) - (4) - (5)
📈 If the trendline holds, we might still see a higher Wave 2 before reversal.
📏 Fib Zones are marked on the chart for confluence and targets.
Let’s see how price reacts in the coming hours. A confirmed breakdown would set the stage for the next impulse ⚡

NZDUSD Potential LongsThis is how I'd be looking at NZDUSD for longs, not a high probability setup, considering current bearish structure but good RR makes it worth the risk

ETHUSDT TECHNICAL LONG CHART PATTENT ETHUSDT Technical Outlook – Bearish Momentum Building
ETH has clearly rejected the resistance zone near 3900, and the structure has now shifted bearish after failing to hold above 3760.
📉 Trendline Breakdown: Price action confirms entry into a bearish phase, supported by lower highs and a descending trendline.
🟠 First Setup Zone: Around 3500
🎯 Primary Target: 3300
🚨 If momentum continues, a deeper pullback toward 3100 is possible in the coming sessions.
Key Resistance: 3760 – As long as ETH trades below this level, bearish continuation remains in play

DRIFT/USDT After sweeping liquidity below the critical 0.43 zone, DRIFT has spent the past 19 days rebuilding a strong support base, indicating strong buyer absorption. The consolidation structure suggests accumulation is near completion.
Now the price is gearing up for a potential explosive breakout, with signs pointing toward a large impulse candle formation.
First Setup:
A clean 70% move is expected from current levels as the first leg of the rally.
Further targets will be assessed once price reaches the 0.77–0.80 zone, where key resistance and profit-taking activity could emerge.

GOLD → Breakthrough accumulation. Correction before growthFX:XAUUSD has been strengthening since the session opened and is heading towards the 3374 zone of interest. The price has previously broken through the consolidation resistance and may test this boundary before moving further.
Gold is rising amid trade risks and dollar weakness. After falling to $3310, gold resumed its growth, seeking to break through the $3368 level. Support for prices was provided by uncertainty surrounding Trump's tariff policy and expectations for Fed Chairman Powell's speech. The US dollar weakened temporarily as investors sought refuge in gold amid trade disputes with the EU, political instability in Japan, and criticism of the Fed from the White House.
Technically, the price is in a realization phase after breaking out of consolidation, but it has encountered resistance at 3368, which could lead to a correction. The focus is on the 3350-3355 zone. If the bulls hold their ground above this zone, the market may return to the realization phase.
Resistance levels: 3368, 3374
Support levels: 3345, 3332
The market is bullish and feels support, especially against the backdrop of a weak dollar. Traders are watching Trump and Powell. If the latter decides to cut rates, for example tomorrow at 12:30 GMT, gold could rally...
Technically, gold could test 3350 before rising.
Best regards, R. Linda!

BITCOIN → Consolidation, retest of 120K. Correction of dominanceBINANCE:BTCUSDT , after a rapid rally and touching 123K, rolled back and entered consolidation, giving altcoins a chance. At the same time, Trump signed new crypto laws, but will these laws open new doors?
On June 18, the GENIUS Act was signed. Information can be found in the sources, but there is no direct reference to BINANCE:BTCUSDT.P , except perhaps indirectly: increased confidence in the crypto market, increased liquidity, possible new rules, and pressure on decentralized assets. Bitcoin has not always grown on positive news; more often it has been a deep pullback and liquidation before the momentum.
Technically, Bitcoin is currently consolidating, and I would highlight several key areas: the upper range is 120K-120.9K. The zone between these levels is particularly important, as this is where buyers were previously liquidated and sellers gathered (liquidation is possible).
The bottom is 117K (confirmed) - 116.2K. There is a liquidity pool on the support side.
additional scenario if the market does not reach resistance and decides to form a long squeeze before growth
Theoretically, I am not yet expecting a breakout and growth of Bitcoin. I think that consolidation may continue for some time, especially against the backdrop of a pullback in altcoins and a deep correction in the dominance index.
Resistance levels: 120100, 120850
Support levels: 117000, 116230
Since the opening of the session, the price has been working off the liquidity capture from 117K. There is a reaction - growth, which could bring the price to the zone of interest at 120K. But the question is: will the price hold in the 120K zone? A false breakout of resistance could trigger a correction to 117-116K. Thus, I expect the market to remain in consolidation for some time or even expand the current trading range...
Best regards, R. Linda!

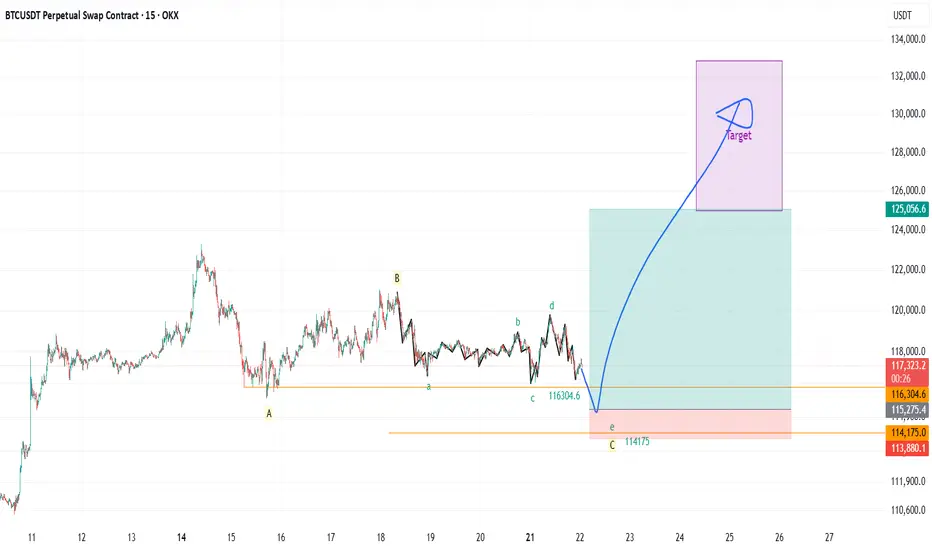
Bitcoin Technical Setup: Support Holds, Wave 5 in FocusBitcoin ( BINANCE:BTCUSDT ) filled the CME Gap($117,255-$116,675) and started to rise, as I expected in my previous idea .
Bitcoin is currently trying to break the Resistance zone($119,530-$118,270) . In the last week's movement, the price of $118,000 can be considered as one of the most important numbers for Bitcoin , with a lot of trading volume around this price.
In terms of Elliott Wave theory , it seems that Bitcoin has managed to complete the main wave 4 near the Support zone($116,900-$115,730) and Support lines . The structure of the main wave 4 is a Zigzag Correction(ABC/5-3-5) (so far). There is a possibility that the 5th wave will be a truncated wave because the momentum of the main wave 3 is high and Bitcoin may NOT create a new ATH and the main wave 5 will complete below the main wave 3.
I expect Bitcoin to start rising near the Potential Reversal Zone(PRZ) and Cumulative Long Liquidation Leverage($118,277-$118,033) , break the Resistance zone($119,530-$118,270) and reach the targets I have marked on the chart.
Note: Stop Loss(SL)= $116,960
CME Gap: $115,060-$114,947
Cumulative Short Liquidation Leverage: $121,502-$121,134
Cumulative Short Liquidation Leverage: $120,612-$119,783
Cumulative Long Liquidation Leverage: $116,810-$115,522
Do you think Bitcoin can create a new ATH again?
Please respect each other's ideas and express them politely if you agree or disagree.
Bitcoin Analyze (BTCUSDT), 1-hour time frame.
Be sure to follow the updated ideas.
Do not forget to put a Stop loss for your positions (For every position you want to open).
Please follow your strategy and updates; this is just my Idea, and I will gladly see your ideas in this post.
Please do not forget the ✅' like '✅ button 🙏😊 & Share it with your friends; thanks, and Trade safe.

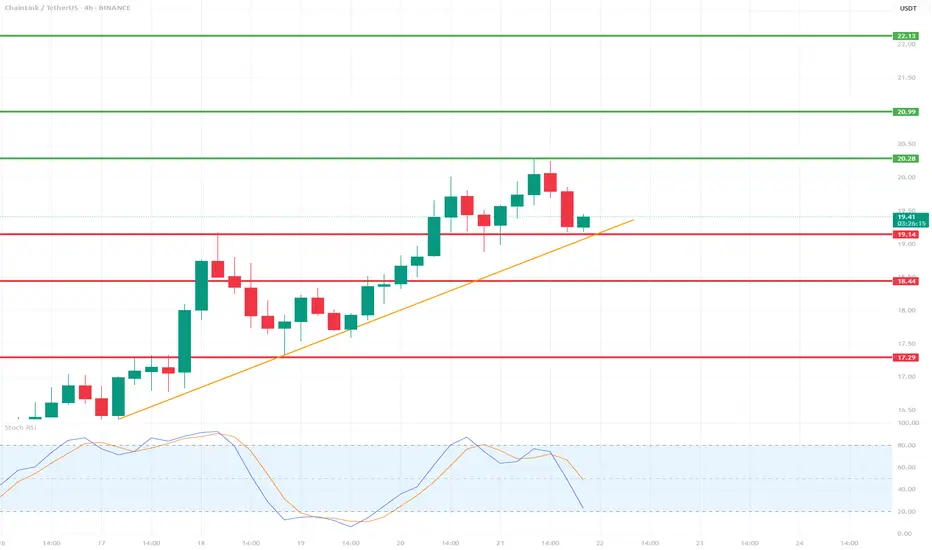
LINK/USDT 4H Chart📉 Indicators and Market Structure:
🔶 Trend:
Current trend: up, as long as it remains above the trend line and the 19.14 USDT level.
Local resistance: 20.28 USDT (recent high).
Next resistances: 20.99 USDT and 22.13 USDT (green lines).
Supports: 19.14 USDT, 18.44 USDT, 17.29 USDT (red lines).
🔷 Stochastic RSI (lower indicator):
Located in the oversold zone (below 20) and starting to reverse upward.
Potential signal of buying pressure if the %K and %D lines cross bullishly.
🧠 Scenarios:
✅ Bullish scenario (trend continuation):
Bounce from the trend line and the 19.14 level → breakout of 20.28 → test of 20.99–22.13.
Confirmation will be a clear bullish candle with high volume and a Stochastic RSI cross up.
❌ Bearish scenario (trend break):
Closing below the trend line and the 19.14 level → correction towards 18.44, and then even to 17.29.
An oversold RSI could support continued declines if a rebound does not occur.
📌 Summary:
Currently, the key level is the trend line and support at 19.14 USDT.
The market is waiting for a reaction – a rebound or a downward breakout.
Stochastic RSI suggests a possible rebound, but candlestick confirmation is needed.
Dogecoin - It is all totally expected!🐶Dogecoin ( CRYPTO:DOGEUSD ) will break out soon:
🔎Analysis summary:
Just this month, Dogecoin perfectly retested a significant confluence of support and is starting the expected rejection. With bullish momentum picking up, there is a very high chance that Dogecoin will break the all time high in the near future.
📝Levels to watch:
$0.5
🙏🏻#LONGTERMVISION
SwingTraderPhil

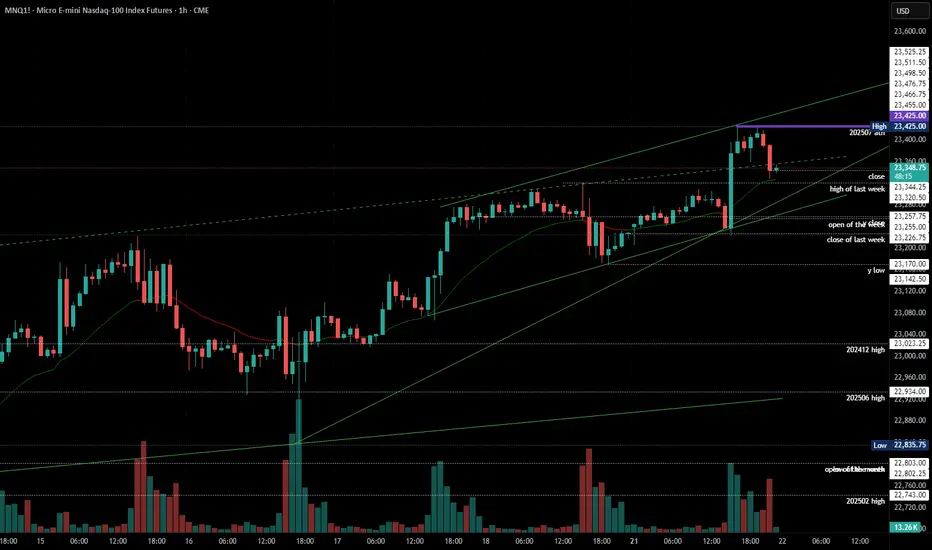
2025-07-21 - priceactiontds - daily update - nasdaqGood Evening and I hope you are well.
comment: Melt-up and bears failed to close below last weeks high, which means we are still max bullish. Until bears print below 23200, longs just make more sense than trying to look for shorts.
current market cycle: bull trend
key levels: 23000 - 23500
bull case: Bulls remain in full control until we get a daily close below 22700. First target for the bears is a lower low, which means getting below today’s spike 23225. That would be a start but likely means sideways rather than more selling. If we stay above 23200, we can continue to print many more new highs.
Invalidation is below 22700.
bear case: Bears obviously are not doing enough. They need to print 23200 and that would only be the first small start. It would open the possibility for a test of 23000 but since we are barely printing any red bars and have not broken any bull trend line so far, it’s stupid to look for shorts. Wait for much bigger selling pressure.
Invalidation is above 23500.
short term: Neutral but if anything I am looking for long scalps against support like the 1h 20ema.
medium-long term - Update from 2024-06-29: No change in plans. I expect 20000 to get hit over the next 3 months and maybe 19000 again.
trade of the day: Long US open. Just a quick melt-up but I missed it.
Alphabet - The textbook break and retest!📧Alphabet ( NASDAQ:GOOGL ) will head much higher:
🔎Analysis summary:
If we look at the chart of Alphabet we can basically only see green lines. And despite the recent correction of about -30%, Alphabet remains in a very bullish market. Looking at the recent all time high break and retest, there is a chance that we will see new all time highs soon.
📝Levels to watch:
$200
🙏🏻#LONGTERMVISION
Philip - Swing Trader

Meta - The breakout in question?🪓Meta ( NASDAQ:META ) is retesting major structure:
🔎Analysis summary:
After Meta perfectly retested a major previous support trendline in 2022, the trend shifted bullish. We have been witnessing an incredible rally of about +700% with a current retest of the previous all time highs. Time will tell but a bullish breakout remains quite likely.
📝Levels to watch:
$750
🙏🏻#LONGTERMVISION
Philip - Swing Trader

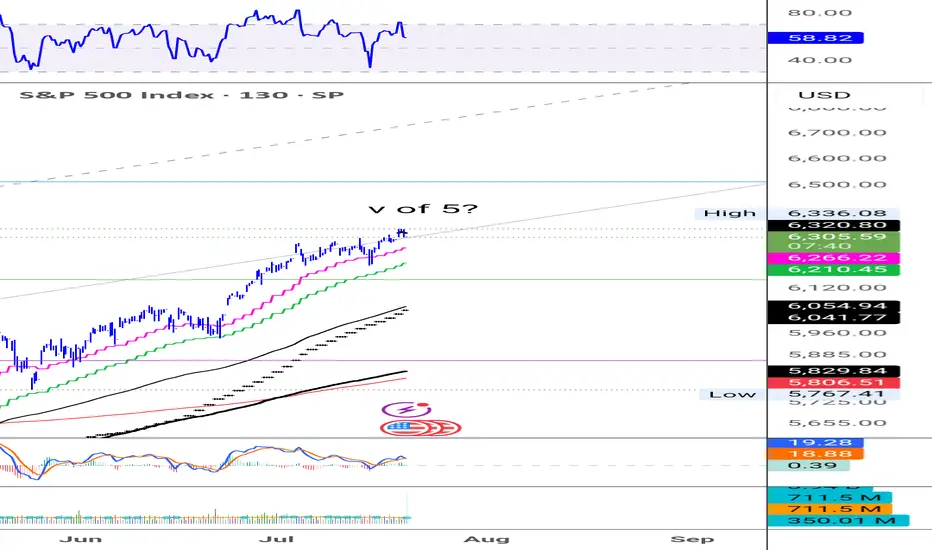
SPX - Time for a correction? To make it very simple,
Prices have been going up very nicely those last few weeks and months.
Everyone is happy but as we know that can't last.
NASDAQ:OPEN seems to be the latest pump and dump and it's just another sign of a coming correction imho.
Most stocks I've been following have reached resistance zone, levels where profit taking is very likely.
$S&P500 seems to have made a fifth wave, RSI divergence is present and confirming that.
It's difficult to pinpoint the exact top of course so I'm giving myself some leeway and use a small 1% stop loss in this case.
Gold Buys - Swing TradingGold is projected to retrace to 3340 and later push up to clear the buy side liquidities above, which are the monthly highs. Trade with good risk management
