post market ideasSPX rallied into resistance today, so far it's being held back there. Gold looks like a bounce is coming but I don't think it lasts. NG is looking more and more bullish. USOIL found support under 70 and should test the highs from Friday. BTC looks like it could come down a bit here.
Wave Analysis

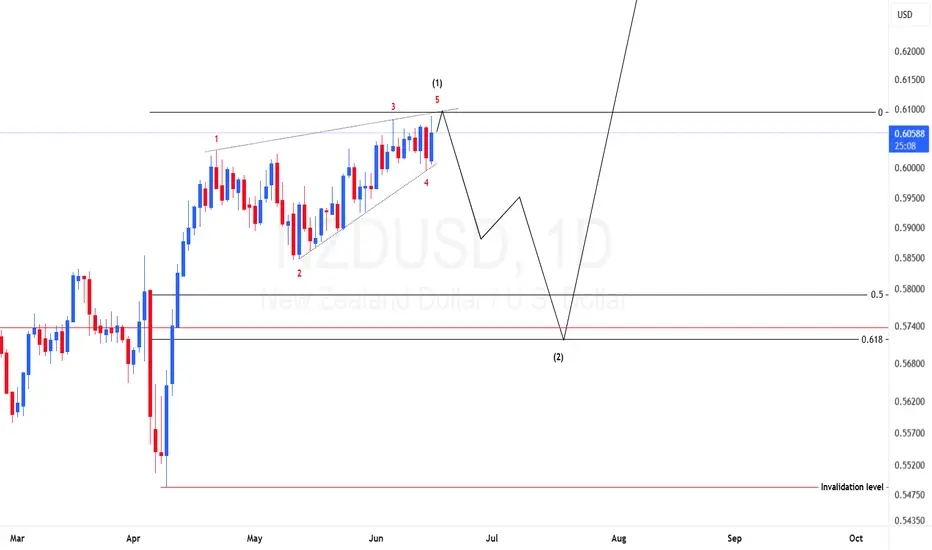
NZDUSD Elliotwaves CountPrice have unfolded the leading diagonal structure and we have seen signs of bullish weakness. If we are correct we should expect price to drop to at least the golden zone before resuming the bullish momentum.
XAUUSD Elliotwaves update: Is wave 4 complete?On our previous view we were expecting a wave c to the upside that will complete wave B of higher degree. It looks like wave B is completed with an ending diagonal. Now what I am anticipating is price to drop to complete wave 4 in higher degree. However, if wave 4 is complete then the move up might be a leading diagonal for wave 1 of 5. But all in all the the current bias is to the downside and therefore to take advantage of the move to the downside one should find areas where price will find resistance for a possible sell opportunity.

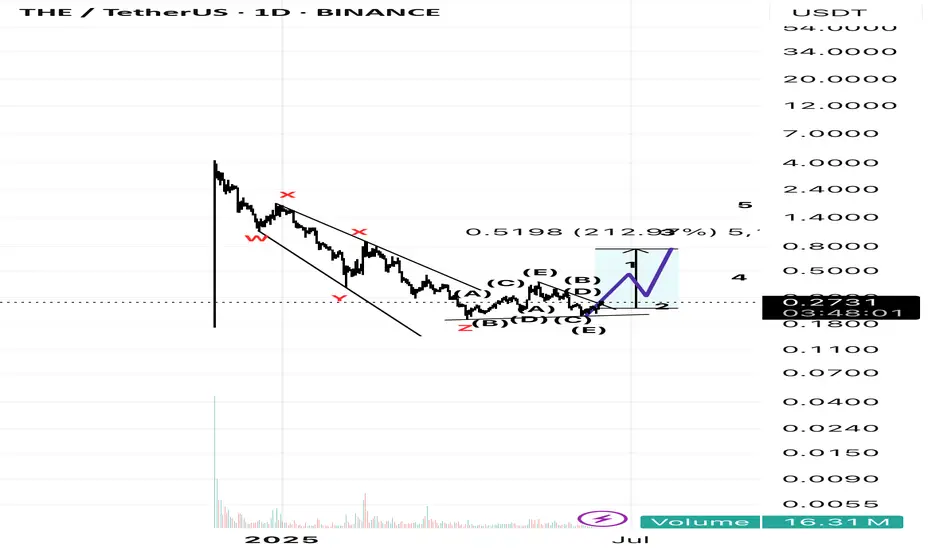
Altusdt time DI have another neat chart for you The chart in question, after a nearly flag-like pattern has recorded its entire corrective pattern, as well as its post-pattern and new movement The pattern with waves w.x.y.x.z It has managed to pass the double-combination correction It seems that we have entered an upward trajectory in this currency Patterns that can form after this pattern We can even grow up to 1000%
USDJPY – Triangle Complete? Wave (v) Setup BuildingWave (iv) appears to be ending with an (e) wave tag into the 0.764 retracement.
📉 Price remains capped within the contracting triangle — watching closely for breakdown confirmation.
If this plays out, wave (v) of C could now begin unfolding with initial focus on 140.00 and below.
🧩 Structure: (a)-(b)-(c)-(d)-(e) triangle complete
📏 Final wave (e) aligns with 0.764 retracement and structural resistance
⚠️ RSI divergence + weakening momentum support the bearish scenario

be ready for it this for educational purpose comment for any stock analysis name and take risk on ur on action

Wave 5 up in a Diagonal could be hours away The chart posted is the sp 500 futures back in april 10 th I labeled the low at 5102 as wave B or 2 both called for sharp rally to as high as 6147 in which wave 1 or a x 1.168 = 3 or c for a wave B top . since then I saw the high at 5968 as the end of wave 3 top and then looked for a drop back to 5669 we saw 5667 and so far all rallies have taken a 3 wave formation in which Most but Not all times this is occurring in an ending diagonal and in each wave we saw so far .887 the preceding wave . I have traded in and out and I am waiting for a final push up to 6083/6147 midpoint 6100 to take a short position . The alt is a small series of 4/5 4/5 4/5 if this were the count we would then break ABOVE 6147 and then reach 6330 . I am waiting to confirm .Best of trades WAVETIMER

GOLD → Hunting for liquidity before continued growthFX:XAUUSD has been correcting since the start of the session. The fundamental background is complicated due to the escalation of the conflict in the Middle East.
The price of gold briefly retreated from a two-month high above $3,450 amid a recovery in the dollar and investor caution. Escalating tensions between Israel and Iran are dampening risk appetite, while markets await decisions from the Fed and the Bank of Japan. Expectations of a dovish Fed continue to support interest in gold, but fresh impetus is needed for further gains.
Technically, the market is bullish. Gold is forming a correction to the key support and liquidity zone amid an uptrend. The price is within the range, and a retest of 3400 could trigger growth.
Support levels: 3408, 3400
Resistance levels: 3446, 3500
A retest of support and liquidity capture amid the current challenging situation (high interest in the metal) and a bullish trend could support the price, allowing gold to continue its growth.
Best regards, R. Linda!

BITCOIN → Buyback bar. Chance of growth to 108,000BINANCE:BTCUSDT is trading in a fairly wide range of 100,600 - 110,400. The market is stagnating due to fundamental uncertainty, but the risks of a decline are quite high...
After the escalation of the conflict in the Middle East, Bitcoin broke the bullish structure on the market and managed to test the local level of 102500, from where a fairly aggressive phase of buying out the fall began within one trading session. The market is defending the structure quite aggressively. The chart shows a local range forming with strong levels at 102500 and 106200. Accordingly, the price may remain in this range for a long time (in which case an intraday trading strategy can be considered). However, if Bitcoin starts to stick to one of the boundaries, then we can consider the price leaving the range, but based on the structure of the uptrend, correction, and the formation of a buyback bar, it would be logical to see an attempt to break through resistance with the aim of continuing growth.
Resistance levels: 106200, 108200, 110400
Support levels: 102500, 100600
On D1, there are no prerequisites for a strong decline. The market is buying up knives and trying to stay afloat (in consolidation). In the medium term, there may be an attempt to retest 102500 - 100600 due to the liquidity pool. But locally, the market may form an attempt to grow to 108200
Best regards, R. Linda!

NZDUSD → Correction and liquidity capture ahead of growthFX:NZDUSD , following a sharp decline during the Pacific-Asian session, is testing the support of the upward trend and the liquidity zone...
The dollar is correcting amid escalating tensions in the Middle East. This is a temporary move, and the market may return to its main trend. The currency pair is forming a false breakdown of support
Against the backdrop of an uptrend and a weak dollar, the currency pair is testing support at 0.6000. The reaction is weak at the moment, but there is a chance for growth if the price consolidates above 0.6020. I do not rule out a retest of the liquidity zone at 0.5989 before growth
Support levels: 0.6000, 0.5989
Resistance levels: 0.6068
The inability to continue falling and the formation of a local reversal structure relative to 0.6000 (price consolidation above 0.6020) may support the market. I do not rule out that the market may decline to the liquidity zone of 0.5989 before rising.
Best regards, R. Linda!

Analysis of gold trend on June 16:
1. Market review: bottoming out and rebounding, trend established
This week, gold showed an overall "bottoming out and rebounding" trend, laying a solid foundation for the bull market. Especially on Friday, the gold price rose rapidly during the US trading session, breaking through the 3,400 mark, reaching a high of 3,446 US dollars per ounce, a new high in nearly two months. The gold price rose and fell in the late trading, and finally closed at around 3,433, indicating that the short-term is still facing certain profit-taking pressure. On the whole, although the medium-term trend continues to be bullish, the possibility of a technical correction cannot be ruled out at the beginning of next week. In terms of operation, attention should be paid to the rhythm switching, and low-long is still the main tone.
2. Fundamental outlook: Pay attention to the Fed and G7 summit
Federal Reserve resolution and Powell's speech
The market generally expects that the FOMC will keep the interest rate unchanged this time;
Investors will focus on the "dot plot" and the forecast of the future interest rate path;
Whether Powell's speech releases dovish signals may provide guidance for the gold trend.
Impact of the G7 Summit
Trump will visit Canada from June 15 to 17 and attend the G7 Leaders' Summit;
His related speeches (involving trade, finance, risk aversion, etc.) may cause fluctuations in the gold market and need to be paid close attention to.
III. Technical structure analysis: clear support, bulls dominate
1. Key support level:
3400 mark + daily Bollinger band upper rail 3419: short-term bullish strong support;
3380 line: this Friday's low point + Bollinger middle rail position, still biased towards bullish thinking before breaking.
2. Important resistance level:
3446-3450 area: monthly Bollinger band upper rail, a strong pressure level;
If it breaks through, it is expected to further rise to 3455-3465 or even hit the 3500 mark.
3. Indicator reference:
If the daily MACD shows a dead cross and the downward momentum column continues to increase, be alert to the market accelerating to the 5-day moving average;
On the contrary, if the price stabilizes in the 3400-3420 area, it still has the momentum to continue to rise.
4. Operation suggestions: low-long mainly, high-short as auxiliary
Aggressive long: Buy long at the support position of 3400-3410. Stop loss is recommended below 3390. Target is 3450-3465. Short-term support is not broken, bullish
Steady long order: Retracing to the 3380 line. Stop loss is recommended below 3365. Target is 3440-3450. Strong support of the middle track of the daily Bollinger
Short short attempt: First touch 3450-3465. Stop loss is recommended above 3470. Target is 3420-3415. Quick in and out to prevent breakthrough
5. Summary of views
Mid-term trend: Still a clear upward structure;
Short-term rhythm: Need to guard against retracement and look for low-long opportunities;
Focus on next week:
Support below: 3400-3410 / 3380
Resistance above: 3450-3465 / 3500
Next week's gold strategy will still focus on "mainly long on pullbacks and short on rebounds as a supplementary trading idea". Control positions, strictly stop losses, and focus on the guidance of policy events on market sentiment.

XAUUSD Price Analysis | Bearish Reversal in ProgressGold has sharply broken down from the upper boundary of a well-respected parallel channel, hinting at a potential trend reversal.
🔎 Technical Breakdown:
Strong rejection at ~$3,440 resistance zone
Break in market structure = early signs of bearish momentum
Support 1: $3,300 – key short-term zone
Support 2: $3,250 – major confluence level
If price fails to hold above $3,300, a continuation toward $3,250 looks likely in the coming sessions.
📊 Trade Setup
Bias: Bearish
Entry Zone: On pullbacks below $3,390
TP1: $3,300
TP2: $3,250
SL: Above $3,420 (recent swing high)
⚠ Watchlist Dates:
🗓 June 18 – FOMC Meeting (high impact)
💬 What’s your outlook? Will gold hold $3,300 or are bears in control? Let’s discuss below!
#Gold #XAUUSD #PriceAction #TradingView #TechnicalAnalysis #Forex #FOMC #MarketOutlook

BTC to $100k?BTC retraced up to the 0.618 fib level in a 3 wave B. Soon it could resume the wave down to ~$100k. What do you think?

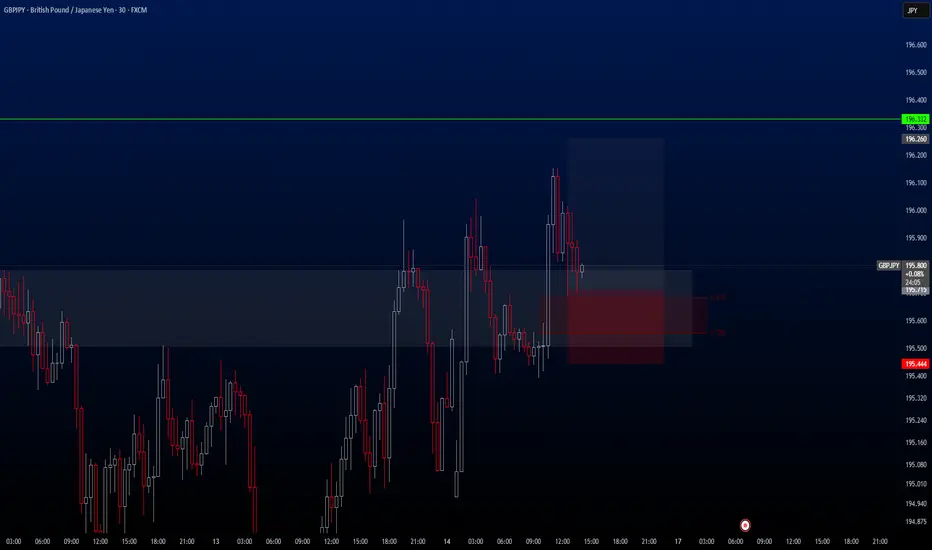
GBPJPY Hello traders.
Today's first trade comes from the GBPJPY pair. The trade is currently active on my side, and I’m happy to share it with you as well.
🔍 Trade Details
✔️ Timeframe: 15-Minute
✔️ Risk-to-Reward Ratio: 1:2
✔️ Trade Direction: Buy
✔️ Entry Price: 195.715
✔️ Take Profit: 196.260
✔️ Stop Loss: 195.444
🔔 Disclaimer: This is not financial advice. I’m simply sharing a trade I’ve taken based on my personal trading system, strictly for educational and illustrative purposes.
📌 Interested in a systematic, data-driven trading approach?
💡 Follow the page and turn on notifications to stay updated on future trade setups and advanced market insights.
Wall Street Eyes Volatility: Dow Jones Tests Reversal ZoneUS30 (Dow Jones Index) — Clashing Forces of Risk & Reality
Technical Outlook — 16 June, 2025 | 1H Chart
Current Market Condition:
The Dow Jones (US30) has staged a recovery from the recent dip, but price is stalling at the Previous Day High (~42,588), a key confluence zone with the broken rising trendline, 50 EMA, and overhead supply.
This hesitation comes amid heightened global risk aversion triggered by the intensifying Iran–Israel conflict, adding pressure to global indices as investors rotate into safer assets like treasuries and gold. Despite intraday rebounds, equity bulls are showing signs of fatigue at resistance zones.
Markets are also bracing for upcoming US economic data and Fed commentary, which may further amplify intraday volatility.
Key Technical Highlights:
Price rejected from the confluence of PDH (~42,588), horizontal supply zone, and old rising trendline (yellow).
Currently hovering just under the 50 EMA; failure to hold could initiate a rotation back toward PD Low.
Stochastic RSI nearing overbought — suggests possible local top if no momentum breakout follows.
EMA 200 and the Previous Day Low at ~42,053 remain critical intraday supports.
Overall structure forming potential lower high under bearish macro cloud.
Trade Plan:
🔼 Bullish Breakout (Intraday Long):
Trigger: Break and sustained hold above 42,600 with rising volume
Target: 42,900 → 43,100
Stop Loss: Below 42,450 (to avoid whipsaws)
🔻 Bearish Rejection (Intraday Short):
Trigger: Clean rejection from PDH + trendline with bearish engulfing
Target: 42,100 → 42,050 → 41,850
Stop Loss: Above 42,650
⚖️ Neutral / Range Trade:
Play the range between PDH (~42,588) and PDL (~42,053) until breakout.
Scalp based on price reaction at either boundary with tight stop loss.
🛡️ Risk Management Note:
Global uncertainty tied to war escalation and Fed policy expectations make this a headline-driven market. News risk can spike volatility and invalidate technical setups. Trade with reduced size and increased caution, especially around US market open and geopolitical news cycles.
📢 If you found this analysis valuable, kindly consider boosting and following for more updates.
⚠️ Disclaimer: This content is intended for educational purposes only and does not constitute financial advice.

Eurofins Scientific SE Stock Quote | Chart & Forecast SummaryKey Indicators On Trade Set Up In General
1. Push Set Up
2. Range Set Up
3. Break & Retest Set Up
Notes On Session
# Eurofins Scientific SE Stock Quote
- Double Formation
* (Diagonal) - *Shift & Entry | Completed Survey
* (2nd Entry Area)) + *Lower Band Feature | Subdivision 1
- Triple Formation
* (P1)) / (P2)) & (P3)) | Subdivision 2
* (TP1) = a / Long Consecutive Range
* (TP2) = b / Short Consecutive Pullback | Subdivision 3
* Daily Time Frame | Trend Settings Condition
- (Hypothesis On Entry Bias)) | Indexed To 100
- Position On A 1.5RR
* Stop Loss At 118.00 EUR
* Entry At 123.00 EUR
* Take Profit At 128.00 EUR
* (Uptrend Argument)) & No Pattern Confirmation
* Ongoing Entry & (Neutral Area))
Active Sessions On Relevant Range & Elemented Probabilities;
European-Session(Upwards) - East Coast-Session(Downwards) - Asian-Session(Ranging)
Conclusion | Trade Plan Execution & Risk Management On Demand;
Overall Consensus | Buy

DSIL LONG TRADE 16-06-2025DSIL Long Trade
Rationale: DSIL broke out of a bearish channel (potentially reversing trend) and seems ready to resume its uptrend. Targets are deduced from price action and quantified displacement method.
🚨 TECHNICAL BUY CALL – DSIL🚨
- Buy 1: Current level (Rs. 5.9)
- Buy 2: Rs. 5.7
- Buy 3: Rs. 5.3
- TP 1: Rs. 6.51
- TP 2: Rs. 7.10
- TP 3: Rs. 7.60
- TP 4: Rs. 8.20
Stop Loss - Below Rs. 5 closing basis
Risk-Reward Ratio - 1:3
Caution: Close at least 50% position size at TP1 and then trail SL to avoid losing incurred profits in case of unforeseen market conditions.
PLEASE BOOST AND SHARE THE IDEA IF YOU FIND IT HELPFUL.

FECTC LONG TRADE/INVESTMENT 16-06-2025FECTC Technical Long & Investment Buy Call
Rationale: FECTC broke out of a range in Oct 2024, achieved a target of 132, and then corrected in an ABC pattern. After pulling back to the breakout level, the stock shows good price action with volumes, suggesting a resumption of the uptrend.
🚨 TECHNICAL BUY CALL – FECTEC🚨
- Buy 1: Current level (Rs. 77-76.8)
- Buy 2: Rs. 69.6
- Buy 3: Rs. 62.4
- TP 1: Rs. 97.52
- TP 2: Rs. 113.5
- TP 3: Rs. 129.5
- Long-term Investment TP: Rs. 159.8
Stop Loss- Below Rs. 50.8
Risk-Reward Ratio- 1:5
Caution: Close at least 50% position size at TP1 and then trail SL to avoid losing incurred profits in case of unforeseen market conditions.
PLEASE BOOST AND SHARE THE IDEA IF YOU FIND IT HELPFUL.

PIAHCLA LONG TRADE (SECOND STRIKE) 16-06-2025PIAHCLA Buy Call - Second Strike
Previous Performance : We recently gave a buy call for PIAHCLA, which achieved all its given targets.
Rationale: PIAHCLA broke out of a range (Rs. 12.9 - Rs. 21.2) and assumed a new uptrend. We expect the stock to achieve targets based on quantified displacements and overlying supply zones.
🚨 TECHNICAL BUY CALL – PIAHCLA🚨
- Buy 1: Current price (Rs. 26.1)
- Buy 2: Rs. 22.4
- Buy 3: Rs. 20.5
- TP 1: Rs. 26.4
- TP 2: Rs. 28.2
- TP 3: Rs. 29.8
Stop Loss - Below Rs. 19.5 closing basis
Risk-Reward Ratio - 1:4
Caution: Close at least 50% position size at TP1 and then trail SL to avoid losing incurred profits in case of unforeseen market conditions.
PLEASE BOOST AND SHARE THE IDEA IF YOU FIND IT HELPFUL.

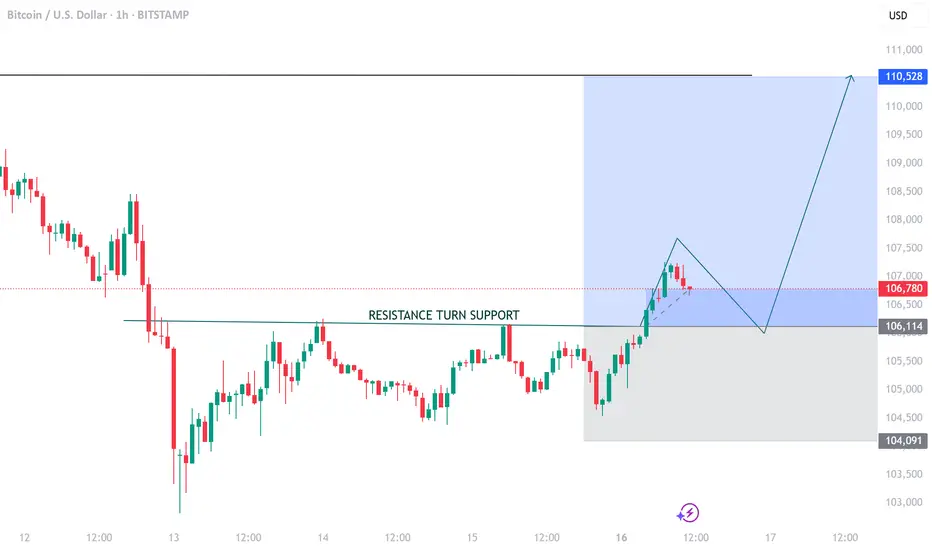
BTCUSD TRADE IDEABTCUSD is trading above a resistance turned support zone, a retest on that level will validate where the pair is heading, in my opinion i expect a buy signal once i see a reaction on that level. My TP is 110.528, Good luck and have a great trading week.
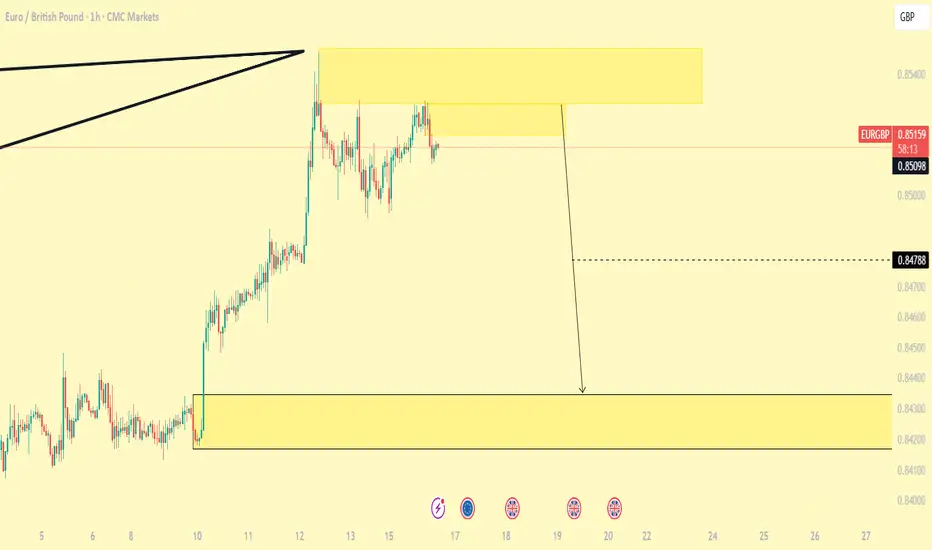
GBPUSD Making Its Prices HighGBP/USD now faces some renewed selling orders and slips back to the 1.3600 zone on Monday. Cable's decent gains come on the heels of rising pessimism about the US Dollar and encouraging geopolitical news.

BTC is Bullish!Hello TradingView Family / Fellow Traders. This is Richard, also known as theSignalyst.
📈BTC has been overall bullish trading within the rising channel marked in blue.
Moreover, the red zone is a strong structure!
🏹 Thus, the highlighted blue circle is a strong area to look for buy setups as it is the intersection of structure and lower blue trendline acting as a non-horizontal support.
📚 As per my trading style:
As #BTC approaches the blue circle zone, I will be looking for bullish reversal setups (like a double bottom pattern, trendline break , and so on...)
📚 Always follow your trading plan regarding entry, risk management, and trade management.
Good luck!
All Strategies Are Good; If Managed Properly!
~Rich
