XAUUSD: Gold's Minor Wave (iv) Consolidation Before Final SurgeHello TradingView Community!
Quick Elliott Wave update for Gold (XAU/USD), as of June 16, 2025.
Gold is currently in a Minor Wave (iv) consolidation within its larger Wave 5 uptrend. This period of sideways movement is healthy and expected to last from a few days to a month, building a base.
My primary view is that once this Wave (iv) completes, Gold will launch into its final bullish surge (Minor Wave (v) of Wave 5), targeting new all-time highs.
Long-Term: Be aware that after this "5th of 5th" completes, a prolonged, multi-month to multi-year correction or consolidation is highly probable, marking the end of the current major bull cycle.
Thoughts? Let me know below! Like & Follow if helpful.
#XAUUSD #Gold #ElliottWave #EW #Fibonacci #TechnicalAnalysis #Consolidation #Uptrend #PriceAction #ChartAnalysis #WaveAnalysis #MarketStructure #TrendAnalysis #Bullish #Correction #PriceForecast #LongTerm #ShortTerm #Trading #Investing #MarketUpdate #FX #Commodities
❗ Important Disclaimer: This analysis is based on Elliott Wave Principle and is my personal interpretation, not financial advice. Trading involves risk. Always do your own research.
Wave Analysis

ORCL at a Critical Zone: Will the Eagle Strike?
Oracle (ORCL) just completed a parabolic +20% move. Now it's flashing clear signs of exhaustion:
Bearish candle forming just below the EMA21
RSI spiked above 80 and is now curling down
Volume is fading while price stalls
Long upper wicks = visible selling pressure
This setup fits perfectly with my strategy: “The Eagle Trap” 🦅 — designed to catch short-term tops after euphoric rallies.
🔻 PUT thesis:
If price breaks below $212 with strong volume, targets are:
$208 → $202 → $198.
🎯 Invalidation:
If it reclaims $217 with heavy volume, the trade is off.
I don’t force trades — but I’m ready to strike if the breakdown confirms.
🔔 Follow me for real setups, weekly traps, and full strategy breakdowns.

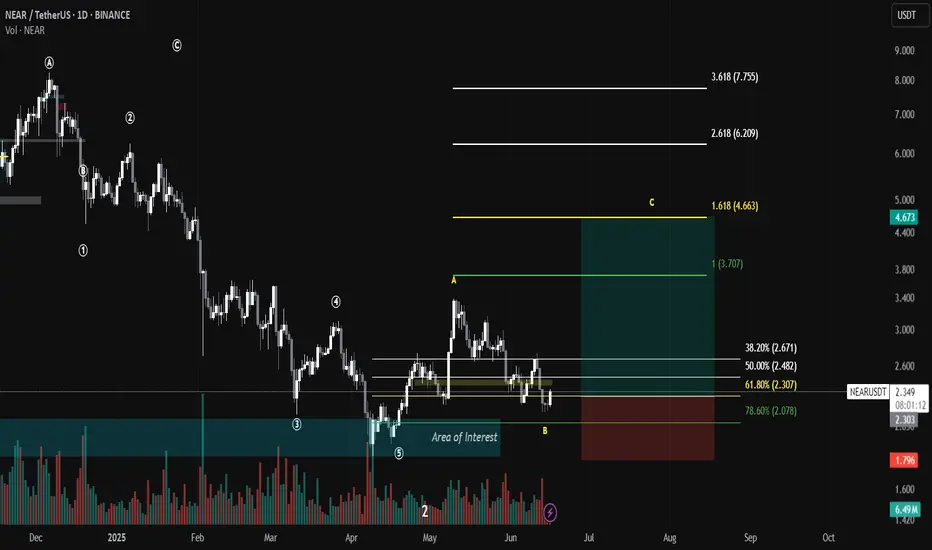
NEAR/USDT trade plan🧠 NEAR/USDT – Potential Wave C Setup (Elliott Wave + Fib Confluence)
📆 Timeframe: 1D | Exchange: BINANCE
🚀 Setup Overview:
We are likely entering a bullish Wave C based on the completion of an ABC corrective structure within a larger Elliott Wave pattern. The current price action has pulled back into a key "Area of Interest", aligning with multiple Fibonacci retracement levels, offering an attractive entry opportunity.
🎯 Entry Zone (Buy):
Between $2.30 – $2.35
This aligns with the 61.8% Fib retracement, a historically strong reversal level.
Also within the highlighted Area of Interest, marked by high volume and previous consolidation.
📉 Stop Loss (SL):
Set below the 78.6% retracement level: $2.07
A break below this level invalidates the ABC bullish setup.
📈 Target Zones for Wave C:
TP1: $3.70 (1.0 Fib Extension – Wave A equal to C)
TP2: $4.66 (1.618 Fib Extension – typical Wave C projection)
TP3 (Moonshot): $6.20 – $7.75 (2.618–3.618 extension for aggressive continuation)
SPY 5 Wave Impulse The broader equity market has staged a significant rebound from the panic-induced tariff lows seen in April, reclaiming the previously established value area with notable strength. Generally, when price reclaims a value range, it can be common for price to oscillate within the value area high, and low, to build strength for the next move.
From a structural standpoint, I interpret this advance as a five-wave impulsive sequence, with the current rally toward the 6100 level representing the fifth subwave within a larger third wave of the broader Elliott Wave framework. According to this interpretation, we may be approaching a final "blow-off" move to the upside—commonly labeled as Wave 5 of 5—which is often characterized by its velocity, magnitude, and the psychological impact it has on retail participants, frequently triggering a surge of FOMO-driven buying.
However, I urge caution: this concluding leg may offer a strategic opportunity to reduce equity exposure, particularly as August has historically exhibited bearish seasonality. A swift corrective decline could follow the completion of this wave, potentially sparking short-term panic. While unsettling, such a correction would likely represent a healthy rebalancing within the broader uptrend and could provide an advantageous entry point ahead of a year-end rally.
Furthermore, it's worth noting that many hedge funds and CTAs have remained underexposed throughout this powerful ascent. Should valuations reset to more attractive levels, sidelined liquidity—particularly capital currently parked in money markets—may be incentivized to re-enter the market with a longer-term outlook.
The key indicator which I will be following is the VIX risk sentiment in the market. Once we reach elevated levels above approx 30/40 , this would be a good time for me to analyze potentially dollar cost averaging back into the market.
Good luck!

₿itcoin: Continuing B WaveBitcoin has recently reclaimed the key $106,000 level. Under our primary scenario, we anticipate continued increases into the blue Target Zone between $117,553 and $130,891 – where green wave B is expected to conclude. From that corrective peak, we project a significant move lower in wave C, which should ultimately pull prices into the lower blue Target Zone between $62,395 and $51,323. This range is expected to mark the completion of orange wave a. We then foresee a brief corrective rally before wave (ii) completes its broader correction with a final sell-off.
📈 Over 190 precise analyses, clear entry points, and defined Target Zones - that's what we do.

GOLD - WAVE 5 BULLISH TO $3,600Gold moving perfectly, according to our bullish analysis which I posted for you all last week. Gold been bullish for a technical perspective for a while, now we're seeing the elite push out the fundamental factor of the Israel attack on Iran, to help Gold keep moving up.
Gold is still within a 'Bullish Accumulation' phase, hence why it's not moving up very strong. Bare in mind, we are in the FINAL WAVE 5 bullish move on a HTF, so we can experience choppy price action.

Ripple: Lower Low ExpectedWe still expect magenta wave (2) to conclude within the magenta Target Zone between $1.03 and $0.38 – a range we consider attractive for long entries. That said, there's a 40% probability that magenta wave alt.(2) has already bottomed. If so, a direct breakout above resistance at $3.00 and $3.39 would confirm this alternative scenario and suggest that the corrective phase is already behind us.
📈 Over 190 precise analyses, clear entry points, and defined Target Zones - that's what we do.

#4162025 | BTCUSD Supply Zone 1:10BTCUSD Supply Zone Appears in D1 Time Frame Looking Price Action for Long Term Sell
Risk and Reward Ratio is 1:10
After 50 pips Profit Set SL Entry Level
"DISCLAIMER" Trading & investing business is "Very Profitable" as well as risky, so any trading or investment decision should be made after Consultation with Certified & Regulated Investment Advisors, by Carefully Considering your Financial Situation.

About to break outNothing much to say, chart speaks for itself
Breaking this structure will send this thing up hard

QQQ On The Rise! BUY!
My dear friends,
My technical analysis for QQQ is below:
The market is trading on 526.92 pivot level.
Bias - Bullish
Technical Indicators: Both Super Trend & Pivot HL indicate a highly probable Bullish continuation.
Target - 530.98
About Used Indicators:
A pivot point is a technical analysis indicator, or calculations, used to determine the overall trend of the market over different time frames.
Disclosure: I am part of Trade Nation's Influencer program and receive a monthly fee for using their TradingView charts in my analysis.
———————————
WISH YOU ALL LUCK

BTCUSD Expected Growth! BUY!
My dear friends,
Please, find my technical outlook for BTCUSD below:
The price is coiling around a solid key level - 10537
Bias - Bullish
Technical Indicators: Pivot Points Low anticipates a potential price reversal.
Super trend shows a clear buy, giving a perfect indicators' convergence.
Goal - 10693
About Used Indicators:
The pivot point itself is simply the average of the high, low and closing prices from the previous trading day.
Disclosure: I am part of Trade Nation's Influencer program and receive a monthly fee for using their TradingView charts in my analysis.
———————————
WISH YOU ALL LUCK

EURNZD Massive Short! SELL!
My dear subscribers,
EURNZD looks like it will make a good move, and here are the details:
The market is trading on 1.9194 pivot level.
Bias - Bearish
My Stop Loss - 1.9246
Technical Indicators: Both Super Trend & Pivot HL indicate a highly probable Bearish continuation.
Target - 1.9095
About Used Indicators:
The average true range (ATR) plays an important role in 'Supertrend' as the indicator uses ATR to calculate its value. The ATR indicator signals the degree of price volatility.
Disclosure: I am part of Trade Nation's Influencer program and receive a monthly fee for using their TradingView charts in my analysis.
———————————
WISH YOU ALL LUCK

EURNZD: Short Trading Opportunity
EURNZD
- Classic bearish setup
- Our team expects bearish continuation
SUGGESTED TRADE:
Swing Trade
Short EURNZD
Entry Point - 1.9088
Stop Loss - 1.9138
Take Profit - 1.8982
Our Risk - 1%
Start protection of your profits from lower levels
Disclosure: I am part of Trade Nation's Influencer program and receive a monthly fee for using their TradingView charts in my analysis.
❤️ Please, support our work with like & comment! ❤️

Weekly trading plan for ETH In this idea I marked the important levels for this week and considered a few scenarios of price performance
Write a comment with your coins & hit the like button and I will make an analysis for you
The author's opinion may differ from yours,
Consider your risks.
Wish you successful trades ! mura

E-mini Nasdaq-100 Trading Setup for sellers ^)We have completed cup and handle pattern here...
So after the price is still high!
We may see some price gain additional, something like 13-18% .
So we have two option here for the sellers, wait and sell from marked point 1 or 2 .
P.S. This is very long time range position. ( Something like 200-800 day ).
Have a profit in your day!
Thanks.

Hanzo / Nas100 30 Min ( Accurate Tactical Break Out Zones )🔥 Nas100 – 30 Min Scalping Analysis (Bearish Setup)
⚡️ Objective: Precision Breakout Execution
Time Frame: 30-Minute Warfare
Entry Mode: Only after verified breakout — no emotion, no gamble.
👌Bullish After Break : 21810
Price must break liquidity with high volume to confirm the move.
👌Bearish After Break : 21640
Price must break liquidity with high volume to confirm the move.
☄️ Hanzo Protocol: Dual-Direction Entry Intel
➕ Zone Activated: Strategic liquidity layer detected — mapped through refined supply/demand mechanics. Volatility now rising. This isn’t noise — this is bait for the untrained. We're not them.
🩸 Momentum Signature Detected:
Displacement candle confirms directional intent — AI pattern scan active.
— If upward: Bullish momentum burst.
— If downward: Aggressive bearish rejection.
🦸♂️ Tactical Note:
The kill shot only comes after the trap is exposed and volume betrays their position.

NZDUSD: Market of Sellers
The analysis of the NZDUSD chart clearly shows us that the pair is finally about to tank due to the rising pressure from the sellers.
Disclosure: I am part of Trade Nation's Influencer program and receive a monthly fee for using their TradingView charts in my analysis.
❤️ Please, support our work with like & comment! ❤️

Daily live trade with XAUUSD in 15m/30m/1h 20250616Daily live trade with XAUUSD in 15m/30m/1h 20250616

AUDCAD: Will Start Falling! Here is Why:
Looking at the chart of AUDCAD right now we are seeing some interesting price action on the lower timeframes. Thus a local move down seems to be quite likely.
Disclosure: I am part of Trade Nation's Influencer program and receive a monthly fee for using their TradingView charts in my analysis.
❤️ Please, support our work with like & comment! ❤️

Nzdusd update (Price and Fibonacci)The trade on nzdusd just took us out on profit. T.P has been hit.
After proper analysis and patiently waiting for the market to come to us, we were able to capitalize on this move to the upside and we're out with some profit.

Crude Oil Challenges 2-Year ChannelAmid rising summer demand, an inverted head and shoulders breakout from oversold 2020 levels, and the recent outbreak of war between Israel and Iran, crude oil has tested the upper boundary of the declining channel originating from the 2022 highs. This test comes as supply risks for the coming month intensify.
This upper boundary aligns with the $77 resistance level. A confirmed breakout and sustained hold above this level could shift momentum more decisively to the bullish side, potentially paving the way for a retest of the $80 and $83.50 levels.
On the downside, if oil fails to maintain its gains and resumes a pullback, key support zones are located around $69, $66, and $64, reestablishing bearish dominance within the channel.
— Razan Hilal, CMT

GOLD: Long Signal Explained
GOLD
- Classic bullish formation
- Our team expects pullback
SUGGESTED TRADE:
Swing Trade
Long GOLD
Entry - 3396.6
Sl - 3389.4
Tp - 3413.3
Our Risk - 1%
Start protection of your profits from lower levels
Disclosure: I am part of Trade Nation's Influencer program and receive a monthly fee for using their TradingView charts in my analysis.
❤️ Please, support our work with like & comment! ❤️

Monday Preview SPX rallied overnight, making the the larger C wave down less of a possibility. Gold may fall now that it's tested it's highs. Natural Gas is over resistance and looks like it will go higher. Oil also looking for a bounce today. BTC is above resistance at the moment.
