GOLD - WAVE 5 BULLISH TO $3,622 (UPDATE)Gold moving perfectly, according to our bullish analysis which I posted for you all last week. Gold been bullish for a technical perspective for a while, now we're seeing the elite push out the fundamental factor of the Israel attack on Iran, to help Gold keep moving up.
Gold is still within a 'Bullish Accumulation' phase, hence why it's not moving up very strong. Bare in mind, we are in the FINAL WAVE 5 bullish move on a HTF, so we can experience choppy price action.
Wave Analysis

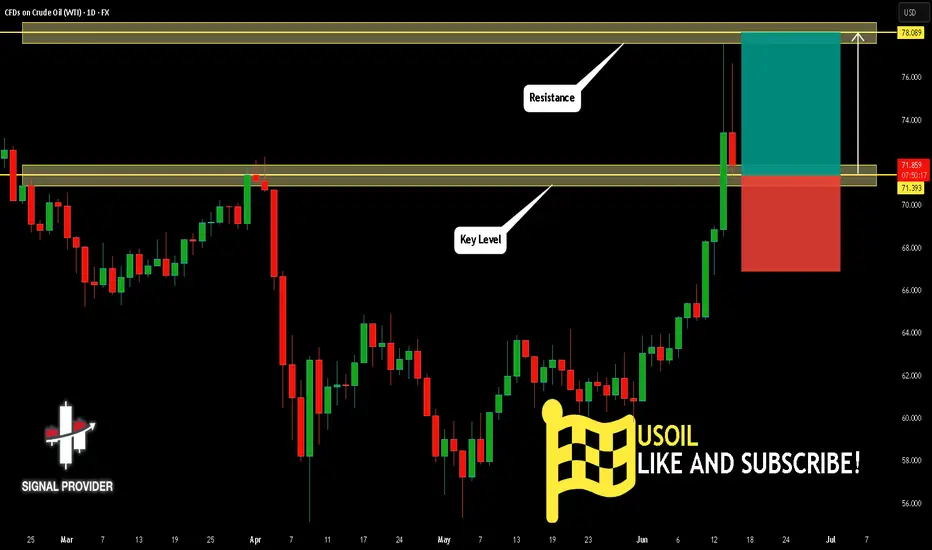
USOIL Will Move Higher! Buy!
Please, check our technical outlook for USOIL.
Time Frame: 1D
Current Trend: Bullish
Sentiment: Oversold (based on 7-period RSI)
Forecast: Bullish
The price is testing a key support 71.393.
Current market trend & oversold RSI makes me think that buyers will push the price. I will anticipate a bullish movement at least to 78.089 level.
P.S
Overbought describes a period of time where there has been a significant and consistent upward move in price over a period of time without much pullback.
Disclosure: I am part of Trade Nation's Influencer program and receive a monthly fee for using their TradingView charts in my analysis.
Like and subscribe and comment my ideas if you enjoy them!
EURUSD Is Bullish! Long!
Here is our detailed technical review for EURUSD.
Time Frame: 3h
Current Trend: Bullish
Sentiment: Oversold (based on 7-period RSI)
Forecast: Bullish
The market is trading around a solid horizontal structure 1.157.
The above observations make me that the market will inevitably achieve 1.165 level.
P.S
Please, note that an oversold/overbought condition can last for a long time, and therefore being oversold/overbought doesn't mean a price rally will come soon, or at all.
Disclosure: I am part of Trade Nation's Influencer program and receive a monthly fee for using their TradingView charts in my analysis.
Like and subscribe and comment my ideas if you enjoy them!

GBPUSD Is Very Bearish! Sell!
Take a look at our analysis for GBPUSD.
Time Frame: 5h
Current Trend: Bearish
Sentiment: Overbought (based on 7-period RSI)
Forecast: Bearish
The market is testing a major horizontal structure 1.357.
Taking into consideration the structure & trend analysis, I believe that the market will reach 1.351 level soon.
P.S
The term oversold refers to a condition where an asset has traded lower in price and has the potential for a price bounce.
Overbought refers to market scenarios where the instrument is traded considerably higher than its fair value. Overvaluation is caused by market sentiments when there is positive news.
Disclosure: I am part of Trade Nation's Influencer program and receive a monthly fee for using their TradingView charts in my analysis.
Like and subscribe and comment my ideas if you enjoy them!

#ZETA/USDT#ZETA
The price is moving within a descending channel on the 1-hour frame, adhering well to it, and is heading towards a strong breakout and retest.
We are experiencing a rebound from the lower boundary of the descending channel. This support is at 0.1933.
We are experiencing a downtrend on the RSI indicator, which is about to break and retest, supporting the upward trend.
We are heading towards stability above the 100 Moving Average.
Entry price: 0.2014
First target: 0.2076
Second target: 0.2144
Third target: 0.2228

GBPUSD BuyBuild up channel and also it is bearish. Price induced channel and should upward to take out liquidity.

At some point,......this thing has to go down, and technically, it still looks like this could be it. It's the monthly, so it could still go sideways for a while, but it looks like a completed channel before the breakdown.

GBPJPY SELLBy utilizing levels, historical patterns, , we can formulate a hypothesis that the market might follow a similar trajectory if bearish sentiment prevails.

USDCAD Is Going Up! Buy!
Please, check our technical outlook for USDCAD.
Time Frame: 2h
Current Trend: Bullish
Sentiment: Oversold (based on 7-period RSI)
Forecast: Bullish
The market is approaching a key horizontal level 1.356.
Considering the today's price action, probabilities will be high to see a movement to 1.360.
P.S
We determine oversold/overbought condition with RSI indicator.
When it drops below 30 - the market is considered to be oversold.
When it bounces above 70 - the market is considered to be overbought.
Disclosure: I am part of Trade Nation's Influencer program and receive a monthly fee for using their TradingView charts in my analysis.
Like and subscribe and comment my ideas if you enjoy them!

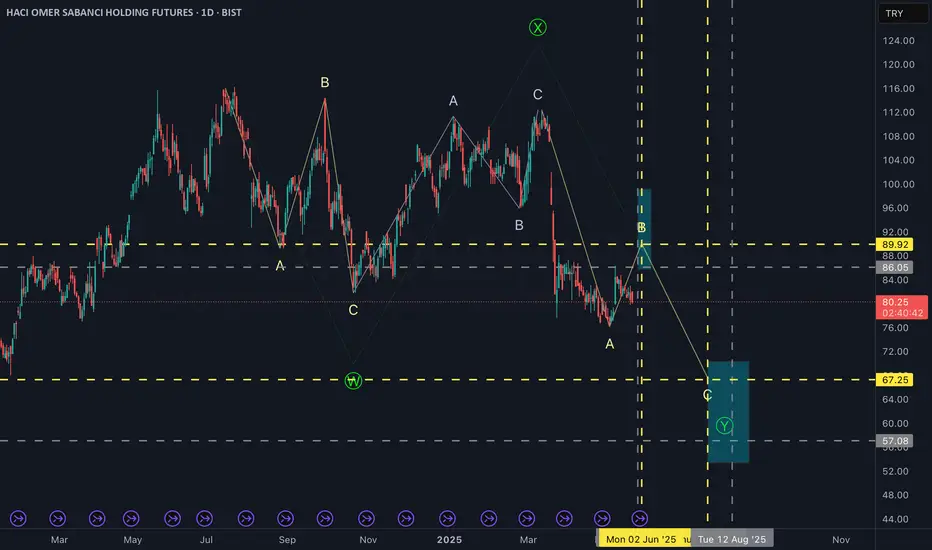
SAHOL2! — 1DThe correction that began in mid-July 2024 does not appear to be complete yet. I interpret this movement as a WXY pattern, and it seems to be in the second sub-wave of the Y wave. I have marked the potential zones (green areas) and the key reversal levels within those zones with yellow lines.
Long on Gold, Scalp, R/R: 1/3
Hello guys,
A small scalp on gold — long position with a risk/reward ratio of 1:3.
DXY ||| • Sell Completed Below Orange Line📉 Pair: GBP/USD
⏱ Timeframe: 4H
🔶 Orange Line = Major S/R Zone
📌 Confirmed Break + Retest
🎯 Profit Locked | Risk Managed
Strategy: Elliott Wave + Parallel Channel + SMC (Break of Structure)
🔶 Status:
Completed Wave 5 inside falling wedge
Sell executed after orange support break
Anticipating accumulation phase > BOS > bullish reversal
📍Key Zones:
Demand zone near 97.455
Resistance near 98.426
🎯 Next Steps: Looking for bullish structure post BOS + Wave 2 pullback.
🔁 Watch for:
Accumulation near lower trendline
Structure shift > Breakout of wedge
Long confirmations in late July – early August
🟢 Plan the trade, trade the plan.

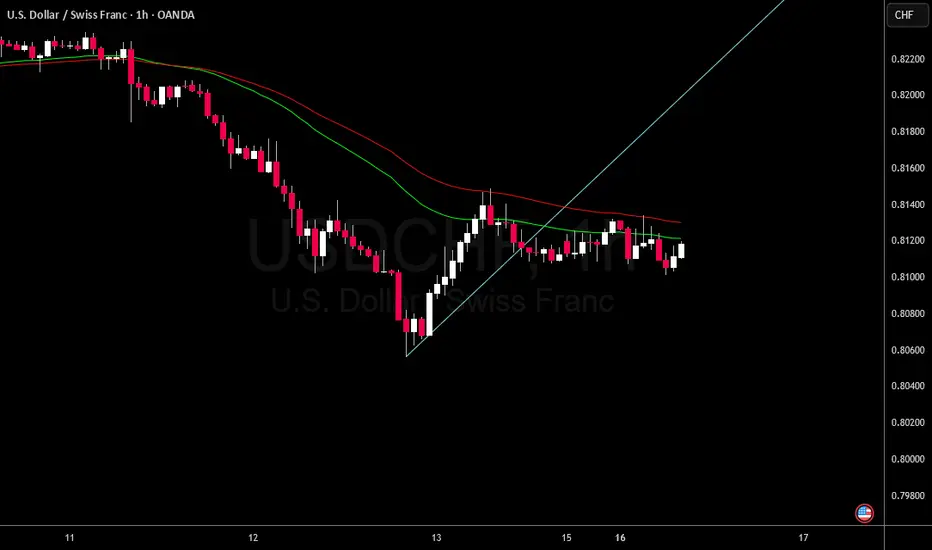
NZDCAD Is Going Down! Sell!
Take a look at our analysis for NZDCAD.
Time Frame: 1h
Current Trend: Bearish
Sentiment: Overbought (based on 7-period RSI)
Forecast: Bearish
The market is testing a major horizontal structure 0.825.
Taking into consideration the structure & trend analysis, I believe that the market will reach 0.822 level soon.
P.S
Overbought describes a period of time where there has been a significant and consistent upward move in price over a period of time without much pullback.
Disclosure: I am part of Trade Nation's Influencer program and receive a monthly fee for using their TradingView charts in my analysis.
Like and subscribe and comment my ideas if you enjoy them!

GOLD Is Very Bullish! Buy!
Please, check our technical outlook for GOLD.
Time Frame: 9h
Current Trend: Bullish
Sentiment: Oversold (based on 7-period RSI)
Forecast: Bullish
The market is approaching a key horizontal level 3,327.72.
Considering the today's price action, probabilities will be high to see a movement to 3,385.41.
P.S
Please, note that an oversold/overbought condition can last for a long time, and therefore being oversold/overbought doesn't mean a price rally will come soon, or at all.
Disclosure: I am part of Trade Nation's Influencer program and receive a monthly fee for using their TradingView charts in my analysis.
Like and subscribe and comment my ideas if you enjoy them!

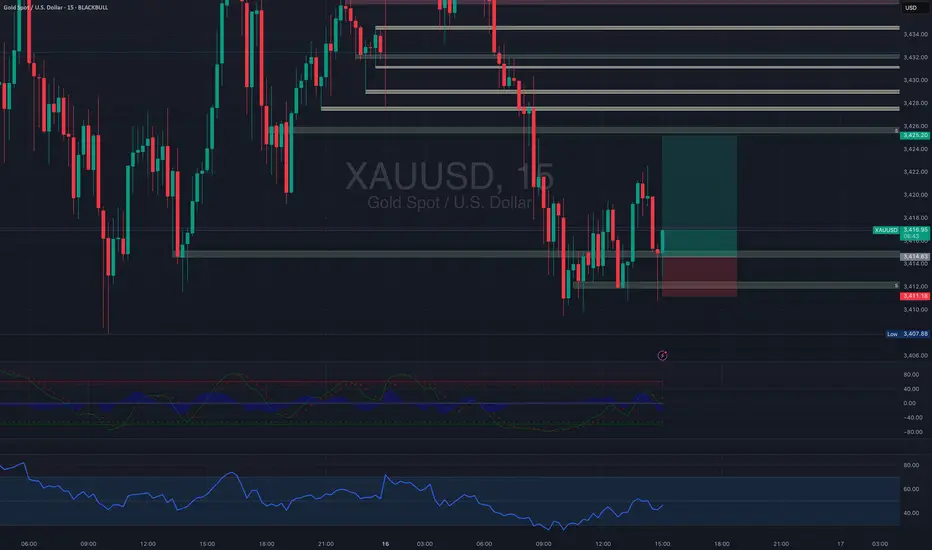
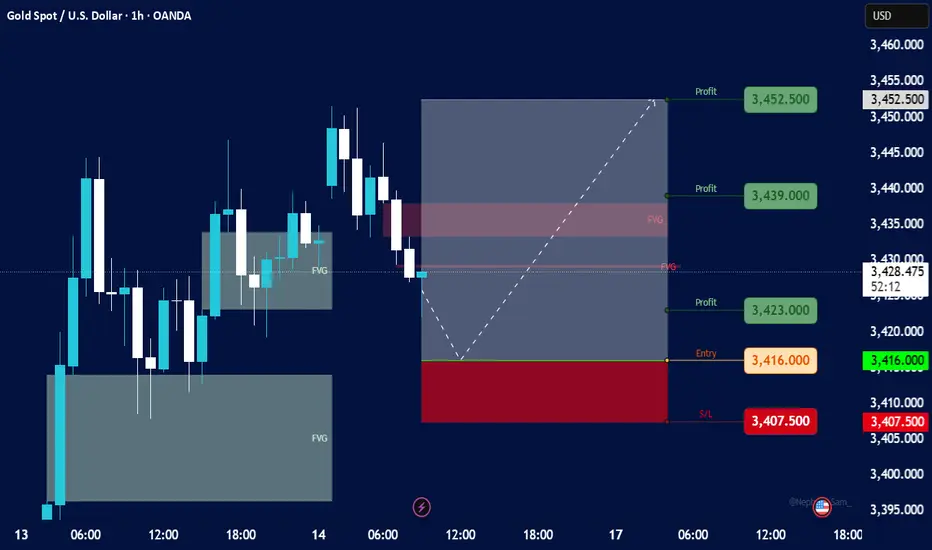
xauusd Entry Level:
3,416.000 USD
Price is currently at 3,425.640 USD, so the entry was already triggered and the position is active and in profit.
Stop-Loss (SL):
3,407.500 USD
Positioned below the minor FVG area; protects against deeper downside if structure fails.
Take-Profit Targets (TP):
TP1: 3,423.000 USD (short-term scalp zone — already reached)
TP2: 3,439.000 USD (medium-term resistance)
TP3: 3,452.500 USD (strong upside target; likely near a previous high)
Shift Stop to entry after reaching TP1
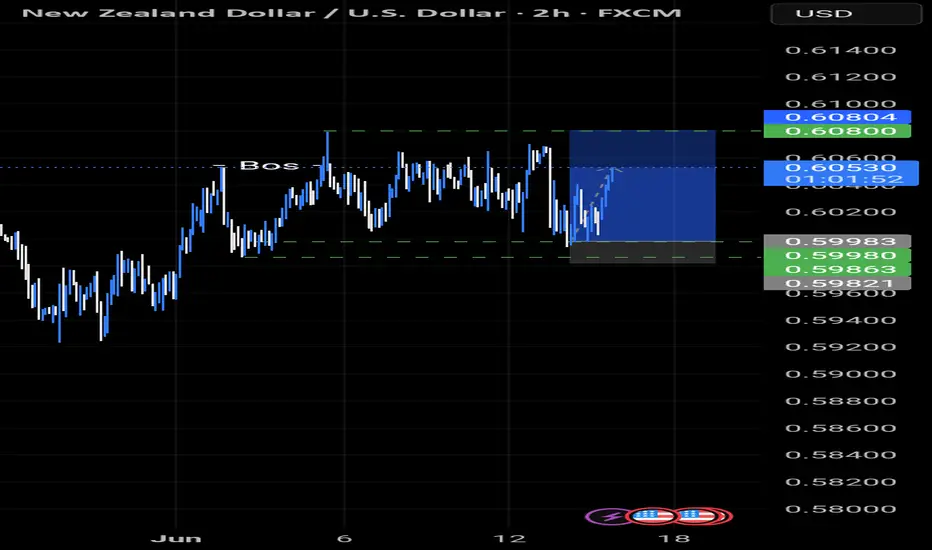
Nzdusd update On nzdusd, we're clear to the upside.
Trade management is key to ensure profits are maximized properly
AUDUSD Will Fall! Short!
Take a look at our analysis for AUDUSD.
Time Frame: 3h
Current Trend: Bearish
Sentiment: Overbought (based on 7-period RSI)
Forecast: Bearish
The market is on a crucial zone of supply 0.650.
The above-mentioned technicals clearly indicate the dominance of sellers on the market. I recommend shorting the instrument, aiming at 0.647 level.
P.S
We determine oversold/overbought condition with RSI indicator.
When it drops below 30 - the market is considered to be oversold.
When it bounces above 70 - the market is considered to be overbought.
Disclosure: I am part of Trade Nation's Influencer program and receive a monthly fee for using their TradingView charts in my analysis.
Like and subscribe and comment my ideas if you enjoy them!

BTC/USDT: Sector Momentum and Decision Zone Ahead of the Fed__________________________________________________________________________________
Technical Overview – Summary Points
➤ Strong multi-timeframe bullish momentum, confirmed by the Risk On / Risk Off Indicator signaling “Strong Buy” across all timeframes (daily, 12H, 6H, 4H down to intraday).
➤ Major supports (102,600–104,250 $) act as the market’s anchor; the 105,800–106,100 $ resistance remains the key level to break for a confirmed further bullish leg.
➤ Volumes are weak to normal, with no recent distribution, climax, or panic/extreme behavior (ISPD DIV neutral); market remains rational.
➤ Short-term TFs (1H, 2H) are more hesitant—favoring consolidation/range, suitable for scalping or risk management rather than directional breakout trades.
__________________________________________________________________________________
Strategic Summary
➤ Dominant bullish technical context, but facing key resistance, with macro and on-chain signaling for active caution.
➤ Opportunity: Buying pullbacks on 104,250–102,600 $, targeting extension if clean breakout above 106,100 $. Partial profit-taking into the 110–111k $ highs.
➤ Risk zone: Invalidation if there is a decisive break <102,000 $ or major red volume climax on failed resistance retest.
➤ Key catalysts this week: Fed/FOMC decision, major geopolitical events.
➤ Plan: Favour methodical accumulation pre-Fed, reinforce/swing post-announcement according to technical resolution.
__________________________________________________________________________________
Multi-Timeframe Analysis
1D : Trading below broad 105,800–111,000 $ resistance, Risk On / Risk Off Indicator strongly positive, normal volumes, no euphoria (ISPD DIV neutral). Healthy structure, upward bias confirmed.
12H/6H : Consolidation at major support; recent rebounds from 102–104k, no exhaustion signals. MTFTI Up but 2H-1H corrective divergence.
4H/2H : Range market, major supports defended, no breakout yet. MTFTI locally Down, indicating mild internal corrective dynamic.
1H/30min/15min : Intraday range, technical micro-bounces, weak directional bias, moderate volumes, no abnormal behavior. Scalping preferred below resistance, rigorous risk management.
Risk On / Risk Off Indicator : Strong aligned buy signal across all TFs, sector environment supportive.
__________________________________________________________________________________
Multi-Timeframe Key Points Summary
Strong bullish market, behavioral and technical stability.
Breakout >106,100 $ = legitimate bullish extension, 110k+ target.
Invalidation below 102k $: go to cash, wait for stabilization.
Volatility expected around (Fed/geopolitical) events: adjust sizing/stops accordingly.
__________________________________________________________________________________
Fundamental, Macro & On-Chain Analysis
Fed (FOMC June 17–18): Major breakout/volatility catalyst.
Geopolitical tensions (Israel/Iran): Risk-off spikes expected, watch liquidity zones.
On-chain: Key support at 100–102k $; no major distribution, long-term holders remain strong, options/futures point to underpriced volatility risk.
Strategy: Prefer gradual accumulation on supports, reduce exposure pre-Fed, confirm new swings post-FOMC.
__________________________________________________________________________________
Action Plan Summary
Accumulate on pullback 104,250–102,600 $, stop below 101,900 $.
Breakout >106,100 $: Target 110k–111k $, partial TP, monitor volume/volatility.
Avoid overtrading pre-FOMC or amid major geopolitical news.
Risk/Reward >2 on pullback – strict management mandatory.
__________________________________________________________________________________
Conclusion & Context Mastery
The market remains structurally bullish and supported by the combination of technical, sector and on-chain factors. However, macro/geopolitical volatility requires increased caution as the FOMC approaches. Focus on support entries, avoid chasing resistance until confirmed, and apply tight stops in this catalyst-rich context.
__________________________________________________________________________________

Gbpaud update We're also clear to the downside on gbpaud.
We all have to just manage the trade so as to ensure profits

EURJPY Will Go Higher From Support! Buy!
Please, check our technical outlook for EURJPY.
Time Frame: 6h
Current Trend: Bullish
Sentiment: Oversold (based on 7-period RSI)
Forecast: Bullish
The price is testing a key support 164.890.
Current market trend & oversold RSI makes me think that buyers will push the price. I will anticipate a bullish movement at least to 166.192 level.
P.S
Overbought describes a period of time where there has been a significant and consistent upward move in price over a period of time without much pullback.
Disclosure: I am part of Trade Nation's Influencer program and receive a monthly fee for using their TradingView charts in my analysis.
Like and subscribe and comment my ideas if you enjoy them!

GBPUSD Will Move Higher! Buy!
Take a look at our analysis for GBPUSD.
Time Frame: 1h
Current Trend: Bullish
Sentiment: Oversold (based on 7-period RSI)
Forecast: Bullish
The price is testing a key support 1.349.
Current market trend & oversold RSI makes me think that buyers will push the price. I will anticipate a bullish movement at least to 1.352 level.
P.S
The term oversold refers to a condition where an asset has traded lower in price and has the potential for a price bounce.
Overbought refers to market scenarios where the instrument is traded considerably higher than its fair value. Overvaluation is caused by market sentiments when there is positive news.
Disclosure: I am part of Trade Nation's Influencer program and receive a monthly fee for using their TradingView charts in my analysis.
Like and subscribe and comment my ideas if you enjoy them!
