USDCAD 15 MINUTEYour chart on USD/CAD (15-minute timeframe) clearly shows a bearish breakdown from the ascending trendline, and here’s a quick analysis based on what you’ve marked:
---
📉 Technical Breakdown
🔻 Trendline Broken: Price has broken below the ascending trendline, indicating loss of bullish momentum.
🧱 Register Support (turned resistance): Price rejected after testing this area – confirms a bearish flip.
🧭 Support Zone (gray box): Price is currently testing this level. If it breaks below, continuation to TP is likely.
🎯 Target TP: Marked around 1.3625–1.3630, showing good confluence with prior swing lows.
---
✅ Bearish Bias Confirmation
This looks like a textbook setup:
Break of trendline ✅
Retest of broken support (now resistance) ✅
Wave Analysis

Market Overview
WHAT HAPPENED?
Strong sales resumed last week after a short period of growth. This was provoked by the escalation of the conflict in the Middle East.
After testing and fixing the $105,800-$104,500 zone (accumulated volumes), strong volume deviations appeared, which should be perceived as protection on the part of the buyer.
WHAT WILL HAPPEN: OR NOT?
At the moment, an attempt is being made to position the volumes accumulated in the range of $105,600-$104,700 in the direction of growth. Strong support has already been formed in the area of $104,000-$102,900 (abnormal volumes).
When the four-hour candle closes above the $106,400 mark, it’ll be possible to additionally consider the zone of accumulated volumes for buys (if there is a reaction from it).
The main scenario is a long position with targets up to the nearest resistance. In case of easing of geopolitical tensions, there remains the possibility of updating the ATH.
Alternative scenario: correction to the support zone of $101,600-$100,000 (volume anomalies). With this development, a prolonged rebound is possible.
Sell Zones:
$109,000–$110,000 (accumulated volume)
Buy Zones:
$105,600–$104,700 (accumulated volume)
$104,000–$102,900 (volume anomalies)
$101,600–$100,000 (significant volume anomalies)
$98,000–$97,200 (local support)
Level at $93,000
$91,500–$90,000 (strong buying imbalance)
IMPORTANT DATES
Macroeconomic developments this week:
• Tuesday, June 17, 03:00 (UTC) — publication of the Japanese interest rate decision;
• Tuesday, June 17, 12:30 (UTC) — publication of the core retail sales index for May in the United States, the volume of retail sales for May in the United States;
• Wednesday, June 18, 06:00 (UTC) — publication of the UK consumer price index compared to May last year;
• Wednesday, June 18, 9:00 (UTC) — publication of the consumer price index in the Eurozone compared to May last year;
• Wednesday, June 18, 12:30 (UTC) — publication of the number of initial applications for US unemployment benefits;
• Wednesday, June 18, 18:00 (UTC) — publication of FOMC economic forecasts, FOMC statement, US Federal Reserve interest rate decision;
• Wednesday, June 18, 18:30 (UTC) — US FOMC Press Conference;
• Thursday, June 19, 7:30 (UTC) — publication of the Q2 interest rate decision in Switzerland;
• Thursday, June 19, 8:00 (UTC) — press conference of the National Bank of Switzerland;
• Thursday, June 19, 11:00 (UTC) — publication of the June interest rate decision in the UK;
• Thursday, June 19, 12:30 (UTC) — publication of the number of initial applications for unemployment benefits in the United States;
• Friday, June 20, 12:30 (UTC) — publication of the Philadelphia Federal Reserve's index of manufacturing activity for June in the United States.
*This post is not a financial recommendation. Make decisions based on your own experience.
#analytics

GOLD BEARS WILL DOMINATE THE MARKET|SHORT
GOLD SIGNAL
Trade Direction: short
Entry Level: 3,419.53
Target Level: 3,348.85
Stop Loss: 3,466.65
RISK PROFILE
Risk level: medium
Suggested risk: 1%
Timeframe: 6h
Disclosure: I am part of Trade Nation's Influencer program and receive a monthly fee for using their TradingView charts in my analysis.
✅LIKE AND COMMENT MY IDEAS✅

AUD/CHF SENDS CLEAR BEARISH SIGNALS|SHORT
AUD/CHF SIGNAL
Trade Direction: short
Entry Level: 0.528
Target Level: 0.525
Stop Loss: 0.530
RISK PROFILE
Risk level: medium
Suggested risk: 1%
Timeframe: 1h
Disclosure: I am part of Trade Nation's Influencer program and receive a monthly fee for using their TradingView charts in my analysis.
✅LIKE AND COMMENT MY IDEAS✅

NZD/CHF BEARS ARE GAINING STRENGTH|SHORT
Hello, Friends!
It makes sense for us to go short on NZD/CHF right now from the resistance line above with the target of 0.487 because of the confluence of the two strong factors which are the general downtrend on the previous 1W candle and the overbought situation on the lower TF determined by it’s proximity to the upper BB band.
Disclosure: I am part of Trade Nation's Influencer program and receive a monthly fee for using their TradingView charts in my analysis.
✅LIKE AND COMMENT MY IDEAS✅

Bullish ContinuationTrend is UP it came down to refill liquidity.....Price Action confirms that it want to continue its UP Trend

AUD/NZD SELLERS WILL DOMINATE THE MARKET|SHORT
Hello, Friends!
Bearish trend on AUD/NZD, defined by the red colour of the last week candle combined with the fact the pair is overbought based on the BB upper band proximity, makes me expect a bearish rebound from the resistance line above and a retest of the local target below at 1.074.
Disclosure: I am part of Trade Nation's Influencer program and receive a monthly fee for using their TradingView charts in my analysis.
✅LIKE AND COMMENT MY IDEAS✅

GBP/USD LONG FROM SUPPORT
Hello, Friends!
GBP/USD pair is trading in a local uptrend which know by looking at the previous 1W candle which is green. On the 4H timeframe the pair is going down. The pair is oversold because the price is close to the lower band of the BB indicator. So we are looking to buy the pair with the lower BB line acting as support. The next target is 1.358 area.
Disclosure: I am part of Trade Nation's Influencer program and receive a monthly fee for using their TradingView charts in my analysis.
✅LIKE AND COMMENT MY IDEAS✅

EUR/USD - Upside Bias Continues Amid Market EventsHi Everyone,
As outlined in our analysis last week, we continue to expect EUR/USD to advance further to the upside. A successful retest of the 1.15240 level provides support for the move.
This promises to be an eventful week as markets navigate geopolitical tensions and upcoming central bank decisions. As long as price holds above 1.14483, we anticipate a continuation higher toward the 1.16564 level, which would further reinforce our long-term bullish outlook.
A confirmed break above this resistance would likely open the door for a move toward 1.18325, where we anticipate encountering dynamic resistance.
We will provide further updates on the projected path for EUR/USD should price reach this level.
The longer-term outlook remains bullish, with expectations for the rally to extend toward the 1.2000 level, provided the price holds above the key support at 1.10649.
We will continue to update you throughout the week with how we’re managing our active ideas and positions. Thanks again for all the likes/boosts, comments and follows — we appreciate the support!
All the best for a good end to the week. Trade safe.
BluetonaFX

NZD/USD BEARS ARE STRONG HERE|SHORT
NZD/USD SIGNAL
Trade Direction: short
Entry Level: 0.605
Target Level: 0.602
Stop Loss: 0.606
RISK PROFILE
Risk level: medium
Suggested risk: 1%
Timeframe: 1h
Disclosure: I am part of Trade Nation's Influencer program and receive a monthly fee for using their TradingView charts in my analysis.
✅LIKE AND COMMENT MY IDEAS✅

AUD/USD BULLISH BIAS RIGHT NOW| LONG
Hello, Friends!
AUD/USD pair is in the downtrend because previous week’s candle is red, while the price is clearly falling on the 15m timeframe. And after the retest of the support line below I believe we will see a move up towards the target above at 0.651 because the pair oversold due to its proximity to the lower BB band and a bullish correction is likely.
Disclosure: I am part of Trade Nation's Influencer program and receive a monthly fee for using their TradingView charts in my analysis.
✅LIKE AND COMMENT MY IDEAS✅

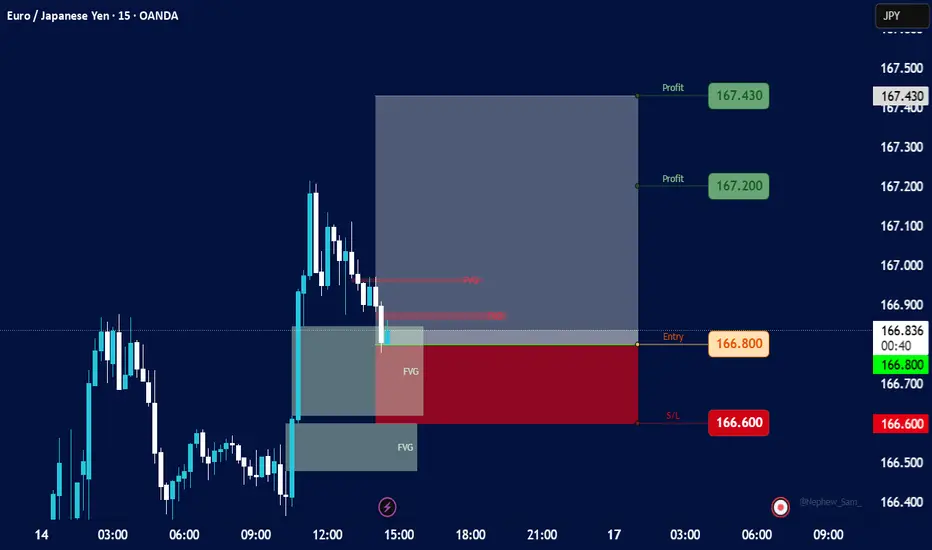
EURJPY✅ Trade Plan (Long Setup):
Entry 166.800
Stop Loss (SL) 166.600
Take Profit 1 (TP1) 167.200
Take Profit 2 (TP2) 167.430
shift stop to entry after TP1
USD/JPY SELLERS WILL DOMINATE THE MARKET|SHORT
Hello, Friends!
USD-JPY uptrend evident from the last 1W green candle makes short trades more risky, but the current set-up targeting 144.203 area still presents a good opportunity for us to sell the pair because the resistance line is nearby and the BB upper band is close which indicates the overbought state of the USD/JPY pair.
Disclosure: I am part of Trade Nation's Influencer program and receive a monthly fee for using their TradingView charts in my analysis.
✅LIKE AND COMMENT MY IDEAS✅

USD/CHF BEARS ARE GAINING STRENGTH|SHORT
USD/CHF SIGNAL
Trade Direction: short
Entry Level: 0.821
Target Level: 0.815
Stop Loss: 0.826
RISK PROFILE
Risk level: medium
Suggested risk: 1%
Timeframe: 9h
Disclosure: I am part of Trade Nation's Influencer program and receive a monthly fee for using their TradingView charts in my analysis.
✅LIKE AND COMMENT MY IDEAS✅

BILDCO (ADX) Bulls are Loading🔥 BILDCO (ADX) – 2H Timeframe
“BILDCO just dropped the hammer with that BOS confirmation. ABC correction’s done, accumulation is real. Bulls are loading. With structure flipping bullish and a clean Wave 3 setup in motion, this could rip hard to 1.30+.”
Elliott Wave Breakdown:
✅ Completed ABC correction into Demand Zone
🔺 Wave (1) and (2) of new impulse appear complete
✅ Break of Structure (BOS) confirmed at 0.745
🔼 Bullish trajectory projecting into Wave (3) → (4) → (5) targeting 1.30–1.38
🎯 Trade Setup
Parameter Level
Entry 0.76 (current zone)
Stop Loss Below 0.74 (BOS zone)
Take Profit 1.30 / 1.38
Risk/Reward ~1:3.5+
“Structure tells the story. Volume confirms the chapter. The wave shows the climax.”
⚠️ Disclaimer
Educational content only. This is not financial advice. Trade at your own risk and use proper risk management.

MARKET TECHNICAL BREAK DOWN FOR 16TH TO 20TH JUNE📊 Market Technical Breakdown – EURUSD, AUDUSD, XAUUSD & BTCUSDT 🔍
Traders,
Get ready for this week’s precision-driven analysis across four major markets:
✅ EURUSD – Is the euro gaining strength or facing more downside?
✅ AUDUSD – Key zones to watch as the Aussie reacts to USD data.
✅ XAUUSD (Gold) – Will gold hold strong or give in to bearish pressure?
✅ BTCUSDT – Bitcoin’s momentum shift: Are bulls still in control?
This breakdown covers:
🔹 Clean chart analysis
🔹 Key levels (support & resistance)
🔹 Trade ideas with potential entries & exits
🔹 My personal trading insight for each pair
🎯 Whether you're a beginner or a seasoned trader, this breakdown will help sharpen your bias and build confidence in your trades.
👉 Watch the video till the end to catch all setups, confirmations, and bonus tips for the week.
Drop a comment if you found it helpful or want to see a pair included in the next breakdown!

$MGC / $GC / Gold - Pre Market Update - June 16Hello Fellow Gamblers,
This dip on gold is tracking with our Wave 4 dip. If the level hold we're going towards Wave 5 at 3504 and above.
Losing 3416 can trigger price to retrace all the way down towards 3358.
- Levels to Watch: 3504, 3416, 3358, 3283

CGPTUSDT 300% Summer?Elliot Impulse Wave 12345 has brought us up from the lows and the Correction Wave ABC potentially done. ATM the price is bouncing from the "golden pocket" area and the Cipher B is printing green on a Daily Time Frame providing confidence of reversal to the upside. There are some minor fvgs (Fair Value Gaps) to be filled beneath us around the fib 0.786 but if the Daily candle closes like this without any major wick I think we are clear. Potential short term upside target would be the important fib lines from the previous highs around 0.40$ and then re-evaluate. Mind also the development of BTC that leads the way.

Silver Gains on Tensions, Eyes on FedFriday’s strong U.S. data may support the dollar, as the University of Michigan’s Consumer Sentiment Index rose to 60.5 in June from 52.2, beating forecasts of 53.5 and marking the first gain in six months.
Geopolitical tensions continue to drive safe-haven demand, especially for silver. Israel struck Iranian nuclear and missile sites Friday, killing military officials. On Sunday, Iran began its fourth phase of response, warning of firm retaliation to further Israeli actions.
Markets now turn to Wednesday’s Fed meeting. While rates are expected to stay unchanged, futures still price in two cuts this year, possibly starting in September, supported by last week’s soft inflation data.
Resistance is set at 36.90, while support stands at 35.40.

Bull the XAUUSEAfter the liquidity sweep can and confirmed rejection can buy first TP 3436 and second TP 3445, but if the OB break by the price then after confirmation can sell first TP 3400 and second TP 3390

USDJPY;;;;;; STRONG SELL AND HOLDThe wait was on the volume imbalance at 146...to be test, now that the market has tested it, it gives us the idea of how strong it is, therefore the market will continue to go downward in search of a strong support... so you can have your tp1 at 142 and tp2 at140

Pound Stable as Markets Eye BoE, Fed MovesGBP/USD remains below Friday’s three-year high, trading around the mid-1.3500s in a narrow range during Monday’s Asian session. The pair shows limited downside as traders await a busy week of key data and central bank decisions.
Markets are watching the UK CPI on Wednesday and the Bank of England’s policy announcement on Thursday, both crucial for the Pound. The US Federal Reserve will also decide on rates Wednesday, likely guiding the dollar’s short-term path.
Friday’s UK GDP showed a 0.3% contraction in April, increasing bets on faster BoE rate cuts. The USD is supported by safe-haven flows due to Middle East tensions, though soft US inflation data has raised expectations for Fed cuts by September. A broadly positive global risk mood is offering some support to GBP/USD.
Resistance is at 1.3600, with support around 1.3425.
ES1!/SP500 Targeting Weekly Range Resistance***QUOTING SEP CONTRACT FOR JUNE CONTRACT OR CASH US500 EQUIVALENT LEVELS SUBTRACT ~52 POINTS***
***WEEKLY ACTION AREA VIDEO TO FOLLOW AHEAD OF NY OPEN***
WEEKLY BULL BEAR ZONE 6090/6100
WEEKLY RANGE RES 6150 SUP 5914
DAILY RANGE RES 6090 SUP 5972
DAILY VWAP BULLISH 6019
WEEKLY VWAP BULLISH 5923
DAILY BALANCE - 6064/5965
WEEKLY ONE TIME FRAMING UP - 5965
MONTHLY ONE TIME FRAMING UP
GAP LEVELS 5843/5741/5710/5339
Balance: This refers to a market condition where prices move within a defined range, reflecting uncertainty as participants await further market-generated information. Our approach to balance includes favoring fade trades at the range extremes (highs/lows) while preparing for potential breakout scenarios if the balance shifts.
One-Time Framing Up (OTFU): This represents a market trend where each successive bar forms a higher low, signaling a strong and consistent upward movement.
One-Time Framing Down (OTFD): This describes a market trend where each successive bar forms a lower high, indicating a pronounced and steady downward movement.
GOLDMAN SACHS TRADING DESK VIEWS
Weekend Cross-Asset Dislocations (15-Jun-2025)
Oil Options Positioning Reaches Extreme Levels
On Friday, call buying in oil pushed the put-call skew to one of its most extreme levels in over 25 years. This indicates that investors are positioning for significant upside asymmetry. Notably, the shift in the put-call skew far exceeded the movement in near-term oil futures, compared to similar past episodes.
AI-Related Capex Remains Steady
Our analysts report that capex spending for 2025 and 2026 by the six largest hyperscalers has remained stable over the past few months. Bearish investors might interpret the absence of upward revisions as a sign of slowing momentum in the broader AI sector. Conversely, bullish investors could view the rebound in stock prices as a signal of growing confidence in hyperscalers and other AI-exposed companies to generate revenue sufficient to support planned capex.
Sector-Specific Divergences in Put-Call Skew
Friday saw notable divergences in put-call skew across sectors, highlighting the varied impact of global events. Increased call-buying pressure in energy aligns with the extreme shift in oil’s put-call skew. Meanwhile, rising put-call skew in Materials and Financials reflects heightened downside concerns, with Materials put-buying signaling fears of a broader economic slowdown.
Balanced Positioning in Single Stock Put-Call Skew
Despite sector-specific disparities, single-stock positioning remains balanced. The average stock’s put-call skew has returned to levels seen in March 2025, before the US tariff announcements.
IG Credit Spreads Tight Relative to Equities
Investment-grade (IG) equity investors appear more cautious than their credit counterparts, likely due to elevated uncertainty around US interest rates. A potential rate increase could disproportionately impact IG equity valuations.
Retail Investor Activity Remains Stable
Retail investor volumes have aligned with their five-year average, suggesting they remain engaged but have not been a dominant driver of equity performance in recent weeks. For single stocks, retail investors have been in a holding pattern, having shifted from net buyers earlier this year to small net sellers recently. This suggests they may be waiting for a broader market dip to resume buying.
SPX Daily Options Pricing Reflects Steady Volatility
SPX options are pricing daily moves between 0.9% and 1.2% over the next four weeks. Notably, options for this week’s FOMC meeting are pricing a relatively low ±0.9% move. While a ±1.2% move is priced for July 7, uncertainty remains regarding the volatility impact of the tax bill and the end of the 90-day tariff pause.
Professional Investors Maintain Cautious Stance
Entering 2025, professional investors significantly reduced their demand for leveraged equity exposure through futures, swaps, and options, signaling potential downside risks. While this trend has continued, the pace of selling has slowed in recent weeks, making the cautionary signal less alarming.
Wednesday marks the VIX expiry, which we believe has been supporting the market. Thursday is a market holiday, and Friday brings option expiry, likely leading to a high out-of-office session as risk-taking eases. The market may challenge crowded trades, with "short oil" being noted as particularly crowded.
1. Positioning (i): Hedge funds have been buying U.S. equities for six consecutive weeks, with net leverage exceeding 50% after reaching a five-year low in April. Despite a generally bearish outlook, investors are positioned bullishly due to limited alternatives.
2. Positioning (ii): Sector flows show increased risk aversion, with strong demand in utilities and significant supply in consumer discretionary sectors.
3. Positioning (iii): The systematic community remains long on stocks and is unlikely to sell significantly unless conditions worsen. The key level to watch in the SPX is 5800, both medium-term and short-term.
4. Flows (i): The long-only community has finally turned to buying stocks after three weeks of selling imbalances, ending $10 billion better to buy across all sectors.
5. Flows (ii): As the June expiry approaches, SPX call open interest is at an all-time high with 8.7 million contracts.
6. Trades (i): In derivatives, there have been buyers of VIX puts extending to July, with a significant premium built into the VIX curve. SPX realized volatility is at 12, while July VIX is nearly double that. Outright puts are intriguing, and some VIX puts were traded contingent on SPX falling below a certain level.
7. Trades (ii): Our cash desk believes the AI theme is gaining momentum. Callahan notes the increased visibility around GenAI as the biggest takeaway from the week. The Ellison earnings transcript highlights "astronomical" demand.
8. Trades (iii): The Goldman Sachs house view and consensus suggest that gold will continue its rapid rise. A July 97% put costs 100 basis points, representing the maximum loss premium paid.
