GBP-JPY Free Signal! Sell!
Hello,Tra ders!
GBP-JPY is retesting a
Horizontal resistance
Around 196.700 and
We will be expecting a
Bearish pullback so we
Can enter a short trade
With the Take Profit
Of 195.865 and the
Stop Loss of 196.887
Sell!
Comment and subscribe to help us grow!
Check out other forecasts below too!
Disclosure: I am part of Trade Nation's Influencer program and receive a monthly fee for using their TradingView charts in my analysis.
Wave Analysis

Bitcoin hits new uptime milestone!
Bitcoin has traded above $100,000 for more than 40 consecutive days since May 7, a major milestone for the top cryptocurrency, which has also surpassed 6,000 consecutive days of uptime this month.
BTC unaffected by global events
On June 19, Bitcoin recorded more than 40 consecutive days of trading above $100,000, despite uncertainty and heightened geopolitical tensions in the Middle East. According to Coingecko data, May 8 was the last trading day for BTC below $100,000, meaning that as of June 19, it had been above this level for 42 days.
Meanwhile, Blockchair data shows that BTC has been above $100,000 for 43 days, forming a new resistance level, which some technical analysts believe. During this period, BTC hit a new all-time high on May 23, surpassing the milestone previously reached on January 20. As of this writing, the top cryptocurrency is trading just above $104,000, which is familiar territory for BTC in June.
Prior to BTC’s return to six figures in U.S. dollar terms in early May, BTC spent more than 60 days trading below $100,000 amid global market turmoil caused by the trade war sparked by U.S. President Donald Trump’s “reciprocal tariffs.” At the time, BTC’s significant correlation with traditional assets and markets seemed to weaken its claim as a safe haven asset.
However, since dropping below $75,000 on April 7, BTC has trended upward, rising by about 50% to near $112,000 about 45 days later. Since then, BTC has fluctuated between $110,000 and $100,000, with major global events, including Israel’s launch of its attack on Iranian nuclear facilities, seemingly failing to push it below $100,000, according to Coingecko data.
Not only has the flagship cryptocurrency remained above $100,000 for more than 40 consecutive days, it also celebrated a significant operational achievement in June: more than 6,000 days of continuous uptime.
According to Bitbo, the Bitcoin network has been operating uninterruptedly since its inception at 02:54:25 GMT on January 3, 2009. Aside from two isolated incidents in its early history (one in 2010 and one in 2013), this uptime record has remained unimpaired, highlighting the network’s unparalleled resilience and robustness. These recent achievements further solidify BTC’s place as a stable and enduring digital asset and an increasingly established player in the global financial landscape.

BTCUSDT.DBTCUSDT.D
ALT SESON COMING SOON
This is my opinion: Bitcoin dominance has reached its top and might show a breakout to the upside, but it could turn out to be a fake breakout. Overall, we should expect a decline in BTC dominance and the beginning of capital inflow into altcoins. Perhaps if there hadn’t been negative news, this shift would have happened sooner. Altseason might be approaching.”

MUBARAK Analysis (12H)Note: This is a risky and highly volatile meme coin.
It appears that the bullish X wave has ended at the point where we placed the red arrow on the chart, and the price has now entered a corrective phase once again. This correction seems to be forming a diagonal pattern, and we are currently in wave F of this structure.
If the price reaches the green zone, we can look for potential buy/long positions.
Targets are marked on the chart, with the main target being the flip zone.
A daily candle closing below the invalidation level would invalidate this view.
For risk management, please don't forget stop loss and capital management
Comment if you have any questions
Thank You

ETHUSD Will Go Down! Sell!
Take a look at our analysis for ETHUSD.
Time Frame: 1D
Current Trend: Bearish
Sentiment: Overbought (based on 7-period RSI)
Forecast: Bearish
The market is on a crucial zone of supply 2,415.11.
The above-mentioned technicals clearly indicate the dominance of sellers on the market. I recommend shorting the instrument, aiming at 1,957.20 level.
P.S
Please, note that an oversold/overbought condition can last for a long time, and therefore being oversold/overbought doesn't mean a price rally will come soon, or at all.
Disclosure: I am part of Trade Nation's Influencer program and receive a monthly fee for using their TradingView charts in my analysis.
Like and subscribe and comment my ideas if you enjoy them!

BNL LONG TRADE (THIRD STRIKE) 16-06-2025BNL Long Trade (Third Strike)
Rationale: After its inception in PSX in 2013, BNL went into a tremendous uptrend, reaching a high of Rs. 61.7, then corrected and down trended to Rs. 12. The stock consolidated for 4 years between Rs. 49 and Rs. 12. Recent rally broke out of this accumulation zone, creating bullish FVGs and IFDZS for a safe long trade entry.
🚨 TECHNICAL BUY CALL – BNL🚨
- Buy 1: Rs. 45.90
- Buy 2: Rs. 44.30
- Buy 3: Rs. 38.6
- TP 1: Rs. 58.7
- TP 2: Rs. 67.9
- TP 3: Rs. 74.77
- TP 4: Rs. 86.70
Stop Loss - Below Rs. 34 ON DAY CLOSING
Risk-Reward Ratio- 3.65
aution: Close at least 50% position size at TP1 and then trail SL to avoid losing incurred profits in case of unforeseen market conditions.
PLEASE BOOST AND SHARE THE IDEA IF YOU FIND IT HELPFUL.

Ethereum at PRZ: Bullish Setup _ Short termEthereum ( BINANCE:ETHUSDT ) reacted from the Potential Reversal Zone (PRZ) around the confluence of key Fibonacci levels , the Important Support line and 50_SMA(Daily) .
From an Elliott Wave point of view , we can identify a Expanding Flat (ABC/3-3-5) structure ending right above the Support zone ($2,474-2,437) .
The structure also hints at the formation of a new upward leg , potentially leading ETH toward the Resistance zone ($2,564-$2,524) and the upper line of the Ascending Channel .
I expect Ethereum to test the 38.2%($2,531=First Target) - 50%($2,561) Fibonacci retracement levels on the way to a potential retest of the previous swing highs .
Note: Stop Loss (SL) = $2,451= Worst Stop Loss(SL)
Please respect each other's ideas and express them politely if you agree or disagree.
Ethereum Analyze (ETHUSDT), 15-minute time frame.
Be sure to follow the updated ideas.
Do not forget to put a Stop loss for your positions (For every position you want to open).
Please follow your strategy and updates; this is just my Idea, and I will gladly see your ideas in this post.
Please do not forget the ✅' like '✅ button 🙏😊 & Share it with your friends; thanks, and Trade safe.

BTCUSDT Possible Sell BTCUSDT completed wave 4 of 5 and currently in wave 5 of 5 . wave 5 targets are on green and a possible sell is in place to finish wave 2 of 5 .
Good LUck
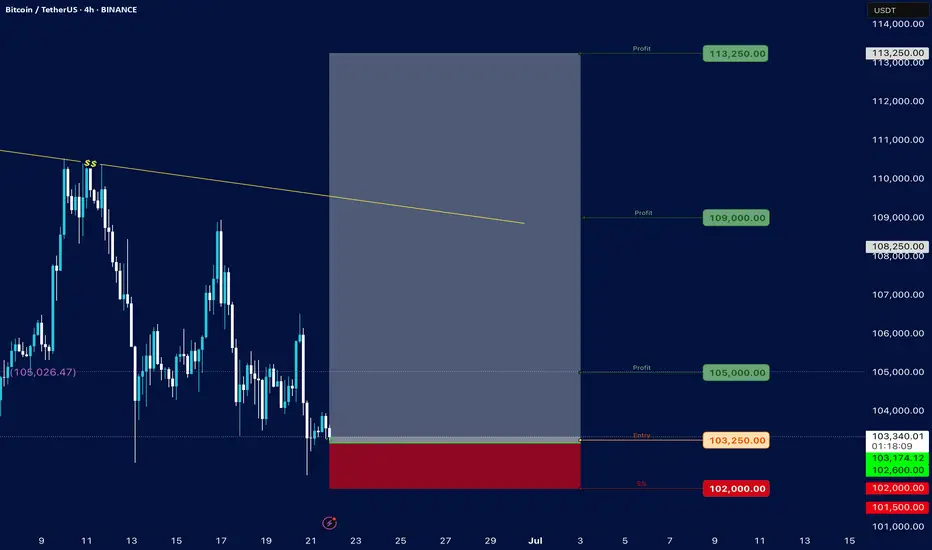
Bitcoin and the geopolitical news BINANCE:BTCUSDT.P
Advanced Technical Analysis of Bitcoin's Structure – Current Situation on Smaller Timeframes
We notice a symmetrical triangle forming on the small timeframes (1-hour and 4-hour), centered in a critical area. Historically, when this price pattern forms, Bitcoin takes no more than three days to confirm its trend. Therefore, the close of the third-day candlestick will serve as a pivotal turning point.
🔹 Immediate Support: 103,400
🔹 Strong Support: 102,500 — a daily low + institutional liquidity zone
🔹 First Resistance: 105,600 — associated with a convergence of moving averages (EMAs)
🔹 Main Resistance: 106,700 — a crossover with the 200-period moving average, which can be described as the largest psychological barrier
---
Possible Scenarios:
☑️ Positive Scenario:
If 105,600 is breached, we are expected to witness an upward movement targeting:
108,000
110,000
118,000 (potentially later)
✅ Catalysts:
Positive US economic data
Regulatory news supporting the markets (such as institutional entry and cryptocurrency regulations)
---
⚠️ Negative Scenario:
If the 102,500 support level is broken, the path will be open to:
100,000
99,000 (strong psychological support area)
❗️ Potential Triggers:
Negative inflation data
Major geopolitical escalation (especially if it directly involves the United States)
🔴 Important Note: I'm not a proponent of trading based on news, but I'm including the US factor because it's the only one I consider truly influential in geopolitical analysis.
The US entering a full-scale war would prompt American investors (who represent about 5% of active traders) to withdraw immediately for fear of long-term repercussions.
🔻 America is making history now, and Trump is managing the situation expertly. He is likely to avoid getting involved in long-term conflicts, focusing on concluding deals and wars strategically.
---
Current Sideways Trading:
Trading continues between the 103,400 and 105,600 levels within the symmetrical triangle.
The future direction will be determined by the following developments:
If the conflict ends and a deal is reached (especially if Iran surrenders), we will witness a strong upward breakout.
If the United States enters the war directly, we expect a downward breakout to levels that may reach 92,000.
---
Technical Conclusion: 💎
Bitcoin is in a critical consolidation phase with a delicate balance between institutional selling pressure at 106,700 and strong buying demand at 102,500.
The next breakout will depend on:
1. A clear breakout of the triangle pattern
2. The strength of the liquidity accompanying the movement
3. Official US developments—regulatory or political
---
Important Clarification:
❌ The recent decline is not directly related to the Iran-Israel war. Rather, it came as a result of:
1. Options expiry
2. Trump's statements about the possibility of direct US intervention, with the arrival of an aircraft carrier in the Middle East
🔍 A war between only two parties doesn't worry the market much, but US intervention is the decisive factor.
✅ America alone is the one that moves the markets.

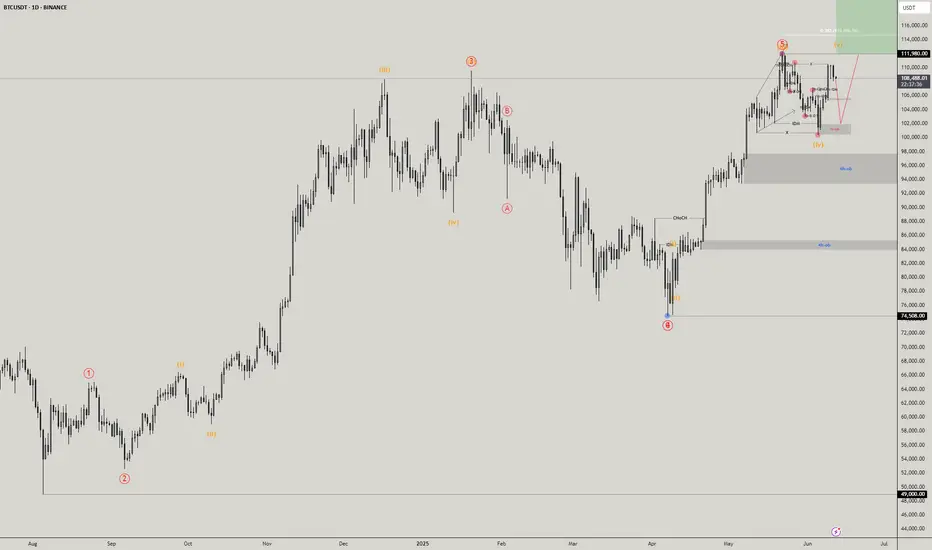
Bitcoin### Bitcoin Price Analysis (June 21, 2025)
#### **Current Price**: $103,236.15 (as of the snapshot)
- The price is hovering near the lower end of the recent range, with key support at **$102,000** (marked as "S/s" on the chart).
- Resistance levels are visible at **$105,000**, **$107,000**, and **$110,000–$114,000**.
#### **Key Observations**:
1. **Support and Resistance**:
- **Strong Support**: $102,000 (critical level; break below could signal further downside).
- **Immediate Resistance**: $105,000 (previous entry point and psychological level).
- **Higher Targets**: $110,000–$114,000 (if bullish momentum returns).
2. **Price Action Context**:
- The price recently rejected the $105,250 level ("Entry") and is now testing lower support.
- The "Profit" markers at $105,000 and $105,026 suggest these were take-profit zones for traders.
3. **Trend and Sentiment**:
- The chart shows consolidation between $102,000–$110,000, with no clear breakout yet.
- A hold above $102,000 could lead to a retest of $105,000, while a break below may target $100,000 or lower.
4. **Volume and Timeframe**:
- The snapshot lacks volume data, but the date range (June–July) suggests a medium-term view.
- Key dates to watch: June 25–28 and early July for potential volatility.
#### **Conclusion**:
- **Bullish Case**: Hold above $102,000 and reclaim $105,000 to aim for $110,000+.
- **Bearish Risk**: Break below $102,000 could accelerate selling toward $100,000 or $99,000.
**Actionable Insight**: Watch the $102,000–$105,000 range for a breakout or breakdown. A rebound from support with volume could signal a buying opportunity, while a drop below $102,000 may indicate further downside.
*(Note: The analysis is based on limited data from the snapshot. For a full assessment, additional indicators like RSI, MACD, and volume would be needed.)*
EURUSD Gearing Up for Next Leg Up – DXY Weakens After PPI MissToday, key U.S. economic indexes were released, providing fresh insights into inflationary pressures and the state of the labor market:
Core PPI m/m:
Actual: 0.1% | Forecast: 0.3% | Previous: -0.4%
Lower than expected – suggests weaker underlying producer inflation.
PPI m/m:
Actual: 0.1% | Forecast: 0.2% | Previous: -0.5%
Slight miss – overall inflation at the producer level remains soft.
Unemployment Claims:
Actual: 248K | Forecast: 242K | Previous: 247K
Slightly higher than forecast – signaling some cooling in the labor market.
Market Outlook :
These data releases point toward cooling inflation and softness in job growth, which may strengthen the dovish narrative around the Fed’s next move.
DXY Index ( TVC:DXY ) is under pressure, and EURUSD ( FX:EURUSD ) is showing signs of bullish momentum .
-----------------------------------------------------------
Now let's take a look at the EURUSD chart on the 1-hour time frame .
EURUSD is trading near the Heavy Resistance zone($1.182-$1.160) and Monthly Resistance(2) .
In terms of Elliott Wave theory , EURUSD appears to be completing microwave 4 . Microwave 4 could be completed at one of the Fibonacci levels .
I expect EURUSD to attack the Heavy Resistance zone($1.182-$1.160) at least once more after completing microwave 4 and could even rise to the Potential Reversal Zone(PRZ) .
Note: If EURUSD touches $1.1446 , we can expect more dump.
Please respect each other's ideas and express them politely if you agree or disagree.
Euro/U.S. Dollar Analyze (EURUSD), 1-hour time frame.
Be sure to follow the updated ideas.
Do not forget to put a Stop loss for your positions (For every position you want to open).
Please follow your strategy and updates; this is just my Idea, and I will gladly see your ideas in this post.
Please do not forget the ✅' like '✅ button 🙏😊 & Share it with your friends; thanks, and Trade safe.

NEXT WEEK CHECK EURUSD SIGNAL READ CAPTAINEntry: around 1.15220)1.15125 ✅
Take Profit 1.14950 ✅
Take Profit 2:1.14725 ✅
Last Target:1.14325✅
Stop Loss: 1.15530❌

"XAUUSD – Hidden Strength Within the Accumulation Zone"Hello everyone, how are you currently evaluating XAUUSD?
Yesterday, gold remained relatively stable without major volatility, yet continued to be supported by a favorable macro environment. Escalating tensions between Israel and Iran have sustained safe-haven demand. While the U.S. has yet to make a direct military move, President Trump’s emergency meeting and firm stance have increased market caution, which in turn boosted interest in gold.
At the time of writing, gold is trading around $3,368, and the long-term trend still favors the bulls. But why do I say that?
From both a technical and macro perspective, gold is in a healthy accumulation phase. Although it hasn’t broken above the record high, XAUUSD remains safely above key support zones — especially above the EMA 34 — which continues to affirm its bullish structure.
EMA 34 remains a strong dynamic support, with a clear separation from EMA 89, reinforcing the momentum. Even if we see short-term pullbacks in the next few sessions, they are more likely technical retests rather than signs of reversal.
Adding to that, the rising trendline, higher support levels, and bullish candlestick patterns all strengthen the case for continued upward movement. These combined factors paint a positive technical outlook for gold in the medium to long term.
From my perspective, I remain confident in gold’s long-term uptrend. What about you? Feel free to share your thoughts!

Jana SFB- Trendline Breakout + Base Formed –Fibonacci Extension Levels:
1.0 = ₹365.75 (key breakout base)
1.618 = ₹1,011.95 (potential target)
Horizontal Support: Around ₹365–₹370 (marked by prior structure & 1.0 Fib level)
Descending Trendline: Broken recently — this breakout indicates short-term reversal from downtrend.
Volume Spike: Circled area indicates high volume + price bounce = potential reversal confirmation.
Recent High: ₹495.35
Current Price: ₹486.75
🧠 Technical Observations:
Trend Shift:
Price has broken above a falling trendline and is now consolidating sideways above former resistance.
This suggests accumulation after a breakout.
Support Zones:
₹365–₹370 (Fibonacci 1.0 level + previous bottom) — very strong base support.
₹445–₹455 (recent consolidation zone) — short-term support.
Target Zones (Based on Fib Extension):
Mid-term: ₹565 (horizontal resistance)
Long-term: ₹760 (swing high)
Fib 1.618 target: ₹1,011.95 — optimistic projection, only valid in case of a strong trending move.
📉 RSI Analysis:
Current RSI: 45.87 — weak, slightly bearish bias.
RSI-based MA: 52.44 — RSI is below average, indicating loss of recent momentum.
However, no bearish divergence seen.
📌 Summary:
Trend: Shifted from downtrend to base-building and sideways consolidation.
Breakout Confirmation: Seen with volume near the circled support, followed by gradual up-move.
Current Phase: Likely accumulation/consolidation before the next move.
Trigger Levels:
Break above ₹500 could reignite bullish momentum.
Hold above ₹445–₹455 is crucial to sustain structure.

PEPEUSDT LONGGGGGGGGood entry for a long position. Support tested a few rounds before and it stand still. As a support, it is also at its lowest support zone.
Risk & Reward Ratio: 1:5
Worth trying🆙⬆️🆙⬆️

fartcoin trade ideathe orange impulsive wave is unfolding however the wave 3 is very weak and it didn't even took the wave 1 high but it is still allowed and can be called weak wave 3 so Wave 4 should unfold the support zones are mentioned with green box as area of opportunity I expect the wave 5 to be the biggest wave compared to 1 and 3 target for wave 5 is also mentioned

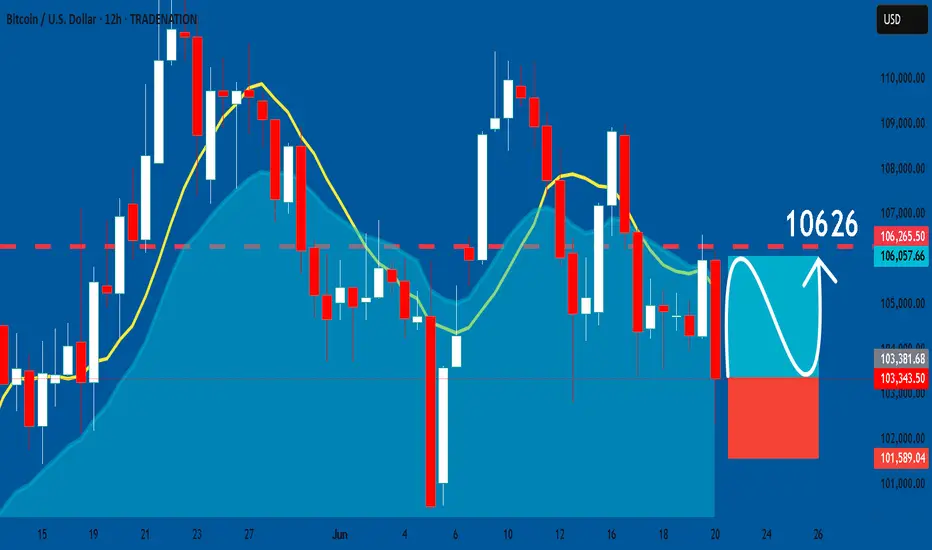
BTCUSD: Trading Signal From Our Team
BTCUSD
- Classic bullish formation
- Our team expects pullback
SUGGESTED TRADE:
Swing Trade
Long BTCUSD
Entry - 10334
Sl - 10158
Tp - 10626
Our Risk - 1%
Start protection of your profits from lower levels
Disclosure: I am part of Trade Nation's Influencer program and receive a monthly fee for using their TradingView charts in my analysis.
❤️ Please, support our work with like & comment! ❤️
bullish wedge inside a rising channel-double trap for bearsInside the major upward channel, gold formed a falling wedge — and, of course, faked a breakdown. But the move reversed quickly: price reclaimed the wedge, surged on volume, and held above the key 3363–3368 area. This isn't just a bounce — it's a structural reclaim in line with the broader trend.
Price is now in the upper part of the rising channel and has broken a local downtrend line, reinforcing the bullish signal. Consolidation around 3380–3395 might be the last pause before acceleration. Above that lies a volume gap — no resistance until 3452.
MACD is flipping bullish, RSI turning upward, and volume confirms smart money presence. Classic: trap below, breakout above. As long as 3363 holds — longs remain in control.

JUBS LONG TRADE 21-06-2025 (textile sector) JUBS BUY CALL | 21 JUNE 2025
JUBS stock previously gave an amazing uptrend which ended in a buying climax after touching a high of 29.3 rupees. Afterwards, it has been in a corrective downward trend and made a low of 7.78 rupees. Very recently, after making the low, the stock has taken a strong support from a long-term trend line at around this level and has clear indications of embarking upon a new uptrend.
🚨 TECHNICAL BUY CALL – JUBS 🚨
Buy Levels:
Buy 1: 11.23 rupees
Buy 2: 9.30 rupees
Buy 3: 7.80 rupees
Target Prices:
TP 1: 13.78 rupees
TP 2: 16.40 rupees
TP 3: 17.78 rupees
TP 4: 19.80 rupees
Stop Loss (Closing Basis): Below 5.70 rupees | Risk Reward Ratio: 1:2.9
Caution:
Please buy in 3 parts within the buying range. Close at least 50% of your position at TP1 and trail the stop loss to protect profits in case of unforeseen market conditions.
📢 Disclaimer: Redistribution or use of these signals without prior permission and proper credit to The Chart Alchemist (TCA) is strictly prohibited — especially by paid groups. We are completely independent and not affiliated with any brokerage.
If you find this idea valuable, kindly support by boosting and sharing it!

FZCM LONG TRADE 21-06-2025FZCM stock previously was in a downtrend after posting a high of 300 rupees. It remained under pressure until May 2023. Since then, it has traded in a range between 112 and 200 rupees for almost two years. Recently, it has shown indications of an upward breakout and formed a bullish IFDZ. After establishing this pattern, the stock pulled back to the zone and has now displayed strong signs of upward movement. We expect this new uptrend to continue in the coming days, targeting multiple quantified displacement levels.
🚨 TECHNICAL BUY CALL – FZCM 🚨
Buy Levels:
Buy 1: 187 rupees (current price)
Buy 2: 170 rupees
Buy 3: 156 rupees
Target Prices:
TP 1: 230 rupees
TP 2: 270 rupees
TP 3: 290 rupees
Stop Loss: Below 140 rupees - Day Closing
Risk Reward Ratio:4.7
Caution:
Please buy in 3 parts within the buying range. Close at least 50% of your position at TP1 and trail the stop loss to protect profits in case of unforeseen market conditions.
📢 Disclaimer: Redistribution or use of these signals without prior permission and proper credit to The Chart Alchemist (TCA) is strictly prohibited — especially by paid groups. We are completely independent and not affiliated with any brokerage.
If you find this idea valuable, kindly support by boosting and sharing it!

BTCUSDT - major support, Cut n Reverse Area??#BTCUSDT... market just r ached at his one of the most expensive area of the week and month
Keep close 101200
That is our ultimate supporting area.
Note: below 101200 we will cut n reverse on confirmation.
Good luck
Trade wisely

GOLD Bearish Breakout!
HI,Traders !
#GOLD is trading in a
UPtrend and Broke our of the bearish
Wedge pattern then made
A retest and is going down
Now so we are bearish
Biased and we will be
Expecting a further move down !
Comment and subscribe to help us grow !

What Happens Next? Has the up move started !?In line with my previous analysis, the price rose back above the lower trend line. Now looking at the detail of the bearish waves, it is possible that an up move could take the price to at least around 3440. That is my expectation. Keep in mind that this is a forecast as a result of an analysis.
