Altseason 2025 – Wave 3 in playIn this Elliott Wave setup, Wave 2 appears to be bottoming out now. As Bitcoin dominance shows signs of declining, capital rotation into altcoins could ignite the powerful Wave 3. Historically, Wave 3 is the most explosive phase, often driving sharp, sustained gains across the altcoin market.
Wave Analysis

BABA Stock: A Detailed Analysis using Elliott Wave Theory RulesHello Friends,
Welcome to RK_Chaarts,
Let's analyze Ali Baba Group Holdings Limited, also known as BABA, listed on the NYSE. We'll be using the Elliott Waves theory.
Friends, as we can clearly see, after hitting a low of around $95.75 on 9th April 2025, it started an impulse wave. Within this wave, we've completed intermediate degree blue bracketed (1), (2), (3), (4), (5), and primary degree ((1)) in Black. Currently, we're completing primary degree ((2)), with a low around $111.
If it breaks the level of $111, we'll assume we're still in primary degree ((2)), as marked in scenario 2 on the chart. This means wave ((2)) is unfolding, and wave ((3)) might start after wave ((2)) is complete.
If it doesn't break the $111 level, it's likely that wave ((2)) has completed, and we've started a subdivision of wave ((3)) or its further subdivisions. If it moves further up, following scenario 1 (the black line on the chart), this is a possibility.
According to Elliott Wave theory, wave ((2)) cannot retrace more than 100% of wave ((1)). So, our main invalidation level for this count is $95.75. Yes, BABA is turning up against the 95.75 low, and in the near term, we expect the stock to trade higher.
Somewhere, this stock might move towards $150 or $160 if it doesn't break down below $ 95.75.
I am not Sebi registered analyst.
My studies are for educational purpose only.
Please Consult your financial advisor before trading or investing.
I am not responsible for any kinds of your profits and your losses.
Most investors treat trading as a hobby because they have a full-time job doing something else.
However, If you treat trading like a business, it will pay you like a business.
If you treat like a hobby, hobbies don't pay, they cost you...!
Hope this post is helpful to community
Thanks
RK💕
Disclaimer and Risk Warning.
The analysis and discussion provided on in.tradingview.com is intended for educational purposes only and should not be relied upon for trading decisions. RK_Chaarts is not an investment adviser and the information provided here should not be taken as professional investment advice. Before buying or selling any investments, securities, or precious metals, it is recommended that you conduct your own due diligence. RK_Chaarts does not share in your profits and will not take responsibility for any losses you may incur. So Please Consult your financial advisor before trading or investing.

Bellevue Gold - chart indicates recovery after 30% dropHi, thanks for viewing.
I'm going to look deeper into Bellevue and position myself for a significant purchase. But won't be buying just yet.
So, some people see Elliot Wave as reading tea-leaves or goat entrails. But, it does help with market timing sometimes. It isnt everything. But, I find it helpful, especially when combined with 'coincident targets' using Elliot Wave, support and resistance, and RSI divergence.
If the correction is an "A-B-C" three wave correction, the third wave, wave C is often the same length as wave A.
RSI divergence, I look for three lower lows on the price chart, paired with three higher lows on the RSI the first two in the over-sold area and the third higher low fails to push into the over-sold RSI region / below 30. For these conditions, it appears one more drop seems warranted.
But would have to look into the fundamentals, because the gold price just had its highest weekly close. It is hard to see it going lower in this environment without major cost-overruns / profitability challenges / technical mining bottle-necks.
The red box denotes an area where I believe the Elliot wave rules have been breached. Normally Wave C would have five sub-waves. Wave (v) may unfold, but it looks to be the shortest of the three sub-waves if it reaches my blue box target. One EW rule is that wave (iii) may not be the shortest of the three, but it can be shorter than wave (i). In this bullish gold price environment, the 30% drop may not occur. Will have to look into it. For now, watching from the sideline. Good luck everyone.

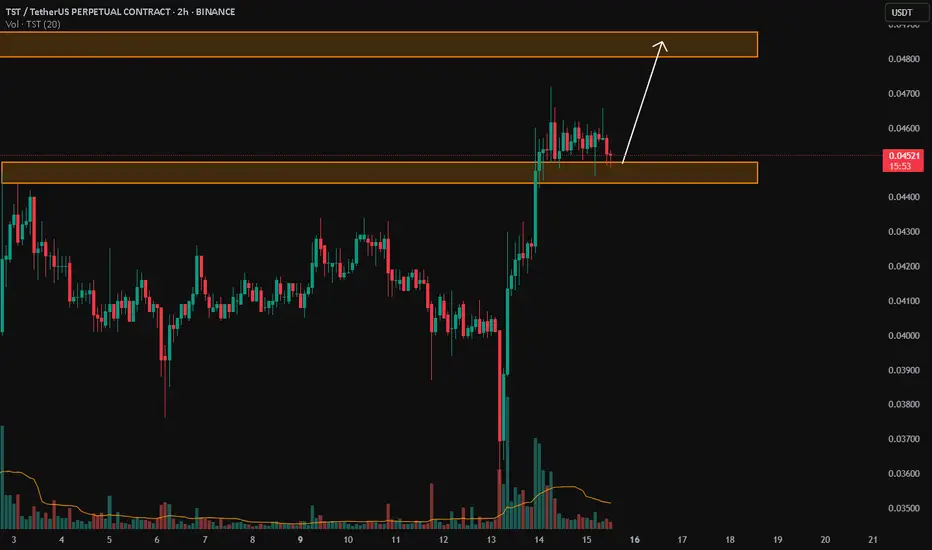
TST/USDTKey Level Zone: 0.04440 0.04500
LMT v2.0 detected.
The setup looks promising—price previously trended upward with rising volume and momentum, then retested this zone cleanly. This presents an excellent reward-to-risk opportunity if momentum continues to align.
Introducing LMT (Levels & Momentum Trading)
- Over the past 3 years, I’ve refined my approach to focus more sharply on the single most important element in any trade: the KEY LEVEL.
- While HMT (High Momentum Trading) served me well—combining trend, momentum, volume, and structure across multiple timeframes—I realized that consistently identifying and respecting these critical price zones is what truly separates good trades from great ones.
- That insight led to the evolution of HMT into LMT – Levels & Momentum Trading.
Why the Change? (From HMT to LMT)
Switching from High Momentum Trading (HMT) to Levels & Momentum Trading (LMT) improves precision, risk control, and confidence by:
- Clearer Entries & Stops: Defined key levels make it easier to plan entries, stop-losses, and position sizing—no more guesswork.
- Better Signal Quality: Momentum is now always checked against a support or resistance zone—if it aligns, it's a stronger setup.
- Improved Reward-to-Risk: All trades are anchored to key levels, making it easier to calculate and manage risk effectively.
- Stronger Confidence: With clear invalidation points beyond key levels, it's easier to trust the plan and stay disciplined—even in tough markets.
Whenever I share a signal, it’s because:
- A high‐probability key level has been identified on a higher timeframe.
- Lower‐timeframe momentum, market structure and volume suggest continuation or reversal is imminent.
- The reward‐to‐risk (based on that key level) meets my criteria for a disciplined entry.
***Please note that conducting a comprehensive analysis on a single timeframe chart can be quite challenging and sometimes confusing. I appreciate your understanding of the effort involved.
Important Note: The Role of Key Levels
- Holding a key level zone: If price respects the key level zone, momentum often carries the trend in the expected direction. That’s when we look to enter, with stop-loss placed just beyond the zone with some buffer.
- Breaking a key level zone: A definitive break signals a potential stop‐out for trend traders. For reversal traders, it’s a cue to consider switching direction—price often retests broken zones as new support or resistance.
My Trading Rules (Unchanged)
Risk Management
- Maximum risk per trade: 2.5%
- Leverage: 5x
Exit Strategy / Profit Taking
- Sell at least 70% on the 3rd wave up (LTF Wave 5).
- Typically sell 50% during a high‐volume spike.
- Move stop‐loss to breakeven once the trade achieves a 1.5:1 R:R.
- Exit at breakeven if momentum fades or divergence appears.
The market is highly dynamic and constantly changing. LMT signals and target profit (TP) levels are based on the current price and movement, but market conditions can shift instantly, so it is crucial to remain adaptable and follow the market's movement.
If you find this signal/analysis meaningful, kindly like and share it.
Thank you for your support~
Sharing this with love!
From HMT to LMT: A Brief Version History
HM Signal :
Date: 17/08/2023
- Early concept identifying high momentum pullbacks within strong uptrends
- Triggered after a prior wave up with rising volume and momentum
- Focused on healthy retracements into support for optimal reward-to-risk setups
HMT v1.0:
Date: 18/10/2024
- Initial release of the High Momentum Trading framework
- Combined multi-timeframe trend, volume, and momentum analysis.
- Focused on identifying strong trending moves high momentum
HMT v2.0:
Date: 17/12/2024
- Major update to the Momentum indicator
- Reduced false signals from inaccurate momentum detection
- New screener with improved accuracy and fewer signals
HMT v3.0:
Date: 23/12/2024
- Added liquidity factor to enhance trend continuation
- Improved potential for momentum-based plays
- Increased winning probability by reducing entries during peaks
HMT v3.1:
Date: 31/12/2024
- Enhanced entry confirmation for improved reward-to-risk ratios
HMT v4.0:
Date: 05/01/2025
- Incorporated buying and selling pressure in lower timeframes to enhance the probability of trending moves while optimizing entry timing and scaling
HMT v4.1:
Date: 06/01/2025
- Enhanced take-profit (TP) target by incorporating market structure analysis
HMT v5 :
Date: 23/01/2025
- Refined wave analysis for trending conditions
- Incorporated lower timeframe (LTF) momentum to strengthen trend reliability
- Re-aligned and re-balanced entry conditions for improved accuracy
HMT v6 :
Date : 15/02/2025
- Integrated strong accumulation activity into in-depth wave analysis
HMT v7 :
Date : 20/03/2025
- Refined wave analysis along with accumulation and market sentiment
HMT v8 :
Date : 16/04/2025
- Fully restructured strategy logic
HMT v8.1 :
Date : 18/04/2025
- Refined Take Profit (TP) logic to be more conservative for improved win consistency
LMT v1.0 :
Date : 06/06/2025
- Rebranded to emphasize key levels + momentum as the core framework
LMT v2.0
Date: 11/06/2025
- Fully restructured lower timeframe (LTF) momentum logic
- Enhanced entry timing for better precision and alignment with key levels
XRP's Ending Diagonal: Climactic Push Towards $3.5-$3.8?XRP: Ending Diagonal & Final Push ($3.5-$3.8 Target)
Hello TradingView,
My analysis suggests XRP is in its 5th Elliott Wave, unfolding as an Ending Diagonal. This pattern signals a climactic end to the current bullish cycle, often followed by a sharp reversal.
Key Levels:
Target: $3.50 - $3.80 (marked on chart). This aligns with the diagonal's upper trendline and Fibonacci extensions.
Invalidation: $1.5986 (marked in red). A decisive close below this level invalidates the diagonal structure.
Catalysts: Positive SEC lawsuit developments and Spot XRP ETF speculation provide fundamental tailwinds for this final push.
Outlook: Expect a significant correction after this diagonal completes near its target. Monitor $1.5986 closely.
Not financial advice. Trade wisely.
#XRP #Ripple #ElliottWave #EndingDiagonal #Crypto #TechnicalAnalysis #PriceTarget #Invalidation #Reversal #SEC #ETF #Blockchain #MarketAnalysis #Bullish #Altcoin #TradingStrategy

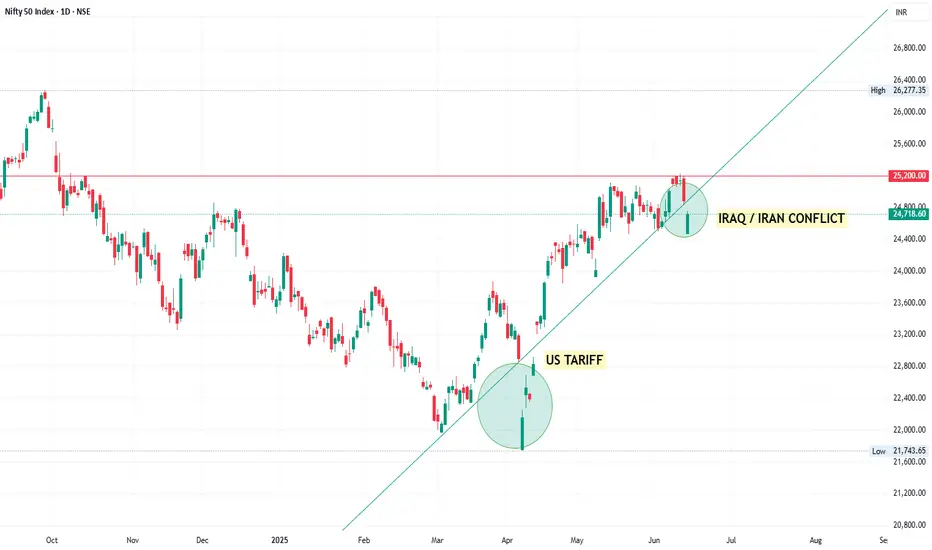
Buy on Dips is evident Uptrend Post-March 2025
The US Tariff news, though causing a temporary dip, didn’t break the trendline, indicating strong buying interest on dips.
Event-Driven Dips
US Tariff News (Early April):
Caused a sharp red candle, but was quickly bought into, forming a bullish pattern — often a sign of trend continuation.
Iraq/Iran Conflict (Early June):
Another dip occurred, briefly violating the trendline but closing with a large green candle — market resilience noted again.
Market Psychology & Sentiment
Buy-on-dips Strategy seems to dominate.
Events like tariffs or geopolitical tensions are triggering knee-jerk reactions, but institutional support is evident.
Technical Takeaways:
Trendline Support (starting from March low) remains valid; multiple touches confirm its strength.
25,200 is a key horizontal resistance; a decisive breakout above this may fuel fresh highs.
Watch for:
Break above 25,200: likely continuation toward 26,000+
Breakdown below 24,200: could test 23,600 and then 22,800
$NRW gap to Fill, bullish, Head and Shoulder breaks neckline🔍 Current Technical Setup
Price: $2.92 AUD
Trend: Recent bullish reversal from lows near $2.00
Volume: Increasing volume on the uptrend — a bullish sign of accumulation.
Moving Averages:
Short-Term EMA (10): $2.82 — price is above = bullish.
EMA (50): $2.61 — price is also above = uptrend intact.
SMA (200): $3.25 — price below = long-term resistance remains.
🧠 Key Chart Patterns & Levels
Structure: Cup & Handle / Inverted Head and Shoulders-like bottom formation from the April–June base.
Breakout Zone: Just broke through minor resistance around $2.90 with strong volume.
Gap Fill Zone: Between $3.10–$3.30 (highlighted grey box). This is a key target area where price previously sold off — likely to act as resistance.
Major Resistance: The 200-day SMA at $3.25 aligns with the upper edge of the gap zone = high confluence resistance.
📈 Bullish Scenario (High Probability ~60–70%)
Price continues to rally on strong volume to test the gap resistance zone.
Target: $3.10 to $3.30 in the short term (5–15% upside).
A daily close above $3.30 would confirm a structural breakout toward previous highs near $3.80–$4.00 (medium-term target).
📉 Bearish Scenario (~30–40% Probability)
Price rejects off $2.90–$3.00 and retests support at the 50 EMA (~$2.60).
If it loses the $2.50 level again, the structure weakens and re-tests lows near $2.10–$2.20 become possible.
🎯 Trading Strategy & Risk
Entry zone (momentum): $2.85–$2.95 (already underway).
Short-term Target: $3.10–$3.30
Medium-term Target: $3.80
Stop loss: Below $2.70 (just under the 50 EMA and recent swing low).
Risk:Reward: About 1:2 or better toward the gap fill.
🧠 Summary
NRW (NWH) is showing a strong bullish reversal from a major base with increasing volume. The short-term structure supports a gap fill to $3.10–$3.30, with a medium-term potential back to $3.80 if it breaks the 200 SMA cleanly. However, resistance is expected near that region and caution is warranted around $3.25.
Would you like a trade plan or probability table next?

EURGBP BUY?Market is reacting to Fib area on Weekly time frame. Based on 4HR TF, the market seems to be forming a possible reversal pattern which could lead to a possible reversal.
We could see BUYERS coming in strong should the current level hold.
Disclaimer:
Please be advised that the information presented on TradingView is solely intended for educational and informational purposes only.The analysis provided is based on my own view of the market. Please be reminded that you are solely responsible for the trading decisions on your account.
High-Risk Warning
Trading in foreign exchange on margin entails high risk and is not suitable for all investors. Past performance does not guarantee future results. In this case, the high degree of leverage can act both against you and in your favor

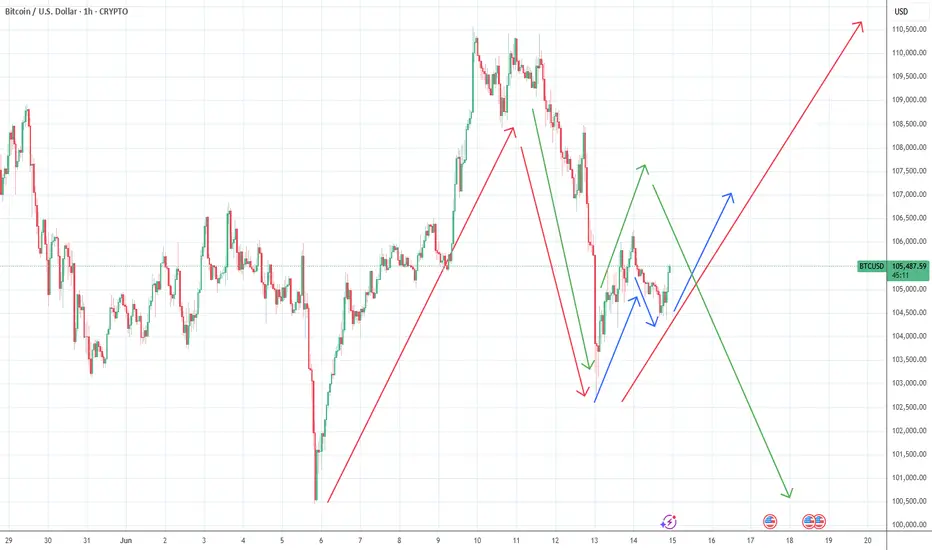
$BTC Weekend Update - June 14Hello Fellow Degenerates,
Bitcoin is holding above 104k helping us a lot when it comes to our bullish scenario, however the bearish scenario still lingers and threatens to destroy all of our hopes, dreams and portfolios.
- We need price to break above 108k to confirm our bullish bias
- A rejection of 106k could bring price to retest 104k and possibly break it, validating our bearish scenario
- Levels to watch: 110.5k, 108.4k, 106.8k, 104.3k, 101k

FARTCOIN | Dream scenarioTextbook ABC correction into the $0.83–0.75 zone.
Will the fartcoin gods let us bid sub $1 again? Odds are low, but man can dream.
If filled, expecting a big wave up — ultimate R/R.
Main risk: market front-runs and never fills — be nimble, ladder bids if you're serious.
"If you get the dream fill, don't fumble the bag."


BTC 3 ways , but longhallo , i think BTC its for long , but any way on my chart you can see all possibilitys .